
- English
- Deutsch
- Español
- Français
- Italiano
- Português
You need a single view of fan speed (RPM), thermal status, and temperature sensors across servers, storage, and network hardware — before heat turns into a stability problem. PRTG collects available fan and thermal metrics via standard infrastructure methods like SNMP, IPMI, and Redfish, then applies thresholds and sends notifications your team can act on. The result is faster troubleshooting, clearer diagnostics, and fewer blind spots across multi-vendor and multi-site environments.
Supported technologies (examples): Dell, HPE, Lenovo, Fujitsu, NetApp, Cisco UCS (plus SNMP-capable environment/IoT sensors)

In mixed environments, fan health data lives across vendor tools and local interfaces. Consolidating it into one view makes it significantly faster to answer basic questions about cooling status across your hardware.
PRTG brings fan monitoring into one place, so you can review fan status, fan speed, and fan RPM (where the device exposes it) alongside temperature readings. You get a clear view of system fans across servers and other hardware, without jumping between consoles.
Fan behavior and temperature trends give you early signals worth acting on. Having thresholds and notifications configured in advance means your team is aware of changes as they develop, not after they've already affected hardware stability.
With PRTG, you can set thresholds on the fan and thermal metrics your hardware exposes, then get notifications when values move outside the range you care about. That turns fan performance and temperature monitoring into something you can manage day to day, with full visibility into how conditions evolve over time.
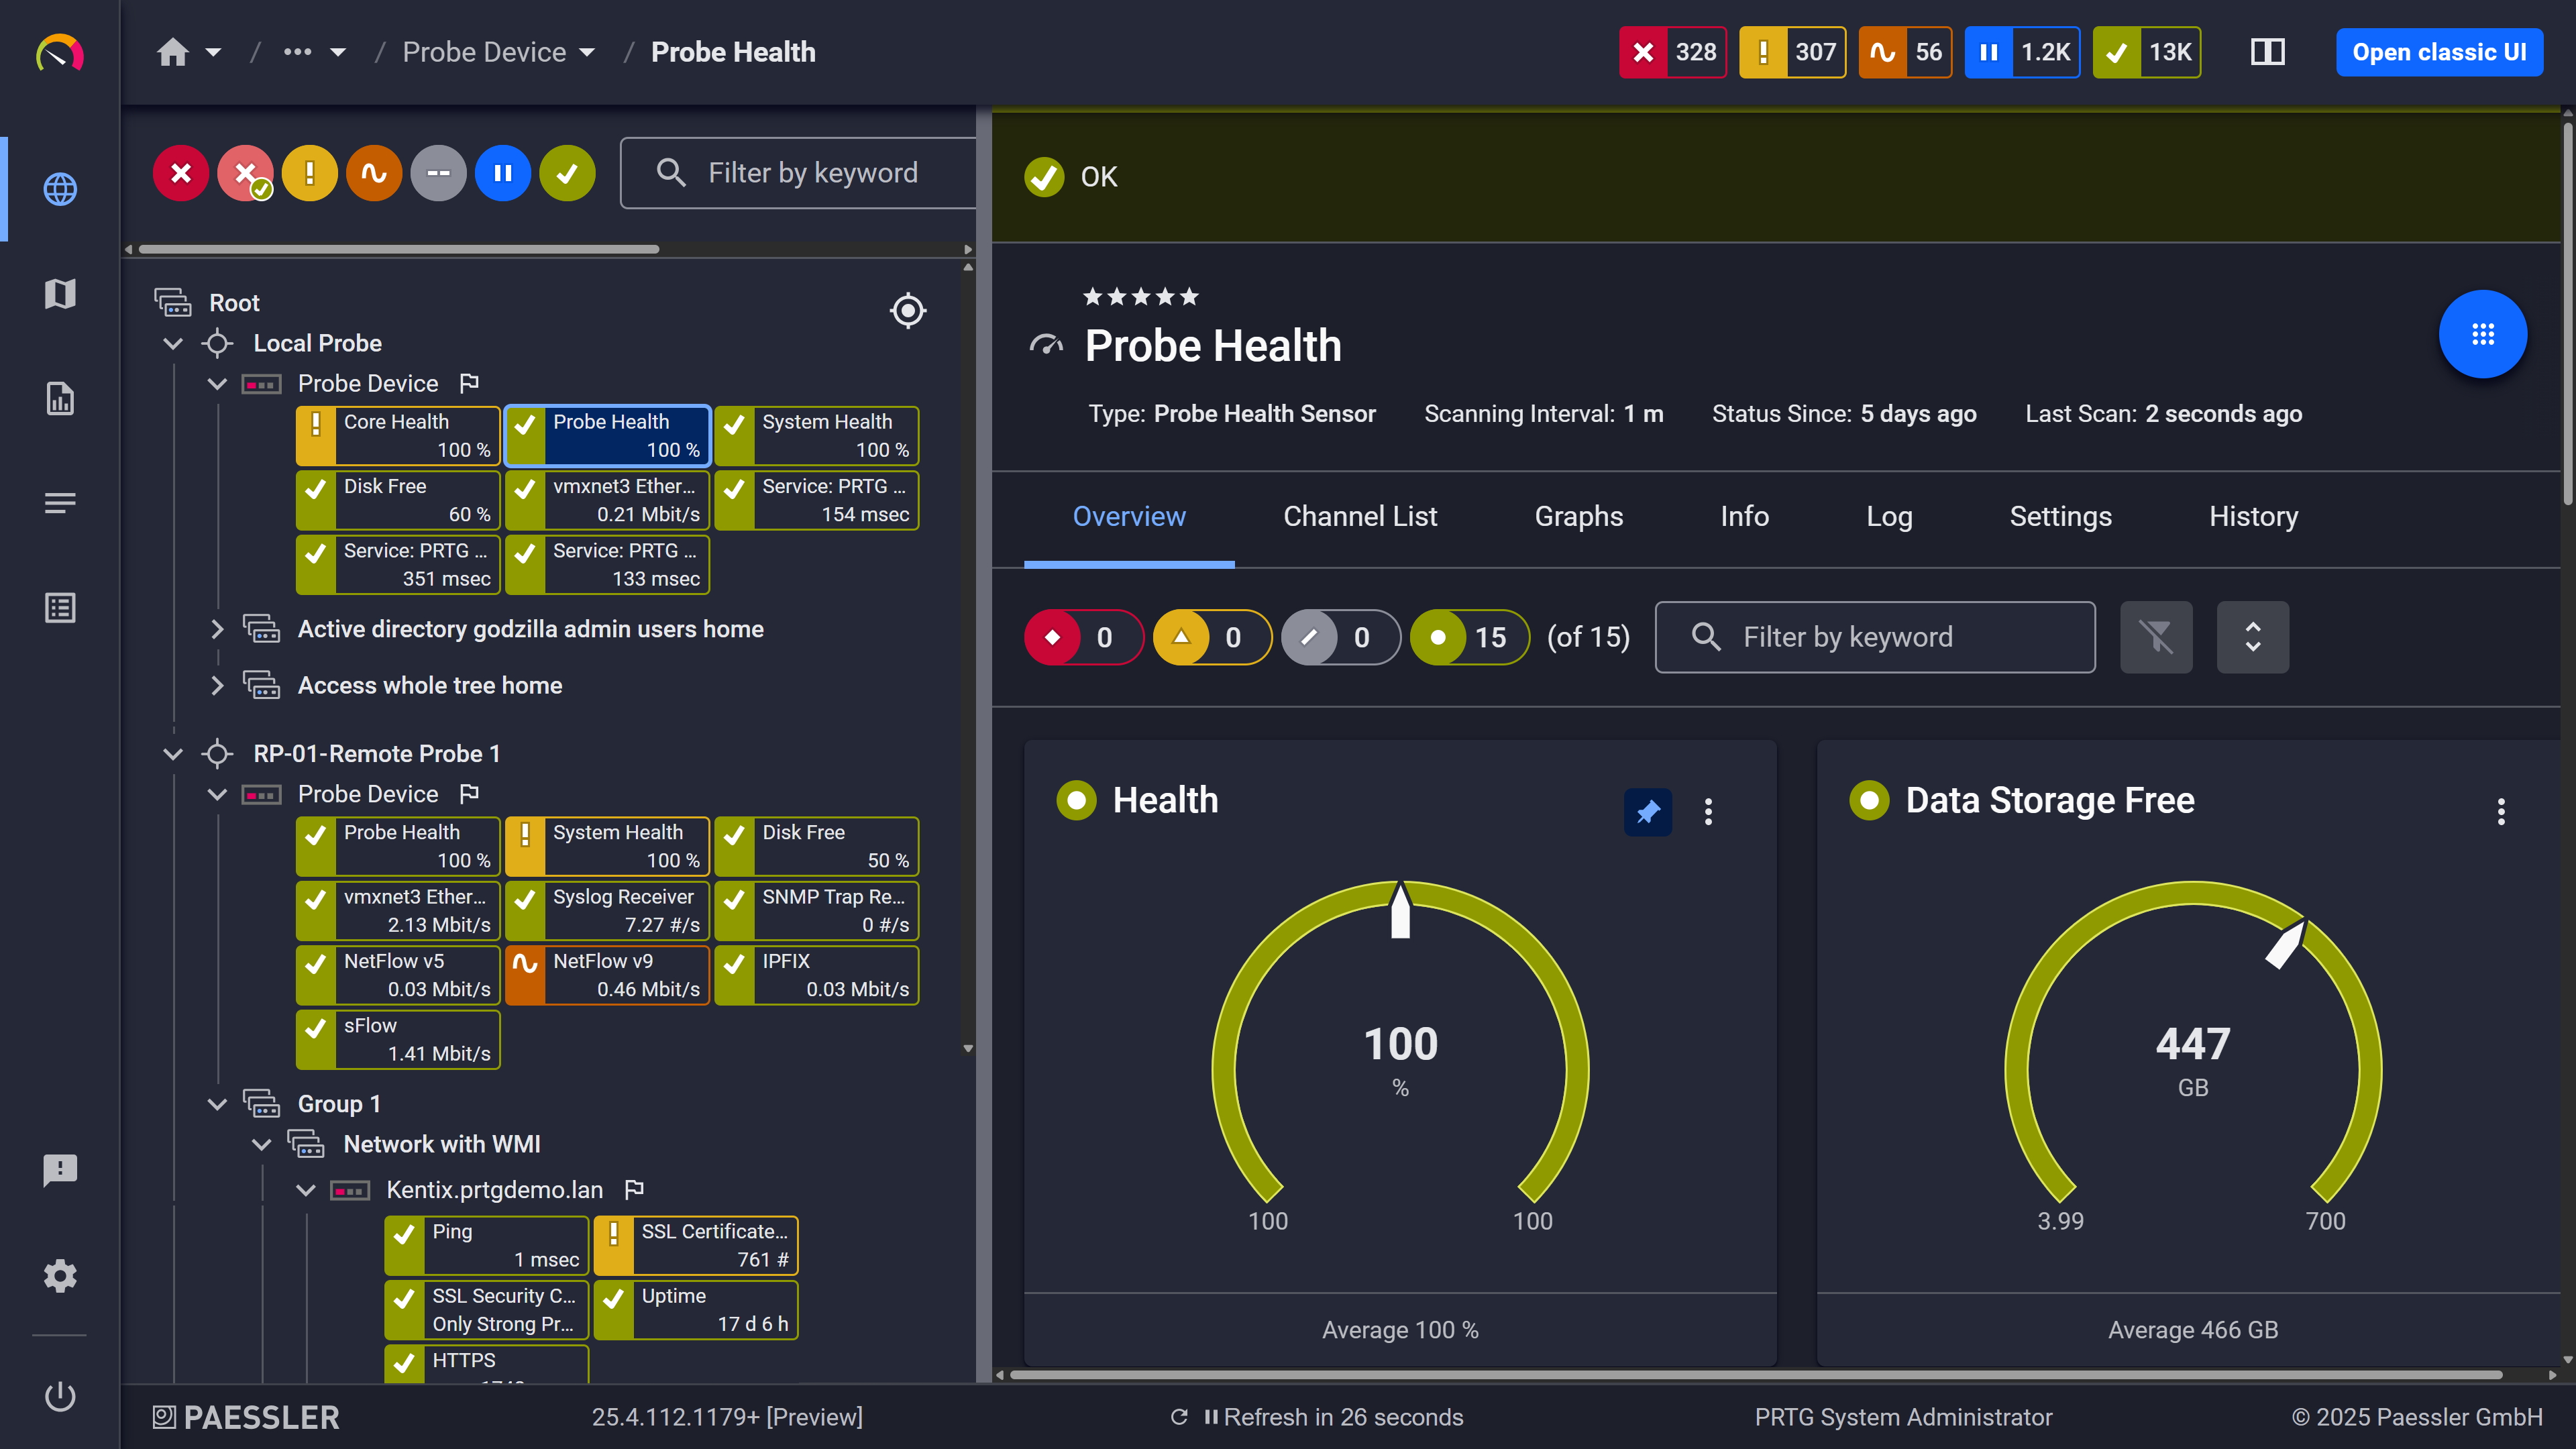
Probe health at a glance

Live graphs, real-time performance data
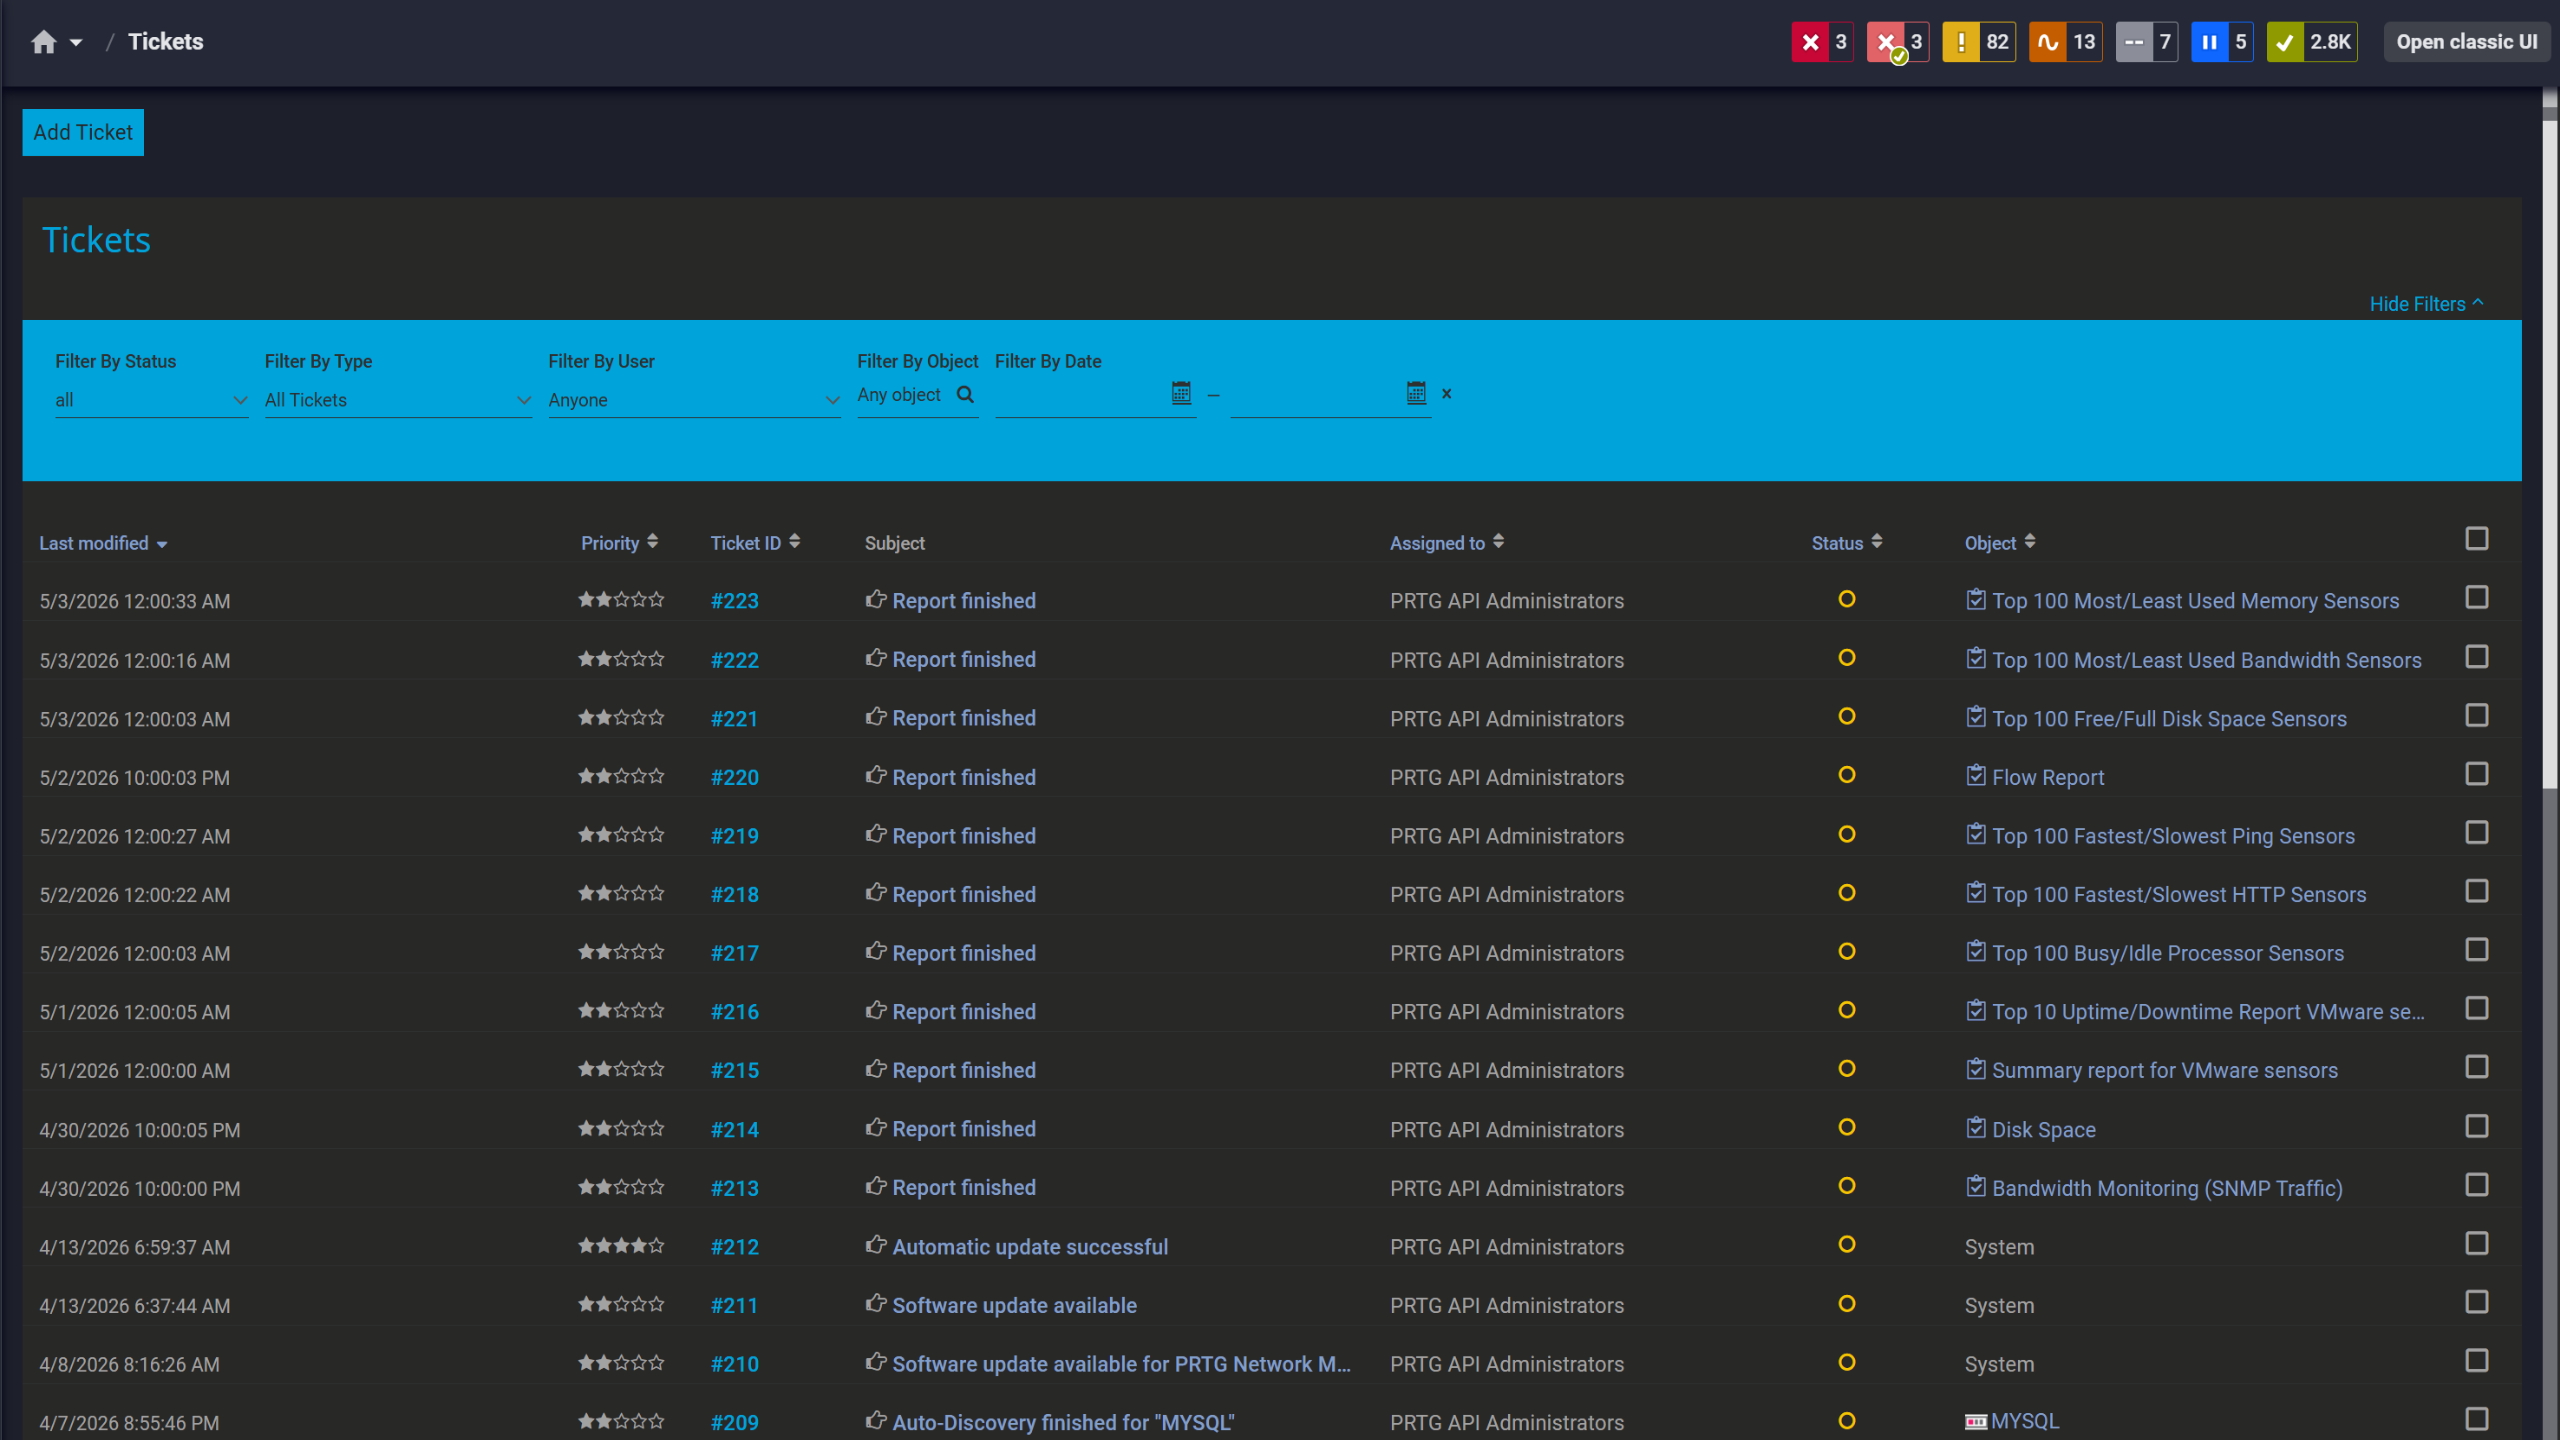
Tickets keep your team aligned
When temperatures rise, the first question is whether the issue is isolated to one device or part of a broader pattern. Having fan monitoring and temperature monitoring in the same view makes that assessment faster and more reliable.
PRTG keeps the key metrics together so you can compare fan speed or fan status with temperature readings in the same view, including CPU temperature where your platform provides it. That makes diagnostics more direct and helps you move quickly to the next check that actually matters.
Start monitoring your infrastructure in minutes. No professional services, no complex configuration, no risk.
Multi-site setups benefit from consistent cooling visibility, especially in small server rooms and remote locations where local checks don't scale well and centralized oversight matters most.
PRTG supports distributed monitoring so you can apply the same fan health and temperature monitoring across locations and review results centrally. This helps keep standards consistent across different operating systems and hardware types, including Microsoft Windows and Linux environments.

Full device list, instant overview

Scheduled reports, always on time
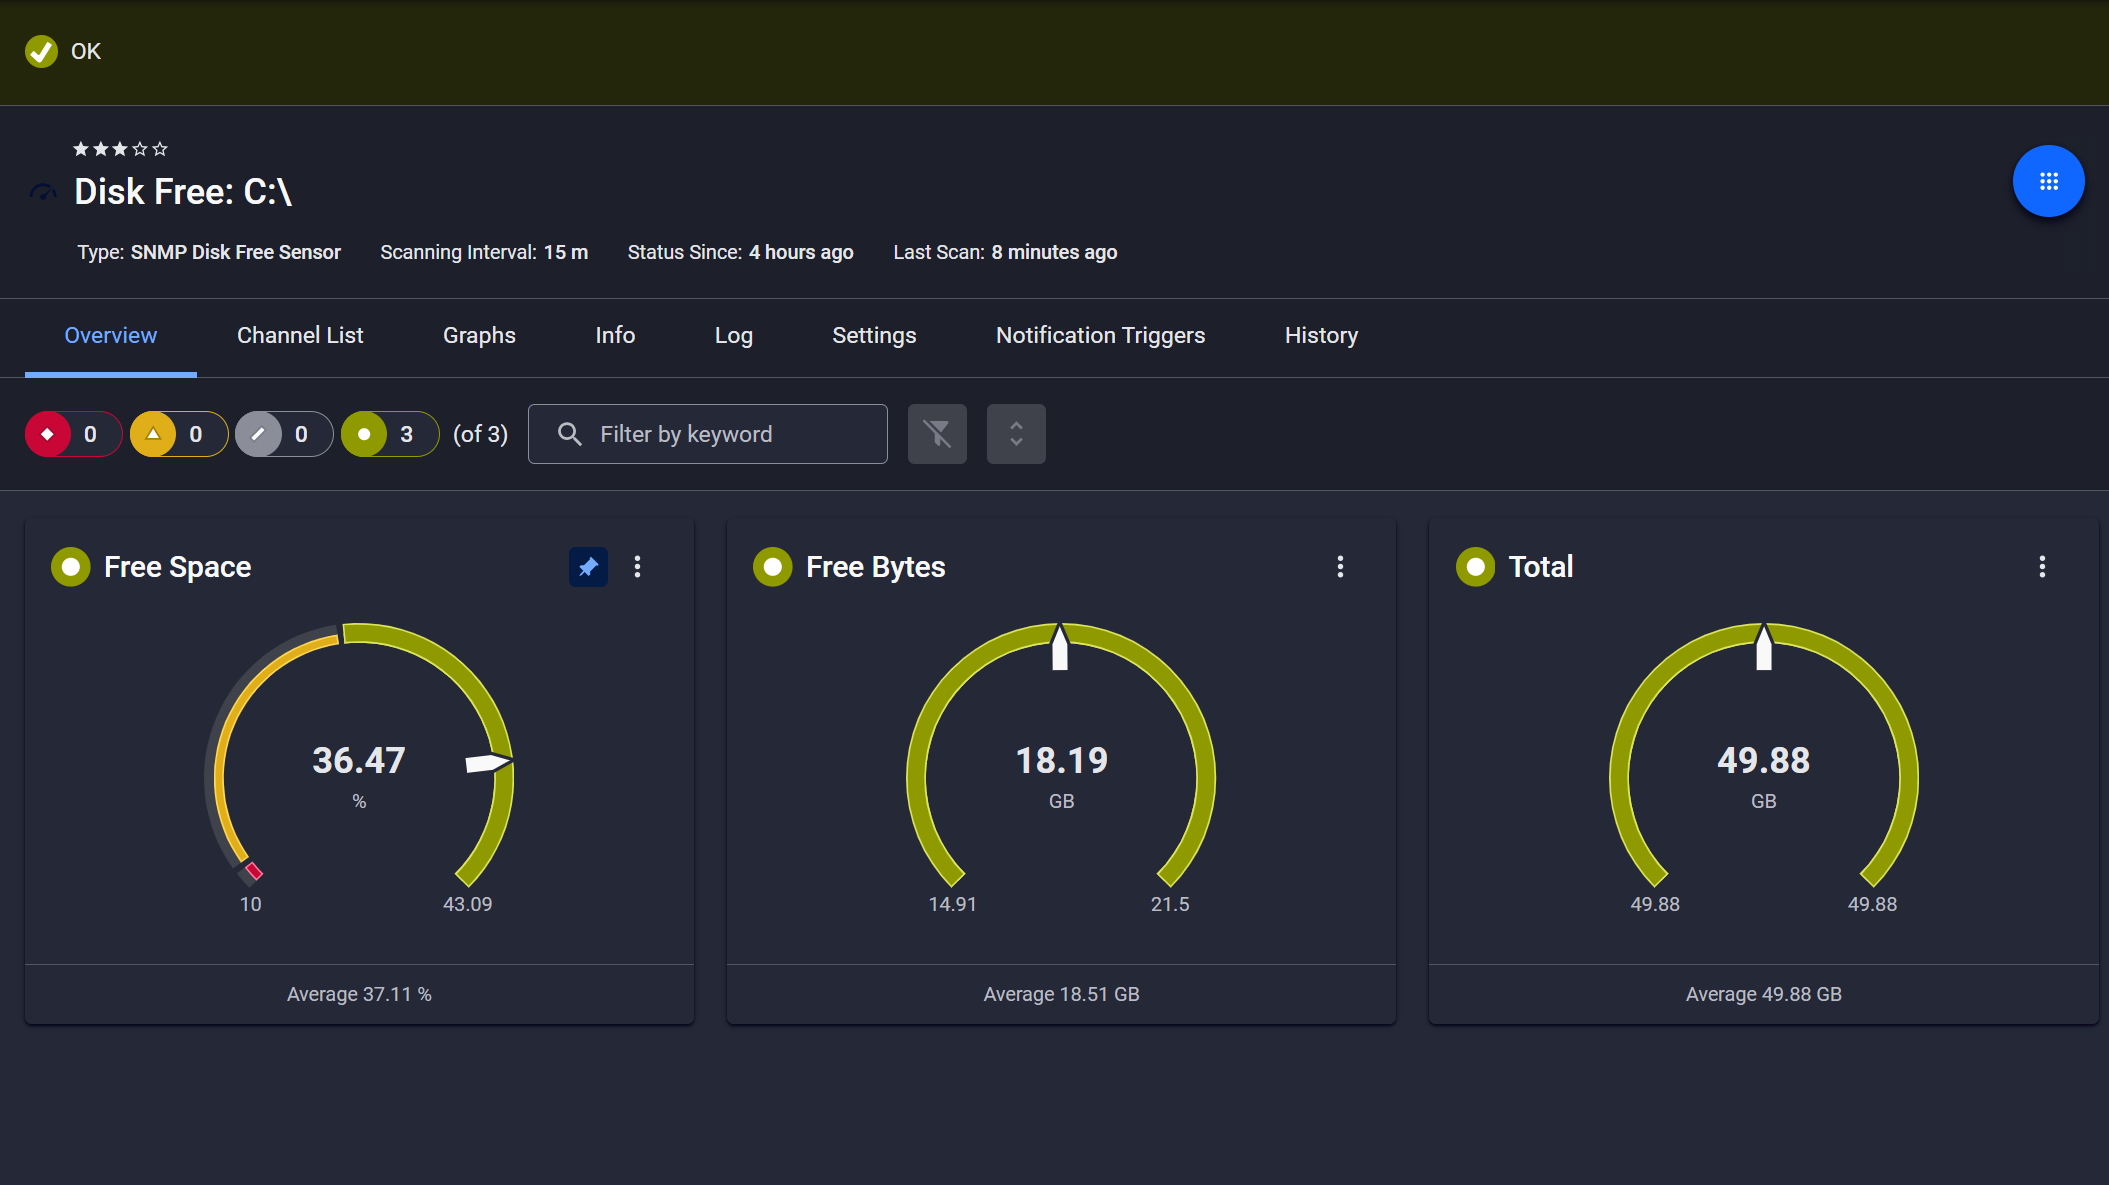
Disk space monitored, alerts ready
Fan issues are more actionable when you can see surrounding hardware signals at the same time. If voltages, temperature, and storage health also look unstable, you can prioritize the right fix faster.
PRTG supports broader health monitoring so fan operation and cooling signals sit in context with related hardware monitor data. That includes metrics like voltages and power consumption where your platform exposes them, plus storage checks such as S.M.A.R.T. health on supported Windows systems (via the WMI HDD Health sensor). It’s a practical way to support maintenance decisions and help extend hardware lifespan through proactive monitoring.
Different devices expose fan RPM, thermal status, and temperature readings in different ways. PRTG supports common infrastructure methods so you can monitor across vendors and environments.
FEATURE | Without PRTG Without PRTG | With PRTG With PRTG |
|---|---|---|
Fan status visibility | Without PRTG Log into each server’s iDRAC/iLO/iRMC individually | With PRTG Review devices and sensors in one dashboard |
Alert on fan failure | Without PRTG Often discovered during checks, or when a device reports a fault | With PRTG Notifications when monitored status/values cross thresholds (based on what the device exposes) |
Multi-site coverage | Without PRTG Manual checks per site or inconsistent coverage | With PRTG Remote probes collect locally and report centrally |
Historical trend data | Without PRTG May require vendor tools or separate logging | With PRTG Historical metrics stored for trends and comparison |
Multi-vendor support | Without PRTG Separate tools per vendor | With PRTG One monitoring tool across vendors (coverage depends on interface/model) |
Time to set up monitoring | Without PRTG Manual setup per device/interface | With PRTG Faster rollout with templates and auto-discovery where applicable |
Choose the PRTG Network Monitor subscription that's best for you.
| License Name | License description | Price | License Details | Get started | Pricing Details | |
|---|---|---|---|---|---|---|
| PRTG 500 | $200 | per month paid annually | Buy nowBuy now | Enough to monitor multiple aspects of 50 devices | ||
| PRTG 1000 | $358 | per month paid annually | Buy nowBuy now | Enough to monitor multiple aspects of 100 devices | ||
| PRTG 2500 | $742 | per month paid annually | Buy nowBuy now | Enough to monitor multiple aspects of 250 devices | ||
| PRTG 5000 | $1,300 | per month paid annually | Buy nowBuy now | Enough to monitor multiple aspects of 500 devices | ||
| PRTG 10000 | $1,642 | per month paid annually | Buy nowBuy now | Enough to monitor multiple aspects of 1000 devices |

PRTG can monitor fan health and fan operation metrics such as fan status and thermal status, and fan rpm or rotational speed where the device exposes it. Many environments also monitor related temperature readings through temperature sensors so fan performance stays in context.
You define thresholds for the fan and thermal metrics you care about, such as temperature monitoring values or fan speed ranges (where exposed). When a threshold is crossed, PRTG sends notifications so you can review the device and act. This is threshold-based alerting, not predictive analysis.
PRTG is commonly used for hardware monitoring across major vendors such as Dell, HPE, Lenovo, Fujitsu, NetApp, and Cisco UCS. Exact metrics depend on the model and what the vendor interface exposes via SNMP, IPMI, or Redfish.
PRTG can collect monitoring data locally at remote sites and show it centrally, so you don’t need to rely on manual checks at each location. This helps you keep the same fan monitoring and temperature monitoring coverage across sites while still using one monitoring tool.
Yes. In addition to server and device sensors, PRTG can monitor temperature sensors that expose readings via SNMP, including environmental devices or IoT devices with embedded sensors. This can help relate cooling systems and airflow conditions to what you see on the hardware.
No. PRTG is for fan monitoring, health monitoring, and alerting based on metrics and thresholds. It does not control fan speed or change fan settings.
Network Monitoring Software – Version 26.3.124.1727 (September 16, 2026)
Download for Windows and cloud-based version PRTG Hosted Monitor available
English, German, Spanish, French, Portuguese, Dutch, Russian, Japanese, and Simplified Chinese
Network devices, bandwidth, servers, applications, virtual environments, remote systems, IoT, and more
Choose the PRTG Network Monitor subscription that's best for you



