- English
- Deutsch
- Español
- Français
- Italiano
- Português
NetApp monitoring tracks system health, storage capacity, performance metrics, and I/O operations across your ONTAP environment. That includes aggregates, volumes, LUNs, nodes, and SnapMirror replication. PRTG collects this data via ONTAP REST API (9.6+) and SNMP, providing continuous storage monitoring into NetApp ONTAP storage systems alongside your broader IT infrastructure: servers, network, virtualization, and cloud. Configure ONTAP credentials at the device level and add the sensors you need: Paessler PRTG delivers detailed insights into disk space, throughput, IOPS, and system health without scripting or custom integrations.
The following technologies are supported: PRTG monitors NetApp ONTAP storage systems (including aggregates, volumes, LUNs, SnapMirror replication, and nodes) via ONTAP REST API (ONTAP 9.6+), ONTAPI (cDOT 8.3+), and SNMP.

Storage capacity planning works best when you have continuous trend data to work from. PRTG's NetApp Aggregate, Volume, and LUN sensors track free space and usage patterns across your ONTAP environment, alerting you at custom thresholds well before you hit critical levels. Historical trend data gives you what you need to make the case for storage expansion during regular budget cycles. Procurement stays planned, lead times stay manageable, and storage expansions happen on your schedule.
Continuous hardware monitoring gives your team the visibility to act on component issues while maintenance is still planned. The legacy NetApp System Health sensor (ONTAP 9.0–9.12) tracks fan status, PSU status, NVRAM battery, temperature, and spare disk availability. For ONTAP 9.6+, the System Health v2 sensor monitors node health status via REST API. A separate Physical Disk sensor tracks individual disk health independently. You have the data in front of you when it matters, well before any issue reaches production workloads.
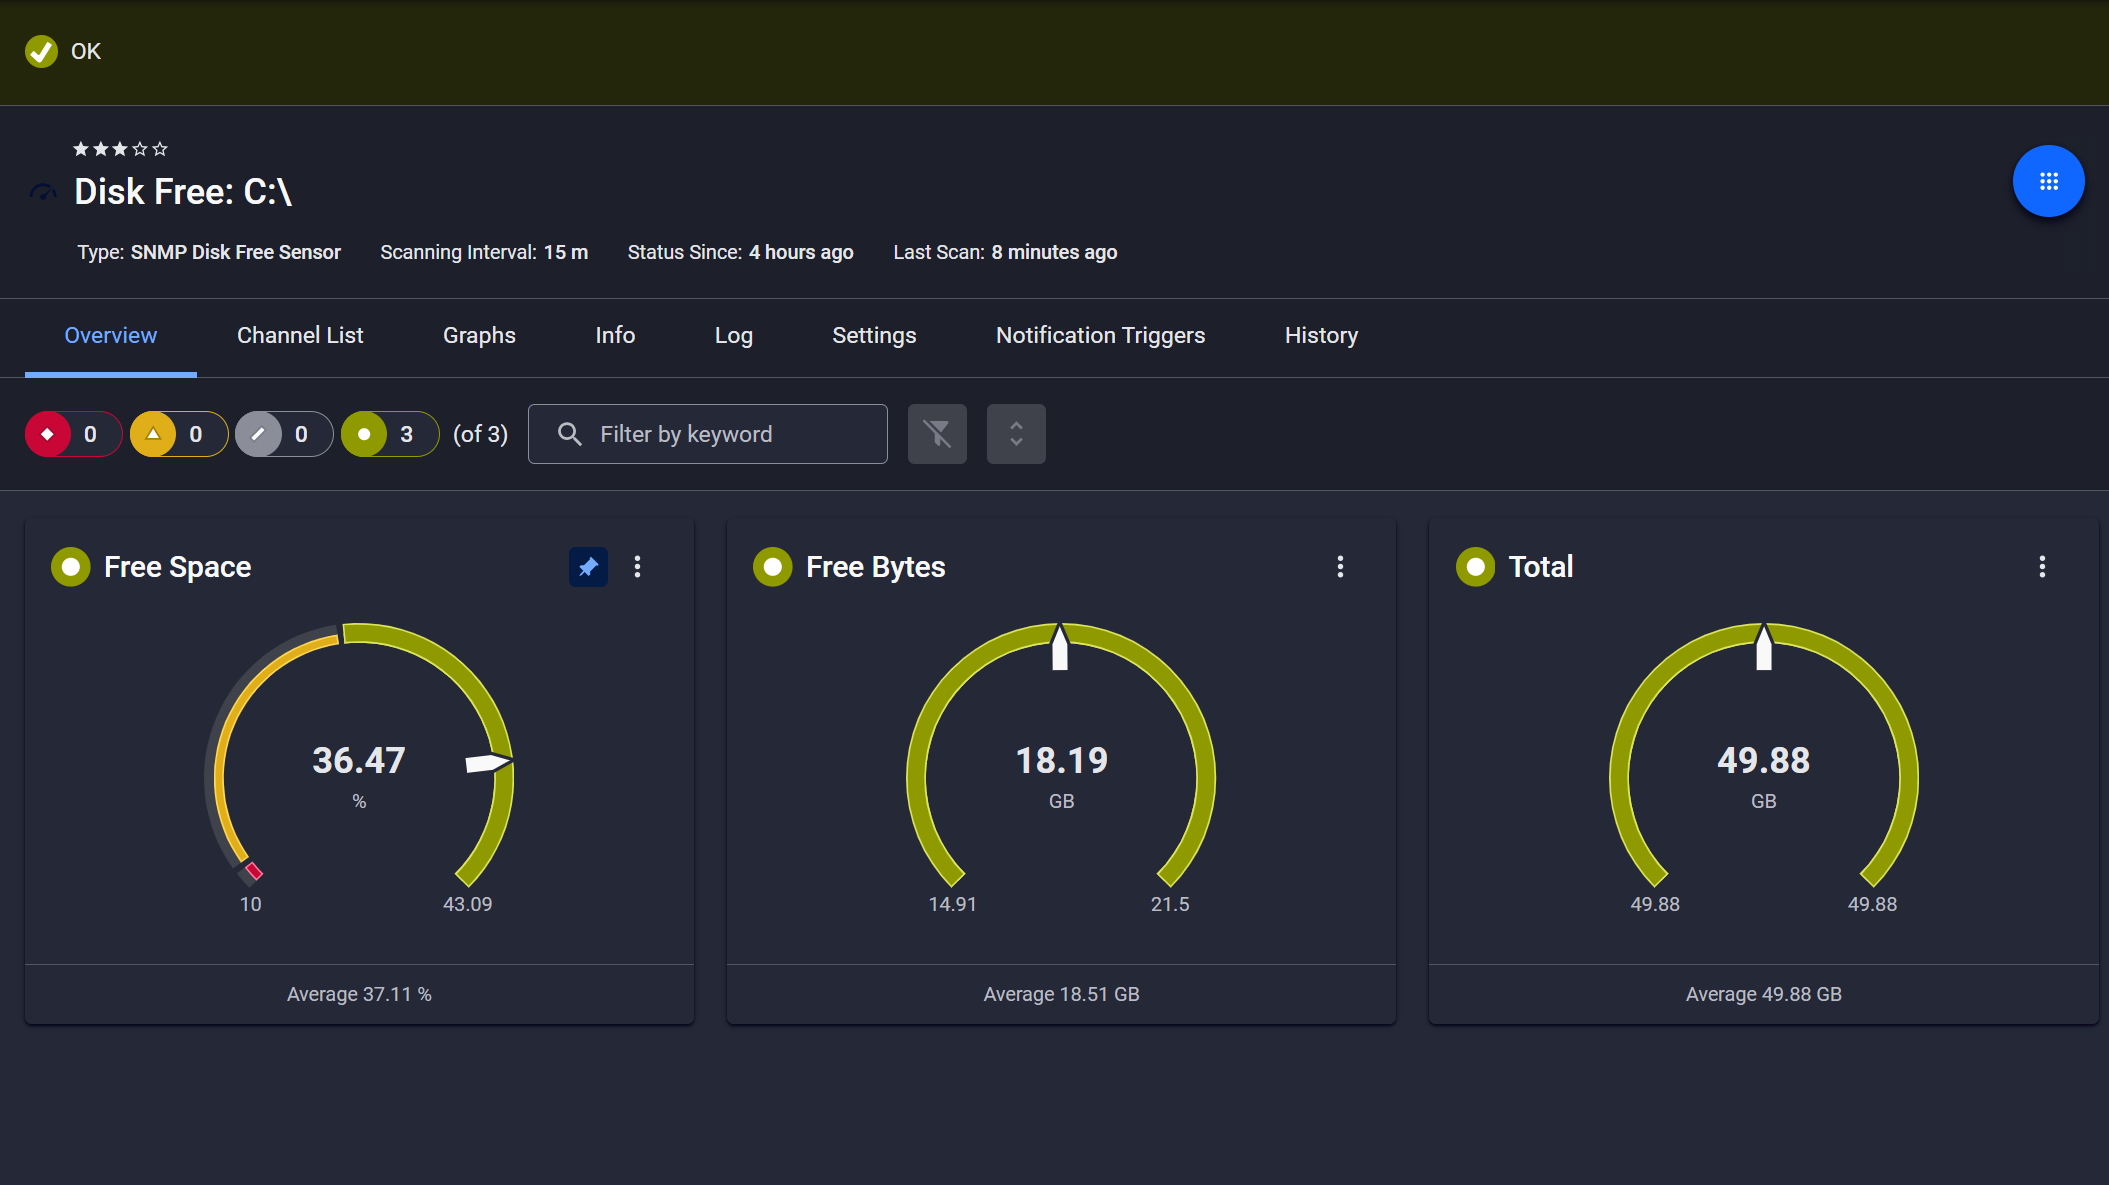
Disk space monitored, alerts ready
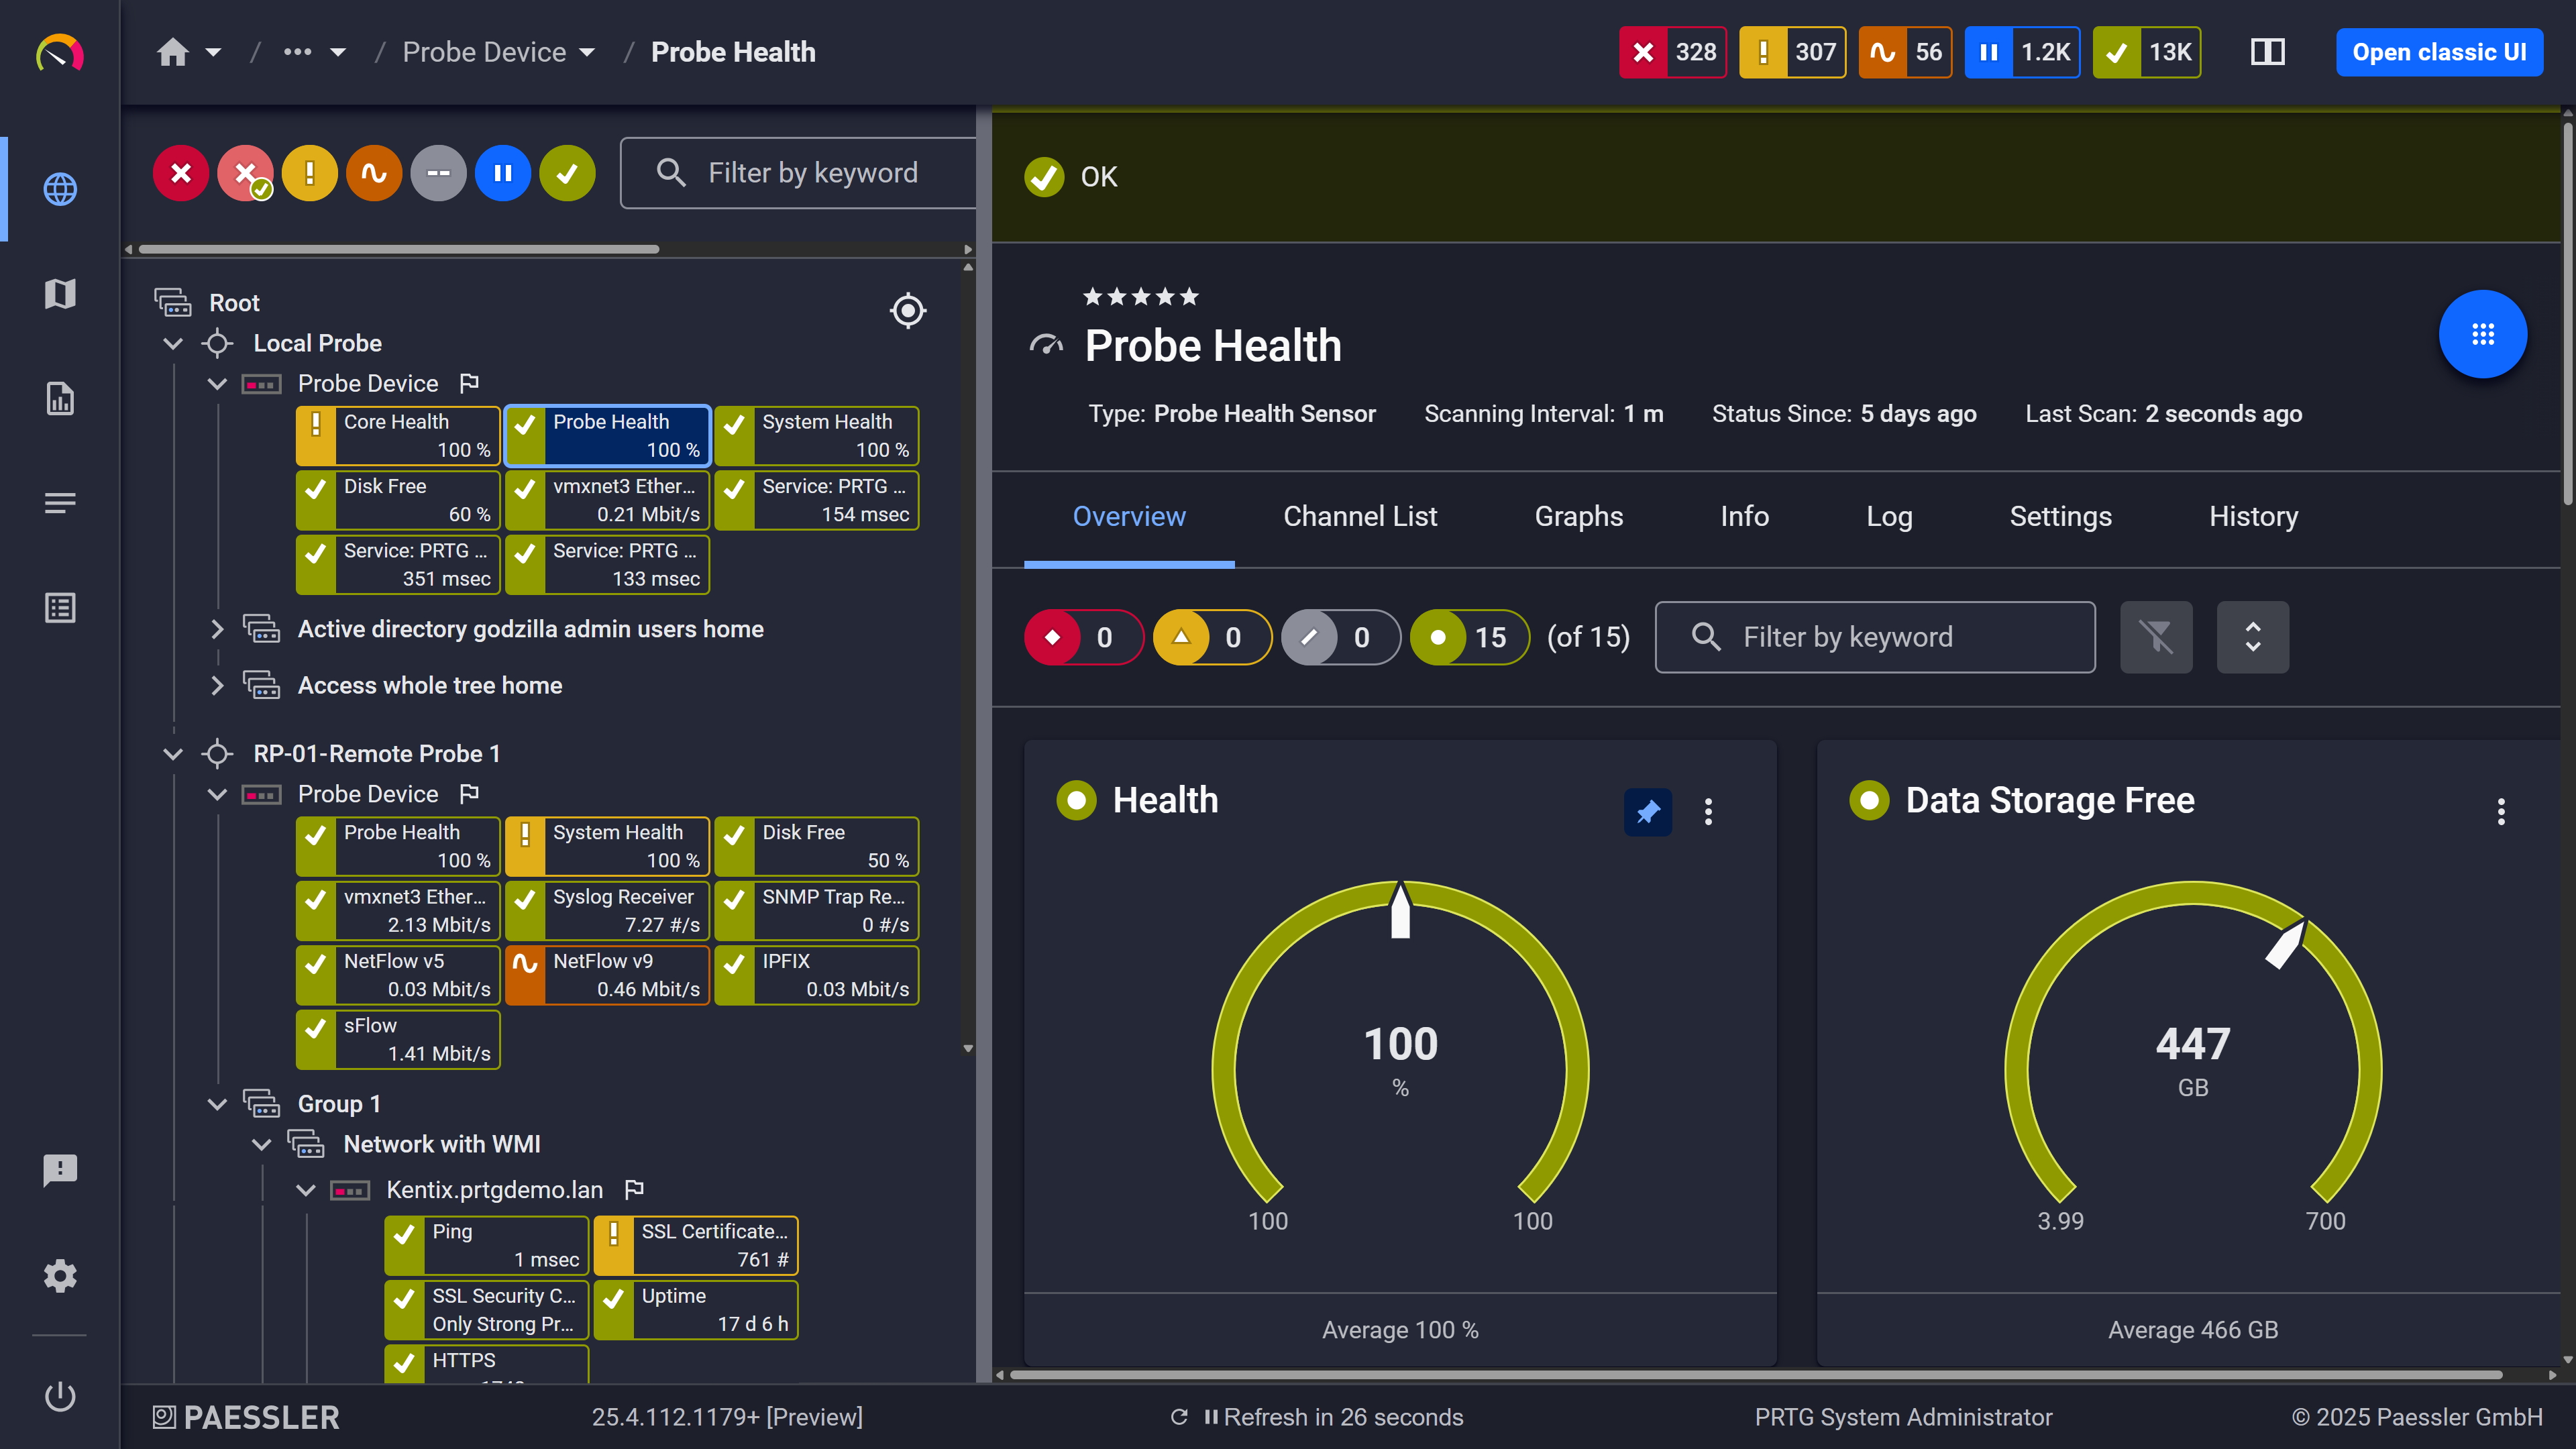
Probe health at a glance

Live graphs, real-time performance data
Application slowdowns and database lag often point to storage issues, but pinpointing whether the problem is NetApp I/O, network throughput, or workload spikes can take hours. PRTG's NetApp I/O sensor tracks read/write operations and throughput at the storage system level, while the NIC sensor monitors network interface performance. Both feed into the same dashboard alongside your server and network metrics. You get the detailed diagnostics and historical performance monitoring data you need to identify root causes faster, reducing finger-pointing between teams and accelerating resolution.
Start monitoring your infrastructure in minutes. No professional services, no complex configuration, no risk.
Most environments running NetApp are also running Dell EMC, HPE, VMware, or some mix of cloud services. Separate vendor tools for each means the data exists, it's just scattered. PRTG covers NetApp storage, SAN, NAS, network devices, servers, virtualization, and cloud environments from one platform, so correlating across layers is actually practical during an incident. Dashboards are customizable. Initial setup takes time to get right, that's just honest. But once it's done, infrastructure monitoring across storage, network, and compute happens in one place rather than three.

Full device list, instant overview

Scheduled reports, always on time
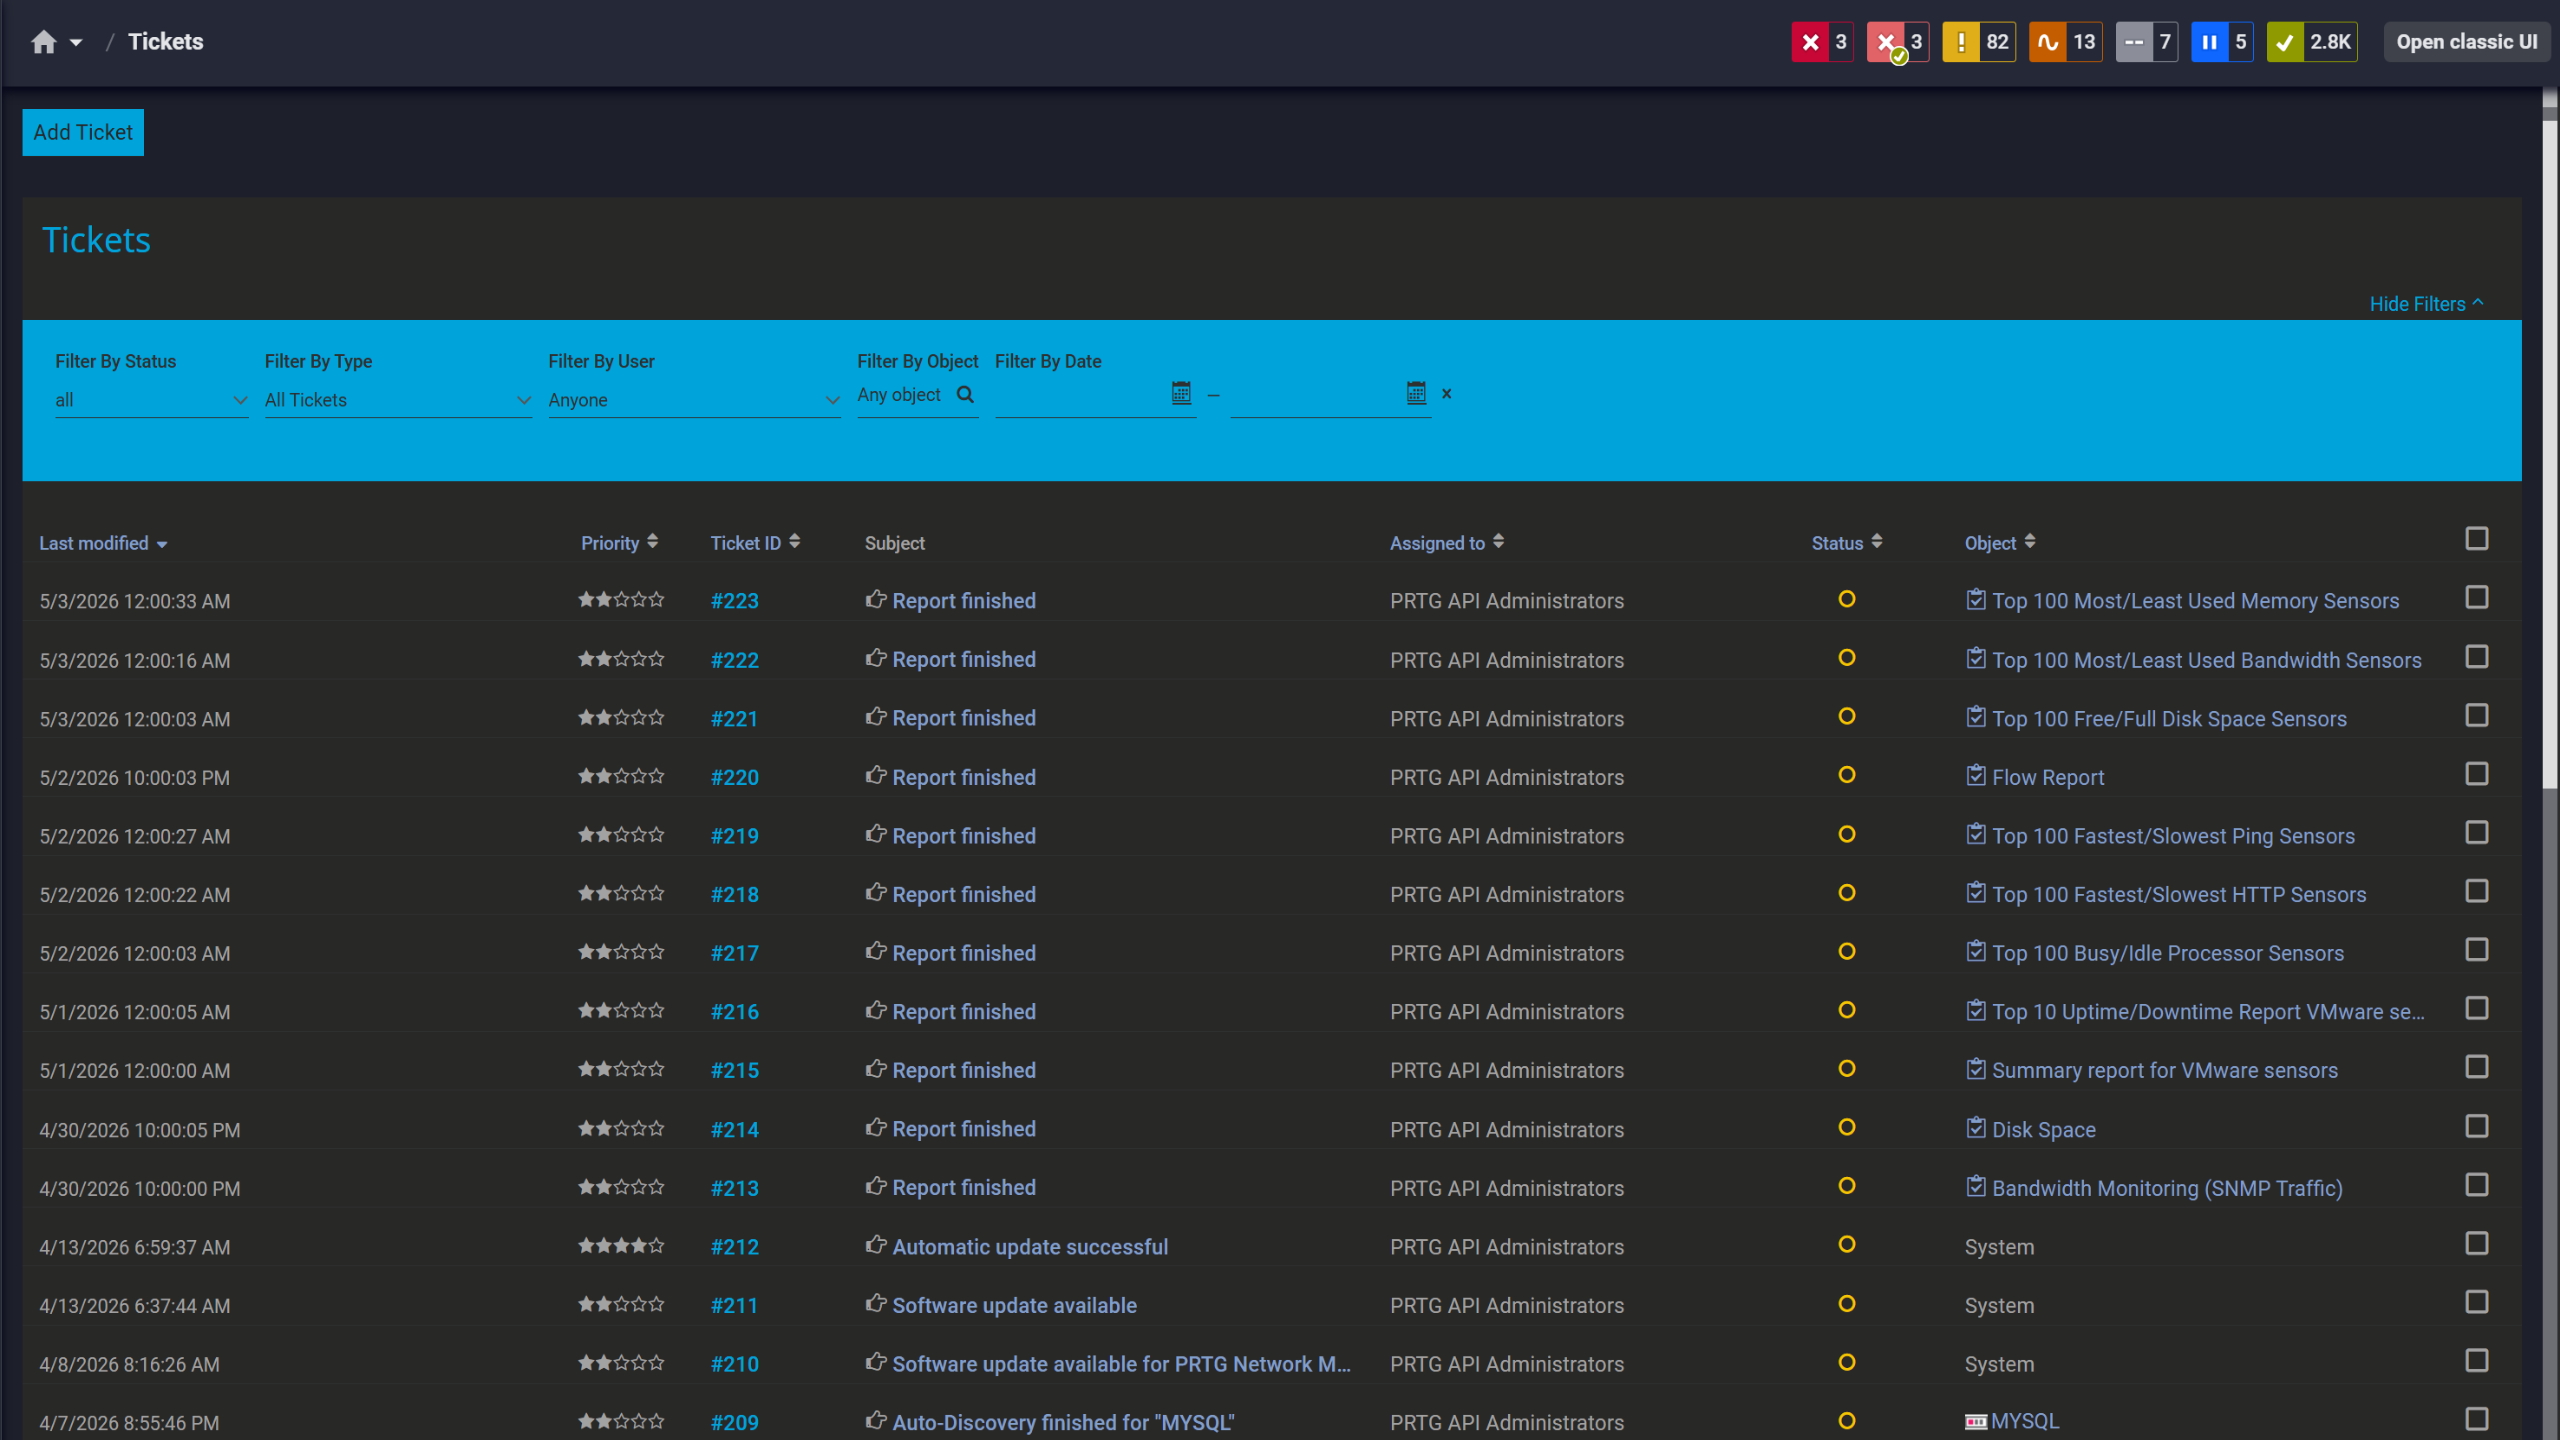
Tickets keep your team aligned
Small IT teams don't have time to become NetApp specialists or spend days configuring vendor-specific monitoring tools. You need visibility now, not after a week-long learning curve. Configure ONTAP credentials at the device level with a readonly account and add the NetApp sensors you need. No scripting, no deep NetApp expertise required. IT generalists can manage NetApp storage management and monitoring without specialized training.
PRTG uses native NetApp protocols and APIs to collect performance metrics, capacity data, and system health information from your ONTAP systems within your configured scanning intervals. Here's how PRTG connects to NetApp and what monitoring methods it uses.
FEATURE | Without PRTG Without PRTG | With PRTG With PRTG |
|---|---|---|
Multi-vendor visibility | Without PRTG Requires separate tools for NetApp, Dell EMC, VMware, Network | With PRTG One unified platform for all infrastructure |
Capacity threshold alerts | Without PRTG Manual checks or NetApp OnCommand setup | With PRTG Automated alerts at custom capacity levels you define |
Performance bottleneck correlation | Without PRTG Switch between NetApp, Network, Server tools | With PRTG Correlate NetApp, network, server metrics in one platform |
Deployment time | Without PRTG Days of configuration and learning curve | With PRTG Quick deployment once ONTAP credentials are configured |
Choose the PRTG Network Monitor subscription that's best for you.
| License Name | License description | Price | License Details | Get started | Pricing Details | |
|---|---|---|---|---|---|---|
| PRTG 500 | $200 | per month paid annually | Buy nowBuy now | Enough to monitor multiple aspects of 50 devices | ||
| PRTG 1000 | $358 | per month paid annually | Buy nowBuy now | Enough to monitor multiple aspects of 100 devices | ||
| PRTG 2500 | $742 | per month paid annually | Buy nowBuy now | Enough to monitor multiple aspects of 250 devices | ||
| PRTG 5000 | $1,300 | per month paid annually | Buy nowBuy now | Enough to monitor multiple aspects of 500 devices | ||
| PRTG 10000 | $1,642 | per month paid annually | Buy nowBuy now | Enough to monitor multiple aspects of 1000 devices |

Two sensor families. The v2 sensors use the REST API and need ONTAP 9.6 as a baseline, but the exact minimum shifts depending on which sensor you're deploying. I/O v2 needs 9.11, NIC v2 needs 9.10, Physical Disk v2 needs 9.9. Aggregate v2, Volume v2, System Health v2, and SnapMirror v2 all work from 9.6. If you're on an older system running cDOT 8.3 or ONTAP 9.0 through 9.12, the SOAP API-based sensors cover the same functional areas.
An ONTAP System Manager account with the readonly role, HTTP application access enabled, and Password authentication. No write access needed. You configure it once on the parent device and all NetApp v2 sensors on that device inherit the credentials automatically. That's genuinely it.
Yes, through remote probes. Put a probe at each site and it collects data locally, reports back to the central PRTG core server. Branch office, remote data center, cloud environment, doesn't matter much as long as the probe can reach the ONTAP API. No separate monitoring tool needed per site.
Yes. Dedicated SnapMirror sensors for both REST API (v2, ONTAP 9.6+) and SOAP API (cDOT 8.3 / ONTAP 9.0 to 9.12). They track replication health, lag time, last transfer duration, and last transfer size. Set thresholds on any of those channels and PRTG alerts when a relationship goes unhealthy or lag runs too high.
It tracks free space and usage across aggregates and volumes continuously and keeps that as historical data. You set threshold alerts to fire before a volume fills. The graphs give you actual usage trends over time, which is what you actually need when planning storage expansions rather than a snapshot of where things stand today.
Data Infrastructure Insights (formerly OnCommand Insight) is purpose-built for storage: deep analytics, capacity planning, chargeback reporting. PRTG isn't trying to compete with that. What PRTG does is put NetApp monitoring in the same platform as your servers, network, virtualization, and cloud services. If deep storage analytics is the priority, DII is the right tool. If you want cross-infrastructure observability without running separate tools per layer, that's where PRTG fits.
Performance, yes. I/O sensors cover throughput, I/O operations, and IOPS at LUN and system level. System health sensors track node and aggregate status. When something degrades or a health check fails, PRTG fires alerts based on your thresholds. The historical data is useful here too since it lets you trace when a problem started rather than just catching it in the moment.
Vulnerabilities, no. PRTG doesn't do CVE scanning or patch state tracking. Infrastructure health and performance monitoring is what it's built for.
Network Monitoring Software – Version 26.1.116.1532 (February 9th, 2026)
Download for Windows and cloud-based version PRTG Hosted Monitor available
English, German, Spanish, French, Portuguese, Dutch, Russian, Japanese, and Simplified Chinese
Network devices, bandwidth, servers, applications, virtual environments, remote systems, IoT, and more
Choose the PRTG Network Monitor subscription that's best for you


