- English
- Deutsch
- Español
- Français
- Italiano
- Português
PRTG monitors IBM System X servers via SNMP, providing near real-time tracking of critical hardware components including CPU temperature, fan speed, voltage levels, physical and logical disk status, and memory modules. PRTG’s pre-configured sensors reduce setup time while providing the performance monitoring capabilities needed to prevent outages and optimize resource utilization.
Note: The SNMP IBM System X System Health Sensor equires the IBM Systems Director Platform Agent on the target system. It can also run directly against an IMM network port.
Supported IBM Technologies:
PRTG monitors IBM System X servers with SNMP support, IBM Integrated Management Module (IMM), and can integrate with broader IBM infrastructure including Linux-based IBM servers and network bandwidth monitoring for IBM network components.

IBM server health changes gradually. CPU temperatures rise, fans lose RPM, voltages drift, and PRTG gives you continuous visibility into all of it before any single metric becomes a problem. The system health sensors track temperature, fan rotation, disk status, and component health across IBM System X hardware using SNMP. Set thresholds that match your operational tolerances and your team handles issues during scheduled maintenance windows, with the data and diagnostics already in front of them.
Few IBM environments run in isolation. Depending on your setup, you might be managing IBM servers alongside Cisco network gear, Microsoft endpoints, Dell or HP hardware, or cloud services. Each vendor comes with its own monitoring tool, and switching between them to chase a single performance issue burns time and creates gaps where problems hide. PRTG brings it into one platform: IBM hardware health, network bandwidth, Linux and Windows servers, cloud APIs. When an IBM server CPU bottleneck connects to network congestion or cloud workload spikes you catch it without switching contexts.

Full device list, instant overview
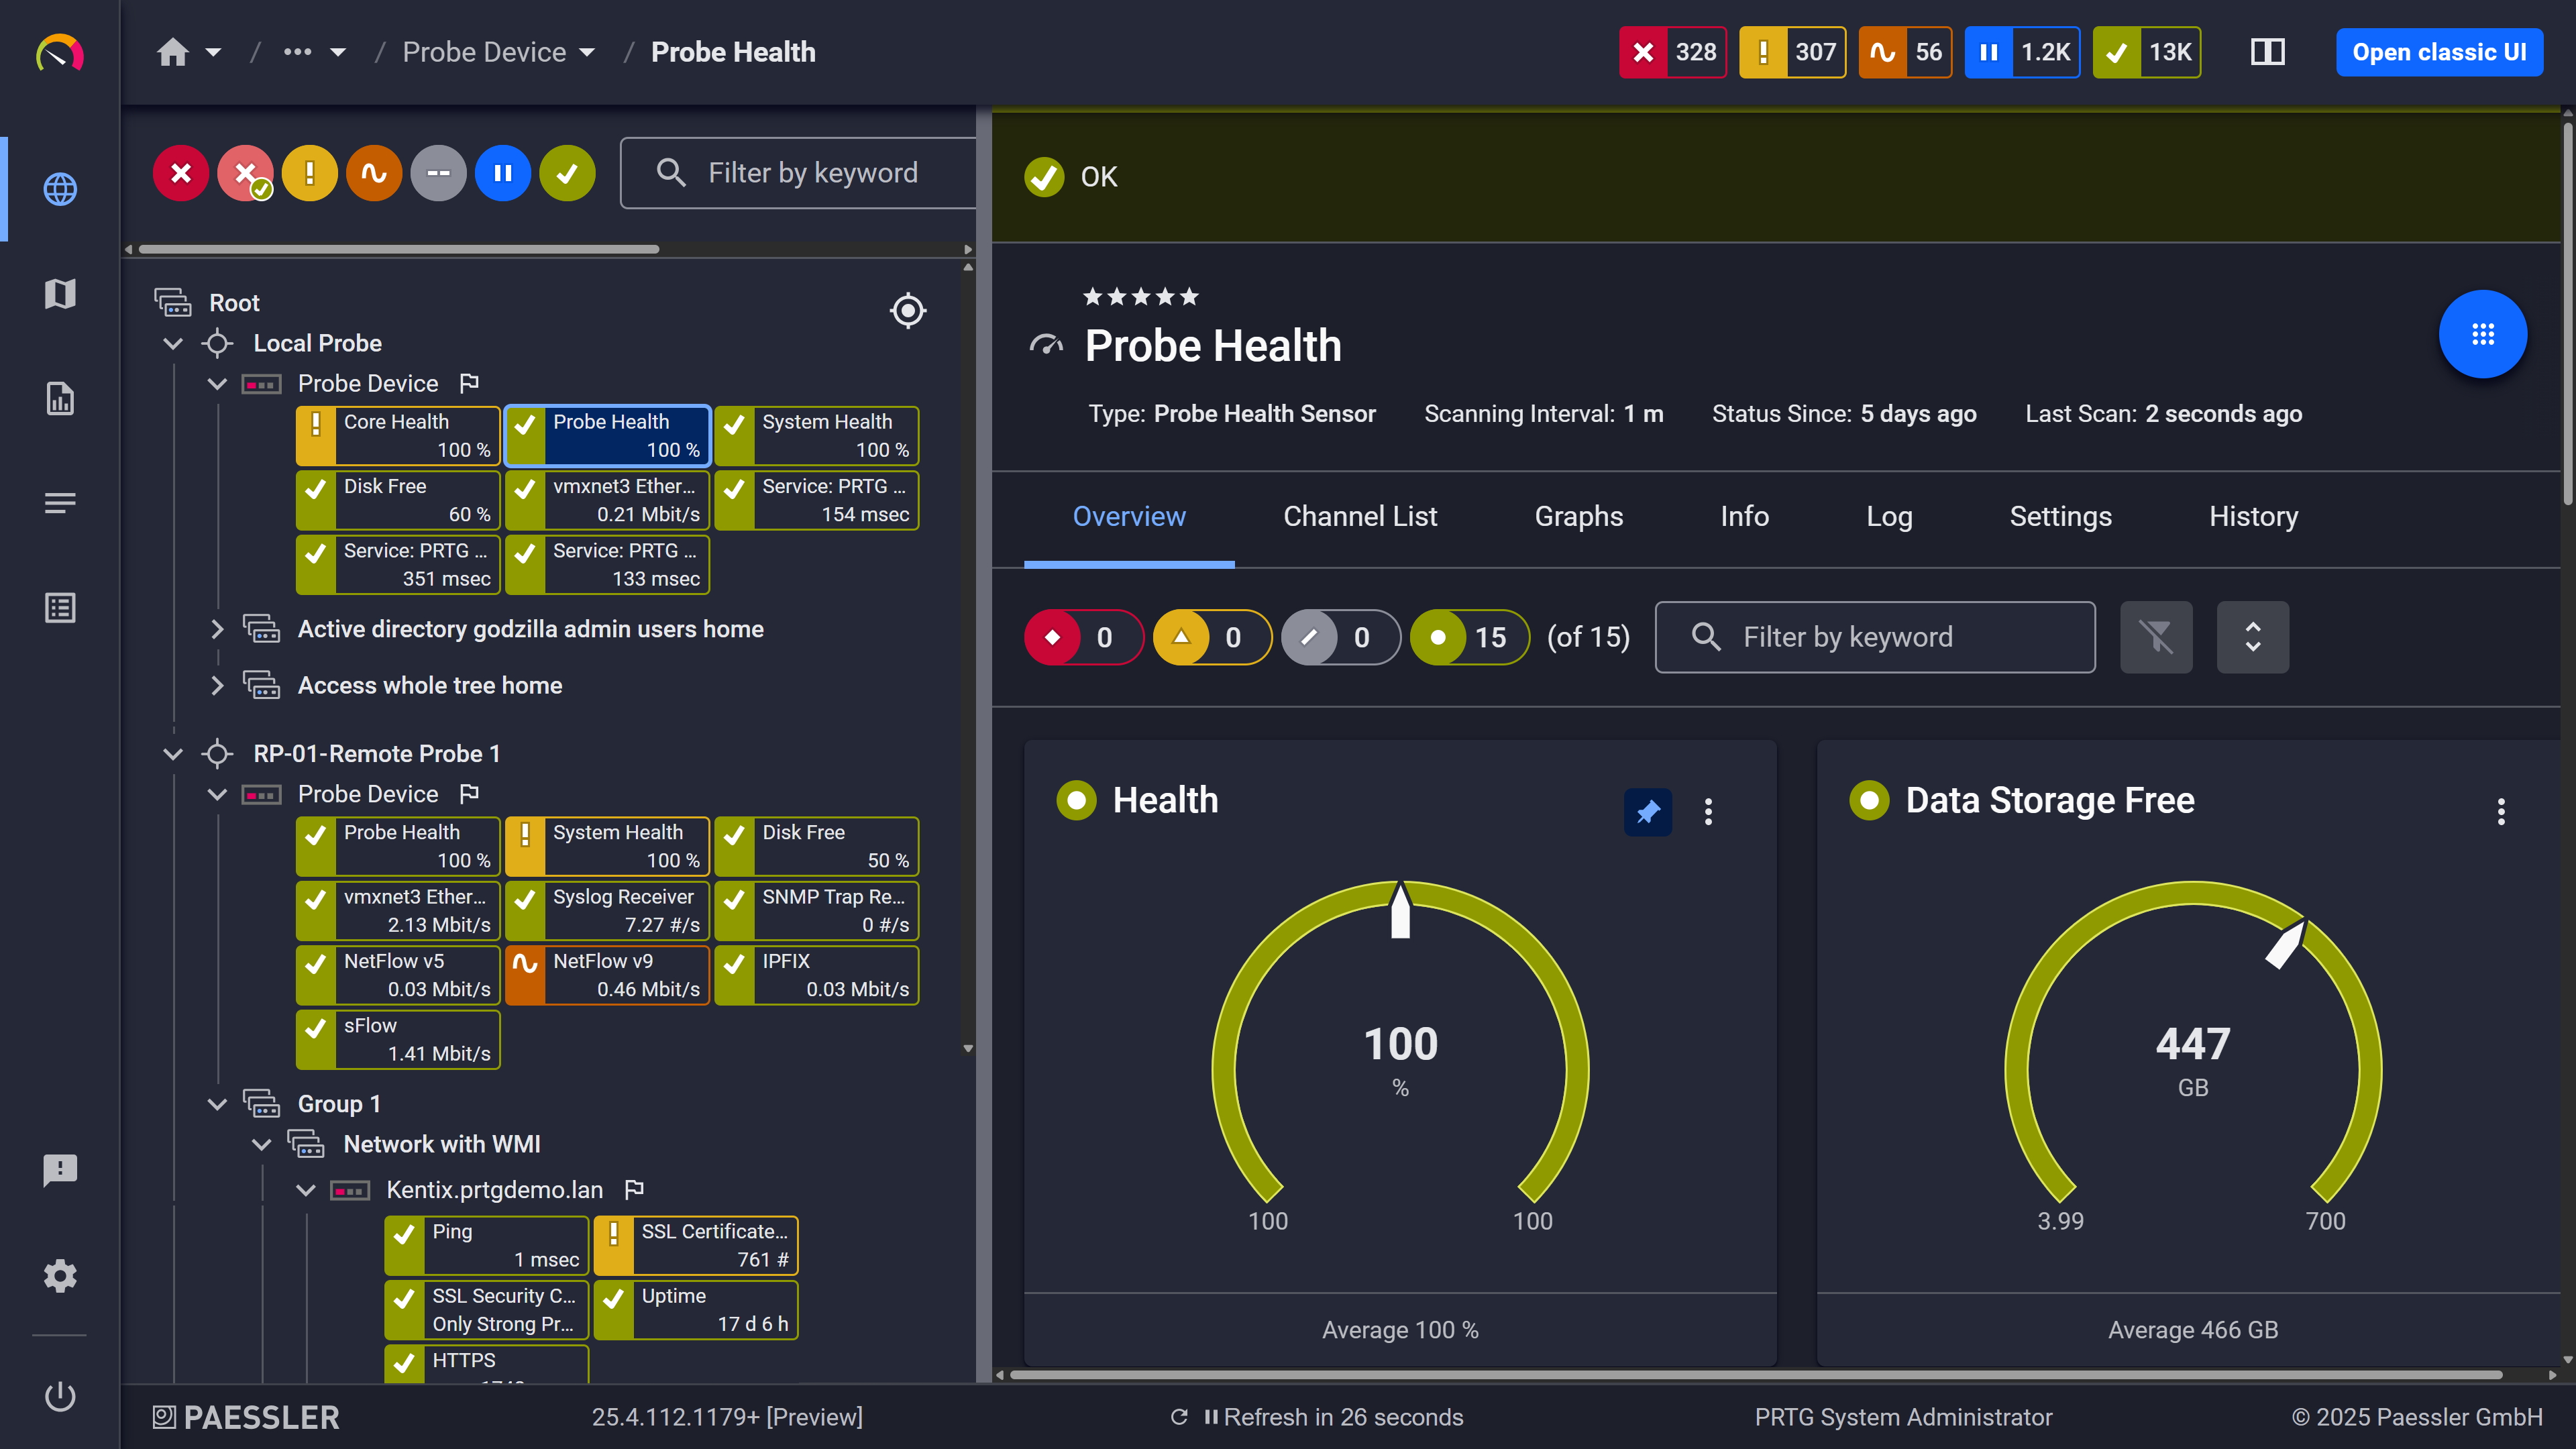
Probe health at a glance

Live graphs, real-time performance data
Setting up SNMP monitoring for IBM Integrated Management Module (IMM) shouldn’t require days of manual MIB file configuration and OID mapping. Lean IT teams don’t have time for complex setup, and decentralized sites need monitoring running now, not after waiting weeks for corporate IT support. PRTG includes pre-configured sensors for IBM System X hardware that eliminate manual configuration. Auto-discovery scans your network, identifies IBM servers, and suggests appropriate sensors. While SNMP must be enabled on your IBM servers, PRTG handles the sensor logic automatically, reducing deployment time from days to hours.
Start monitoring your infrastructure in minutes. No professional services, no complex configuration, no risk.
Aging IBM System X servers running mission-critical workloads don’t get replaced on a convenient schedule. Budget constraints, application dependencies, and internal approval cycles mean these systems stay in production longer than ideal. What you need is trend data that makes the case for replacement before a failure makes it for you. PRTG stores sensor data over time so you can track gradual degradation: rising average temperatures, increasing disk errors, memory issues getting more frequent. That gives you something concrete to bring to budget conversations instead of a gut feeling about aging hardware.
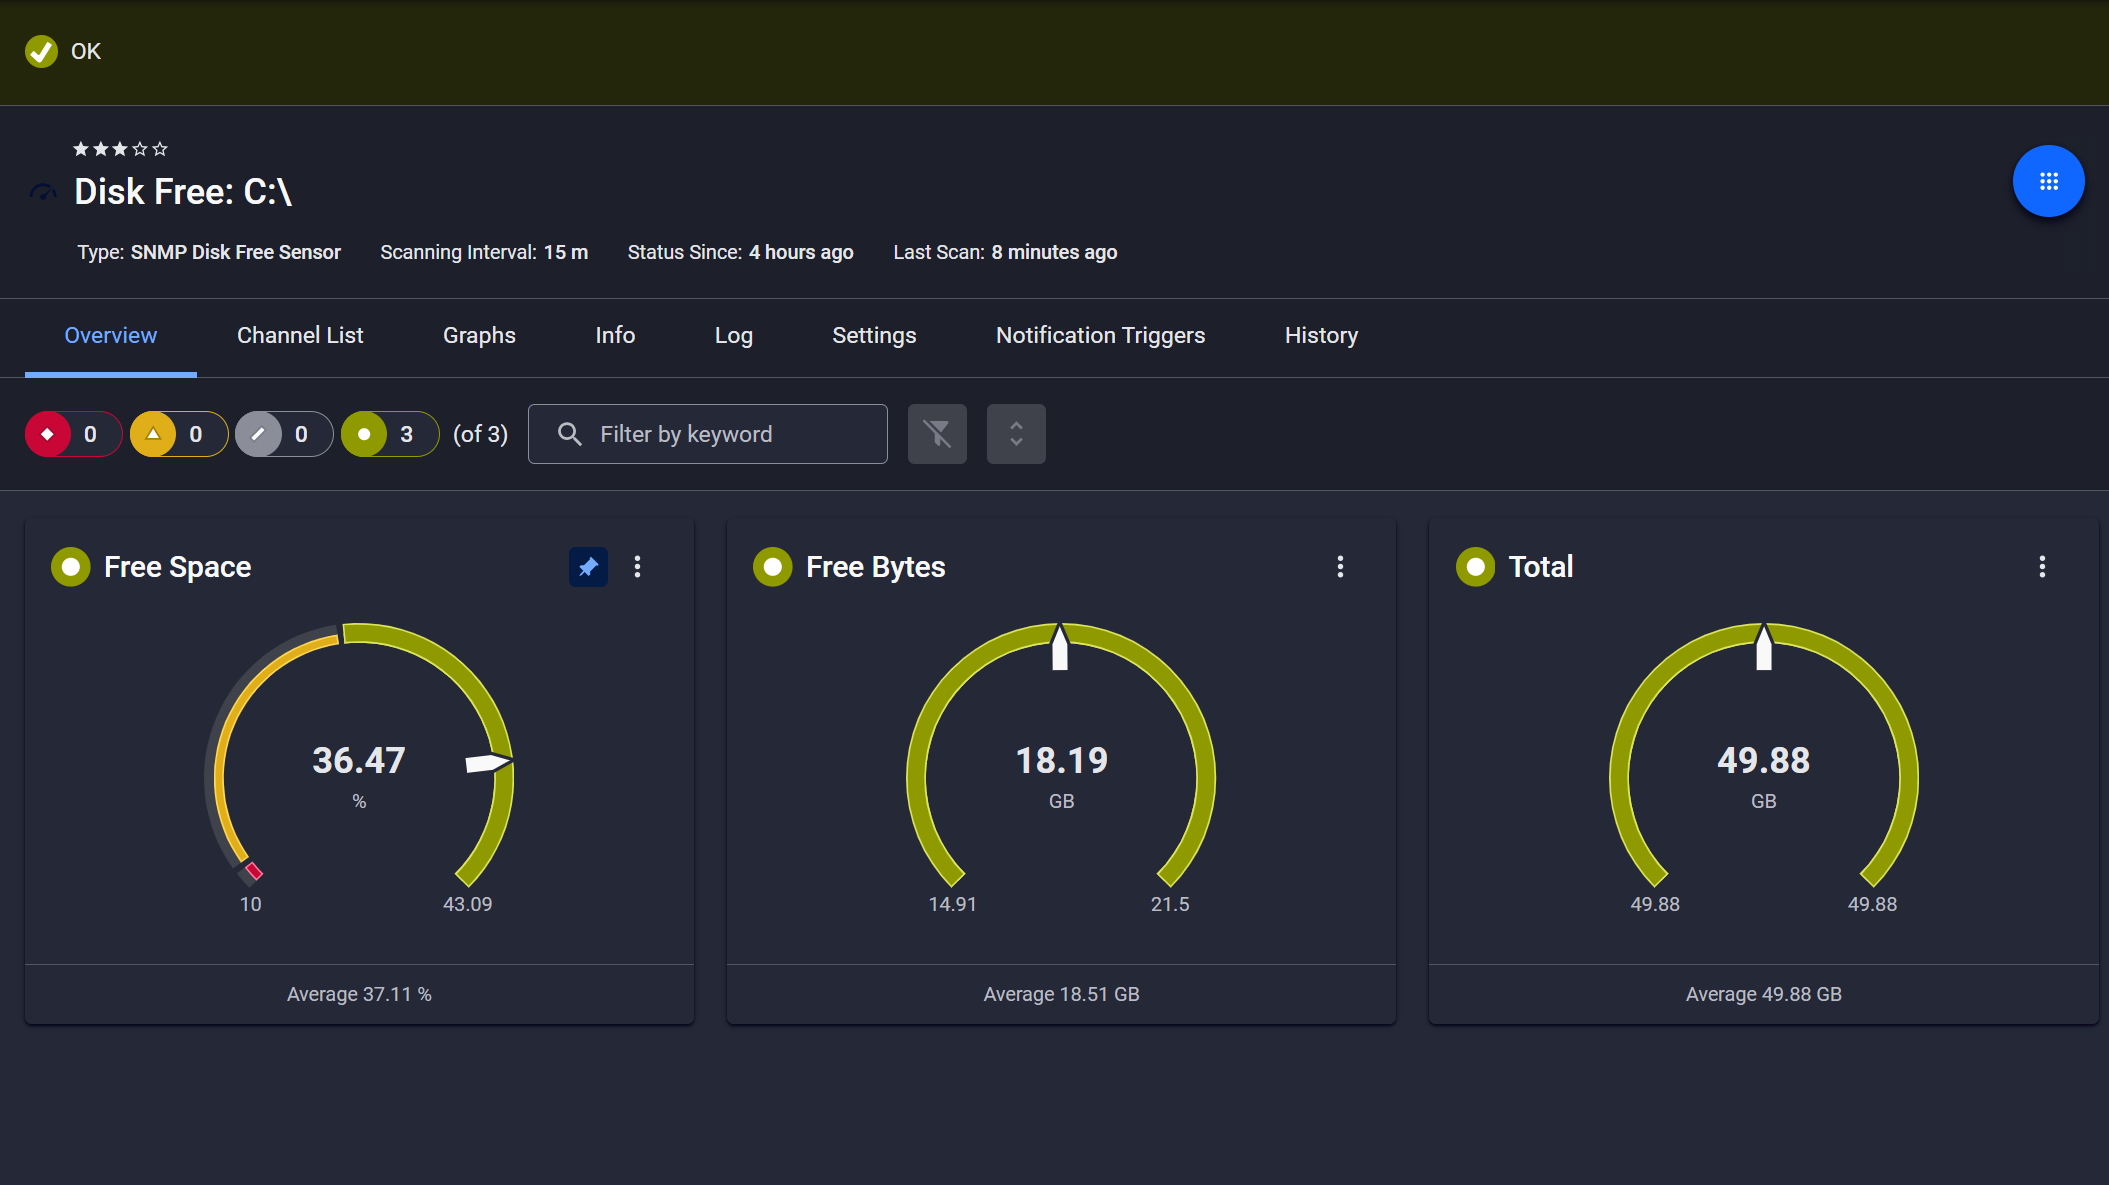
Disk space monitored, alerts ready

Scheduled reports, always on time
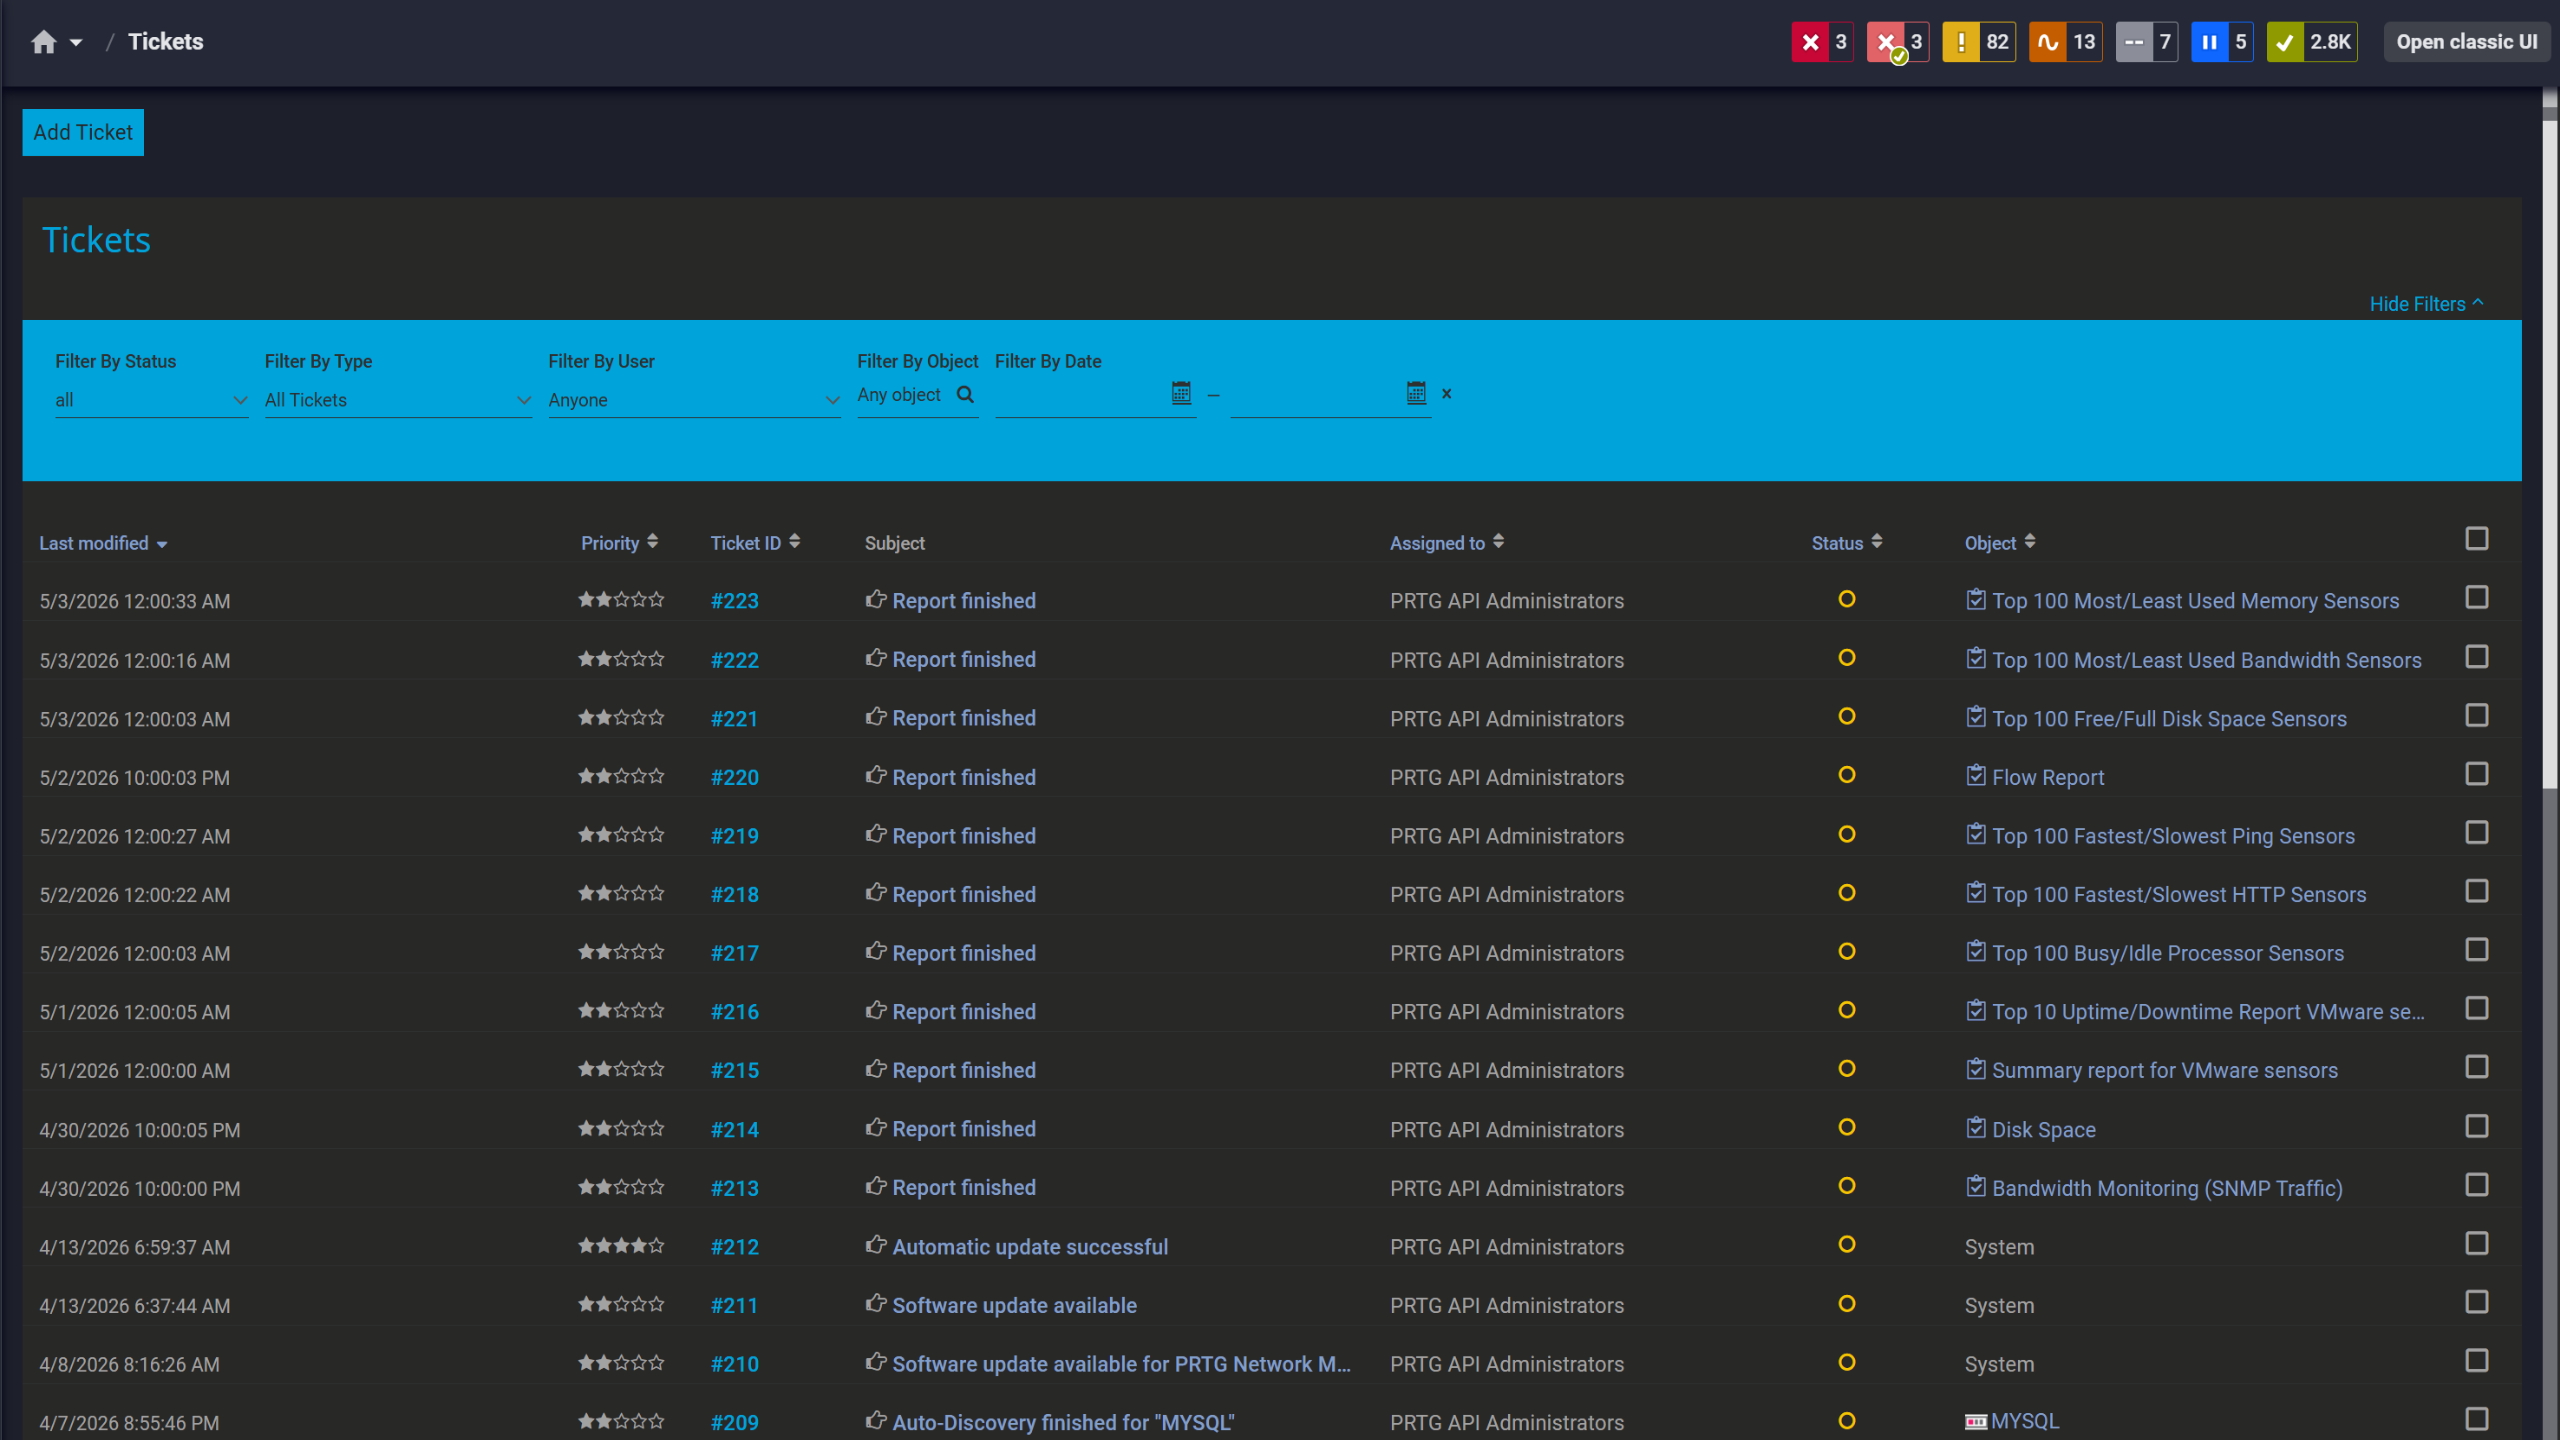
Tickets keep your team aligned
On-premises IBM servers don’t operate in isolation anymore. Most production environments mix physical hardware with cloud instances and SaaS applications, and siloed monitoring tools leave gaps exactly where performance issues tend to hide. PRTG connects traditional server monitoring with cloud observability through API integration. REST sensors can pull metrics from AWS, Azure, or any cloud provider API directly into PRTG (with additional configuration) then you combine that data with on-premises IBM server health in unified dashboards. No custom middleware required. Response times, bandwidth between sites, VM performance: one view covers it.
PRTG uses industry-standard protocols and pre-configured sensors to monitor IBM System X servers and related infrastructure. Here’s what that looks like in practice and what data you actually get out of it.
FEATURE | Manual Approach Manual Approach | With PRTG With PRTG |
|---|---|---|
Checking IBM server temperature | Manual Approach Log into each IMM web interface individually, check temperature readings, record in spreadsheet | With PRTG Automated SNMP polling, dashboard visualization, alerts when conditions are met |
Disk health verification | Manual Approach Run diagnostics on each server, review controller logs, compile status reports | With PRTG Physical and Logical Disk sensors poll disk status and trigger alerts on failures |
Tracking hardware trends over time | Manual Approach Manually export and archive logs from multiple sources for later analysis | With PRTG Built-in historical data storage with graphing and export capabilities for trend analysis |
Getting notified of hardware issues | Manual Approach Manually check logs or wait for users to report problems | With PRTG Alerts configured once, automatic notifications via email, SMS, push, or integrations |
Multi-site infrastructure visibility | Manual Approach Maintain separate monitoring setup for each location or poll everything across WAN | With PRTG Remote probes at each site relay data to central installation, unified visibility across locations |
Choose the PRTG Network Monitor subscription that's best for you.
| License Name | License description | Price | License Details | Get started | Pricing Details | |
|---|---|---|---|---|---|---|
| PRTG 500 | $200 | per month paid annually | Buy nowBuy now | Enough to monitor multiple aspects of 50 devices | ||
| PRTG 1000 | $358 | per month paid annually | Buy nowBuy now | Enough to monitor multiple aspects of 100 devices | ||
| PRTG 2500 | $742 | per month paid annually | Buy nowBuy now | Enough to monitor multiple aspects of 250 devices | ||
| PRTG 5000 | $1,300 | per month paid annually | Buy nowBuy now | Enough to monitor multiple aspects of 500 devices | ||
| PRTG 10000 | $1,642 | per month paid annually | Buy nowBuy now | Enough to monitor multiple aspects of 1000 devices |

IBM System X servers with SNMP enabled on the IMM. That covers v1, v2c, and v3. If a sensor isn’t connecting, check the IMM first: wrong community string or a firewall blocking UDP 161 account for most of it.
For the SNMP IBM System X System Health sensor, yes: the IBM Systems Director Platform Agent needs to be on the target server. Alternatively it runs directly against an IMM network port, which is useful if installing software on the server isn’t an option. Disk sensors are agentless and go through SNMP directly. Either way SNMP has to be enabled on the IMM with the right credentials before any of this works.
Usually fine. Firmware updates don’t break monitoring as long as SNMP stays enabled and the credentials don’t get reset. The part that does cause issues is when a firmware update silently resets community strings back to defaults, because PRTG doesn’t know that happened until sensors stop responding. When they do, you get alerted. Update the device settings in PRTG and you’re back.
CPU temperature and usage, ambient temperature, fan RPM, CMOS battery voltage, system board voltages, physical and logical disk status, memory module health. Network interfaces, bandwidth, and response times for services running on the server too. All of it supports configurable thresholds and historical retention, though retention periods depend on your PRTG configuration.
Remote probes. Install one at each site, it monitors local IBM servers and relays data back to the central core server. Same sensors, same capabilities as the core. The monitoring traffic stays local which matters if your WAN links are constrained. Everything still shows up in one place centrally.
There’s no native IBM Cloud integration. What PRTG does have is the REST Custom sensor and support for custom PowerShell and Python scripts, which between them cover most API-based data sources. It takes some setup but it gets IBM Cloud metrics into the same dashboards as your on-premises hardware data. Not plug-and-play, but workable.
SNMP enabled on the IMM, community string or v3 credentials ready, IBM Systems Director Platform Agent installed if you’re using the SNMP IBM System X System Health Sensor, network access from the PRTG probe to the server’s management IP, and UDP port 161 open through any firewalls in between. Get those five right and PRTG’s auto-discovery handles the rest with the Server (IBM) device template.
Network Monitoring Software – Version 26.1.116.1532 (February 9th, 2026)
Download for Windows and cloud-based version PRTG Hosted Monitor available
English, German, Spanish, French, Portuguese, Dutch, Russian, Japanese, and Simplified Chinese
Network devices, bandwidth, servers, applications, virtual environments, remote systems, IoT, and more
Choose the PRTG Network Monitor subscription that's best for you


