• Company
    • About Us
    • Case Studies
    • Press Center
    • Careers
    • Blog
    • Contact us
  • Contact us
  • Login
 
  • English
    • Deutsch
    • Español
    • Français
    • Italiano
    • Português
Paessler
                    - The Monitoring Experts
  • Products
    • Paessler PRTG
      Paessler PRTGMonitor your whole IT infrastructure
      • PRTG Network Monitor
      • PRTG Enterprise Monitor
      • PRTG Hosted Monitor
      • PRTG UVexplorer
      • PRTG extensionsExtensions for Paessler PRTGExtend your monitoring to a new level
    • Icon Features
      FeaturesExplore all monitoring features
      • Maps & dashboards
      • Alerts & notifications
      • Multiple user interfaces
      • Distributed monitoring
      • Customizable reporting
  • Solutions
    • Industries
      IndustriesMonitor various industry sectors
      • Industrial
      • Healthcare
      • Data Center
      • Education
      • Finance
      • Government
    • IT Topics
      IT TopicsMonitor all areas of IT
      • Network Monitoring
      • Bandwidth Monitoring
      • SNMP Monitor
      • Network Mapping
      • WiFi Monitoring
      • Server Monitoring
  • Pricing
  • Resources
    • Getting Started
      Getting StartedModules for self-paced learning
    • How-to Guides
      How-to GuidesGet the most out of PRTG
    • Videos & Webinars
      Videos & WebinarsLearn from Paessler experts
    • IT  Knowledge
      IT KnowledgeExpand your IT knowledge
    • PRTG Manual
      PRTG ManualFull documentation
    • Knowledge Base
      Knowledge BaseShare community knowledge
    • PRTG Sensor Hub
      PRTG Sensor HubGet sensors, scripts & templates
    • Trainings
      PRTG TrainingLearn how to work with PRTG
  • Partners
    • Icon Handshake
      Become a PartnerFor resellers and channel partners
    • Icon MSP
      Become an MSPDeliver monitoring as a managed service
    • icon partner
      Partner PortalLog in to your partner account
    • Deal Registration
      Deal RegistrationRegister your sales opportunities
    • icon search
      Find a PartnerFind partners selling Paessler products
    • icon technology
      Technology AlliancesSee Paessler technology partnerships
    • Partner HubTools for Your Success
  • Company
    • About Us
    • Case Studies
    • Press Center
    • Careers
    • Blog
    • Contact us
  • Contact us
  • Login
  • English
    • Deutsch
    • Español
    • Français
    • Italiano
    • Português
  • Get a quote
  • Free trial

Powerful SNMP Scanner

Discover SNMP-enabled network devices in your IP ranges and keep them under watch with scheduled polling and alerts.

Free download
PRODUCT OVERVIEW

What does an SNMP scanner actually do, and how does continuous monitoring fit in?

SNMP scanning shows which devices in your IP networks support the Simple Network Management Protocol and what data their SNMP agents expose, assuming the device answers SNMP and the credentials are right. Scanning is a point-in-time device list. Network monitoring is the part that keeps polling, alerting, and dashboards running so you can track health and performance over time.  

PRTG combines both. You run an SNMP scanner across your network devices, then add SNMP monitoring based on templates and your settings. For common scenarios, you can get useful monitoring running without writing scripts. When you need extra metrics or odd edge cases, you extend coverage with custom sensors and other methods, for example by polling specific OIDs (object identifiers) and using a MIB to make values easier to read.  

PRTG can monitor many SNMP-enabled devices such as routers, switches, firewalls, servers (Windows and Linux), printers, UPSs, and similar gear. Coverage depends on what the device’s SNMP agent exposes. SNMP v1, SNMP v2c, and SNMP v3 are supported per device, and SNMP communication runs over UDP in standard IP networks. 

Download PRTG Trial

What you will find on this page

  • Full SNMP Coverage
  • How PRTG Monitors SNMP
  • SNMP Scanning with & without PRTG
  • FAQs

PRTG is compatible with all major vendors, products, and systems

compatible with all major vendors, products, and systems

Full SNMP Coverage, From Discovery to Ongoing Monitoring

Know what your SNMP devices are doing

Continuous polling is what turns a device list into actual monitoring. PRTG keeps querying your managed devices on a schedule, compares returned values to the thresholds you set, and sends notifications when something moves out of range. Historical data is stored for every sensor, so when something needs investigation, you have a timeline to work from, not just the current state. 

  • Alerts when a device goes unreachable (depends on polling interval and notifications)
  • Thresholds per metric, not one global setting
  • Uptime and performance history for reporting and investigations
  • Dashboards for faster triage when something is noisy
  • Notifications via email and other methods, including push and SMS via a gateway/service

A current inventory of your SNMP devices

Keeping your monitoring environment current starts with knowing what's on the network. PRTG's auto-discovery runs SNMP scanning across the IP ranges you define, identifies devices that respond, and builds a structured device tree. Based on templates and your settings, it can also suggest or create sensors so you start with a baseline instead of a blank page.  

Discovery and polling run from the probe. For remote networks behind firewalls/NAT, or where routing is restricted, place a Remote Probe in that network. It avoids WAN dependency and usually makes access simpler. After the initial discovery, you can re-scan on demand or add devices manually. 
  • Scan defined IP ranges for SNMP responders
  • Device tree built from discovery and maintained in PRTG after discovery
  • Capture hostname (where DNS is available), device type, and IP address
  • Re-scan to catch changes and new devices
  • Manual additions when discovery is not enough
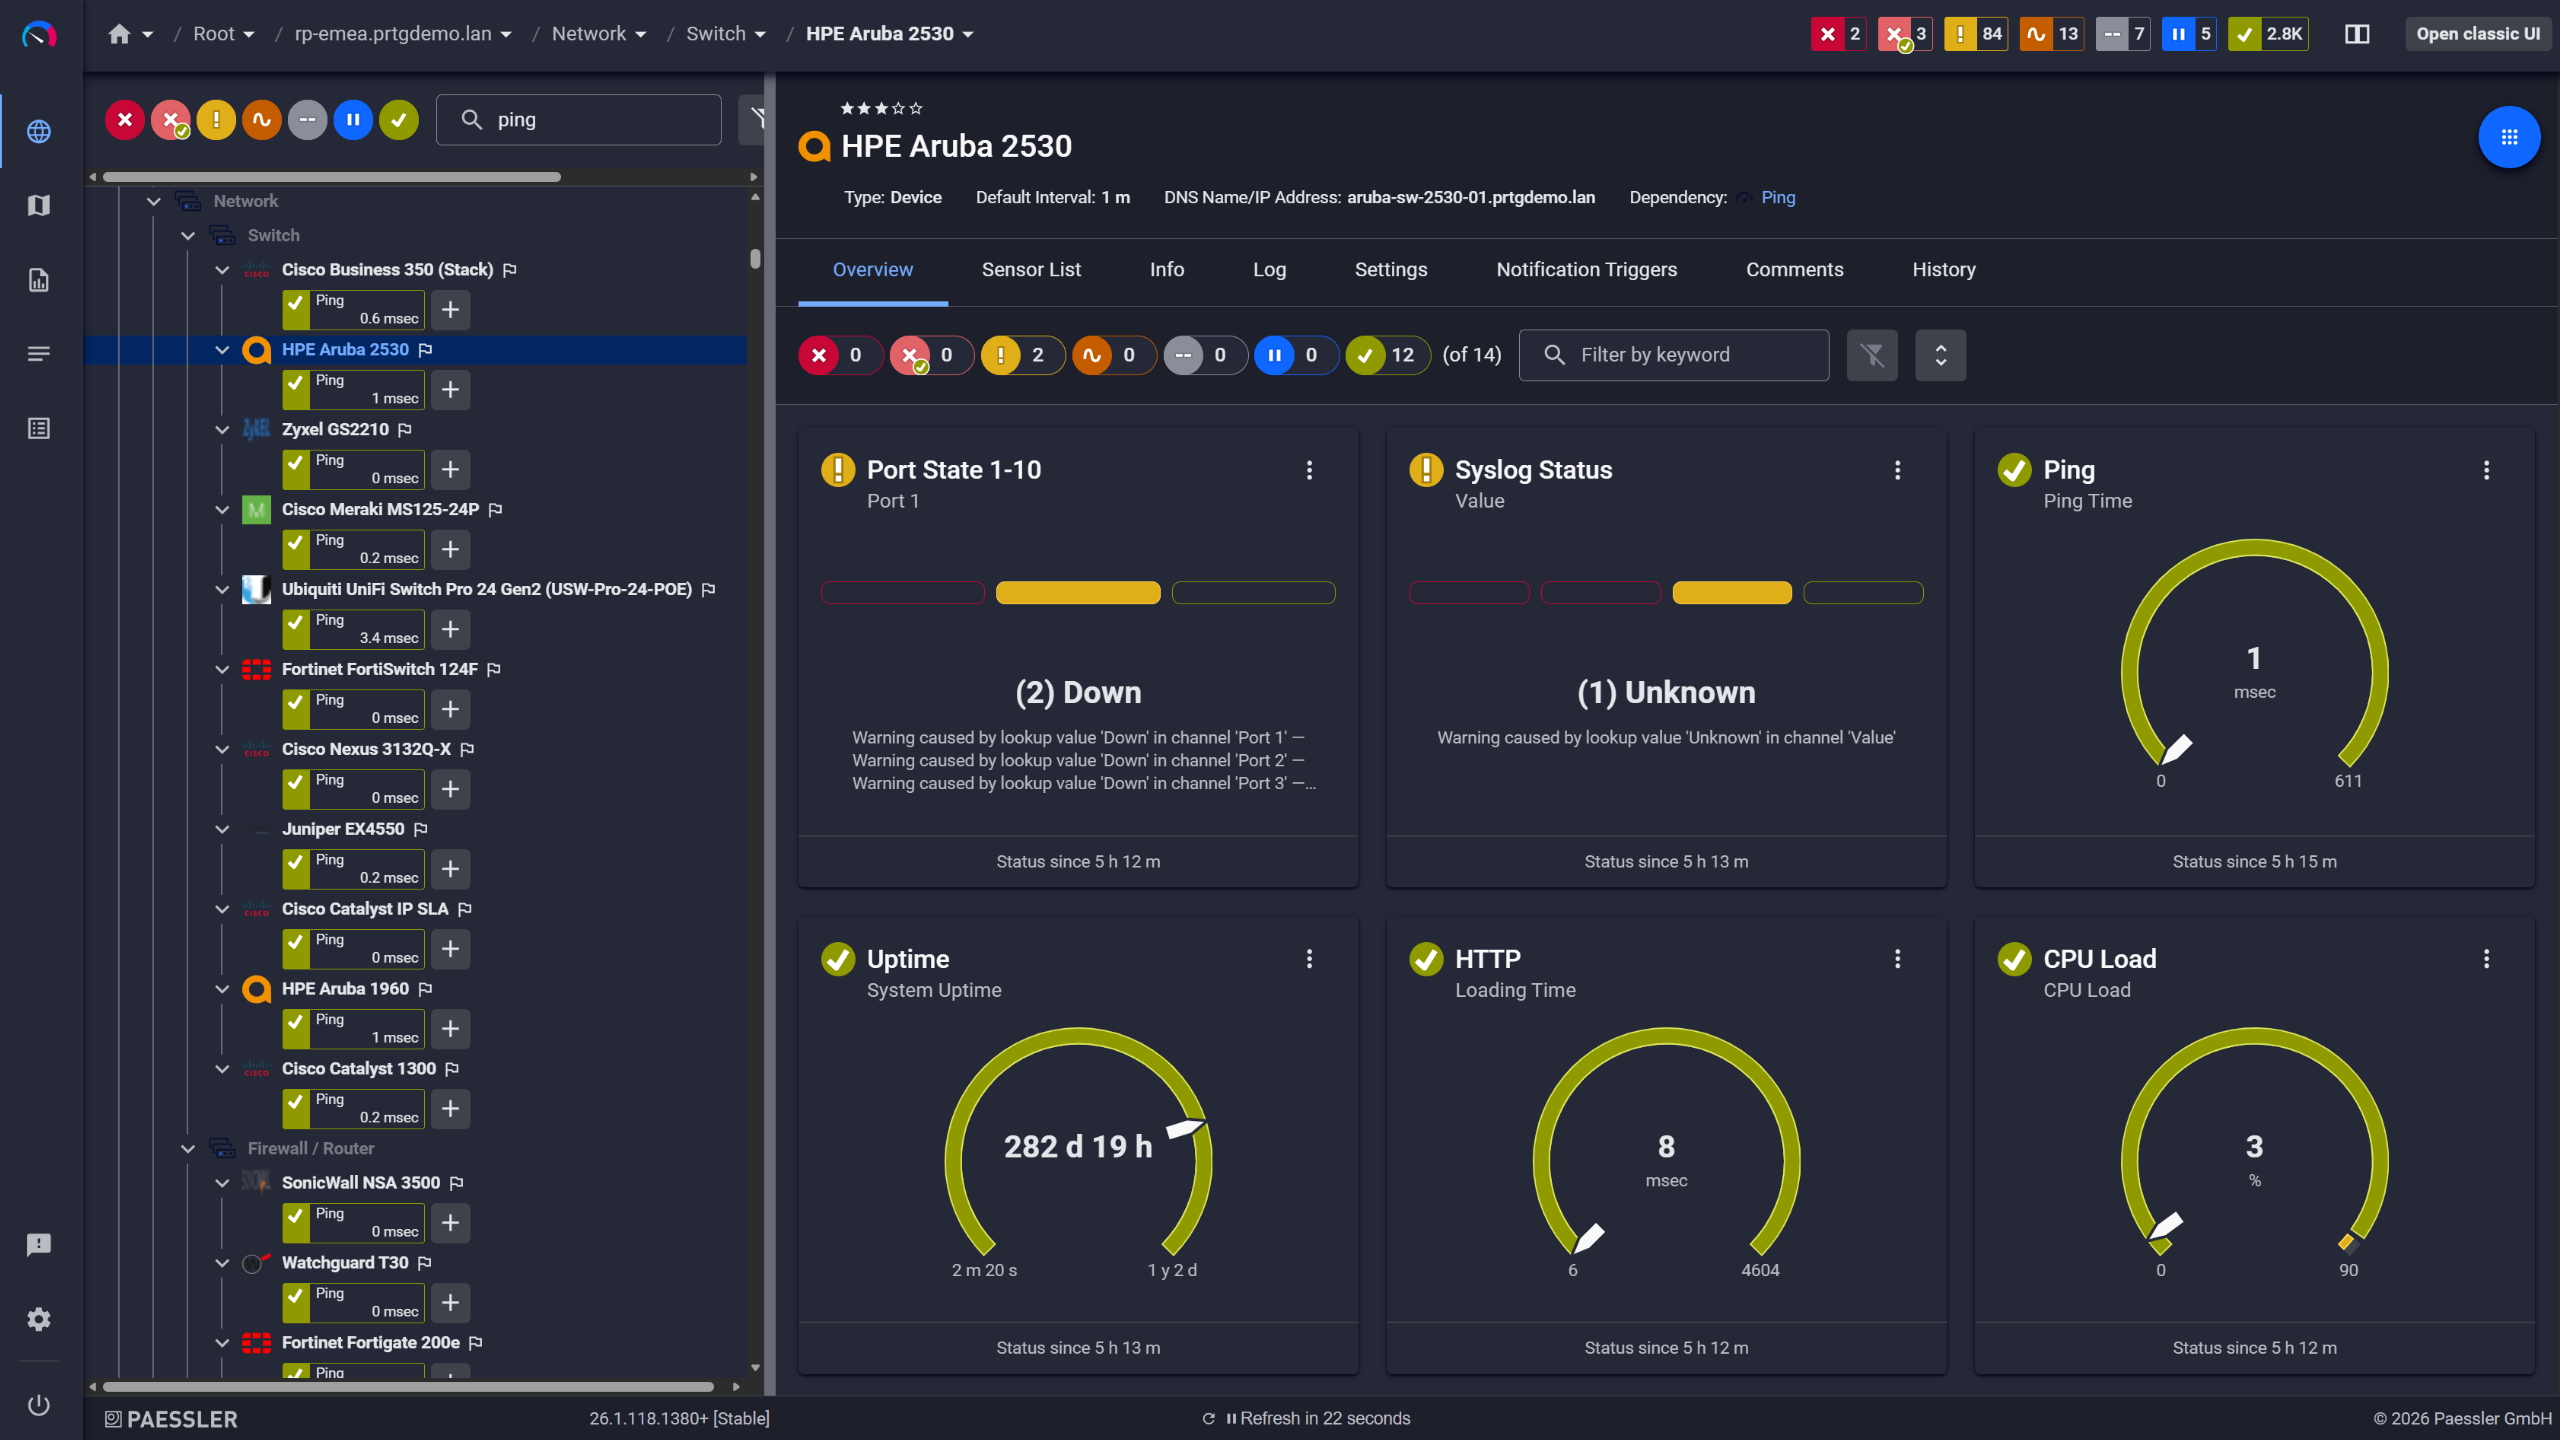
PRTG device overview for an HPE Aruba 2530 switch with port state, ping, and CPU sensors

Network switches monitored across vendors

PRTG web interface showing device tree and full device list with sensor status badges

Full device list, instant overview

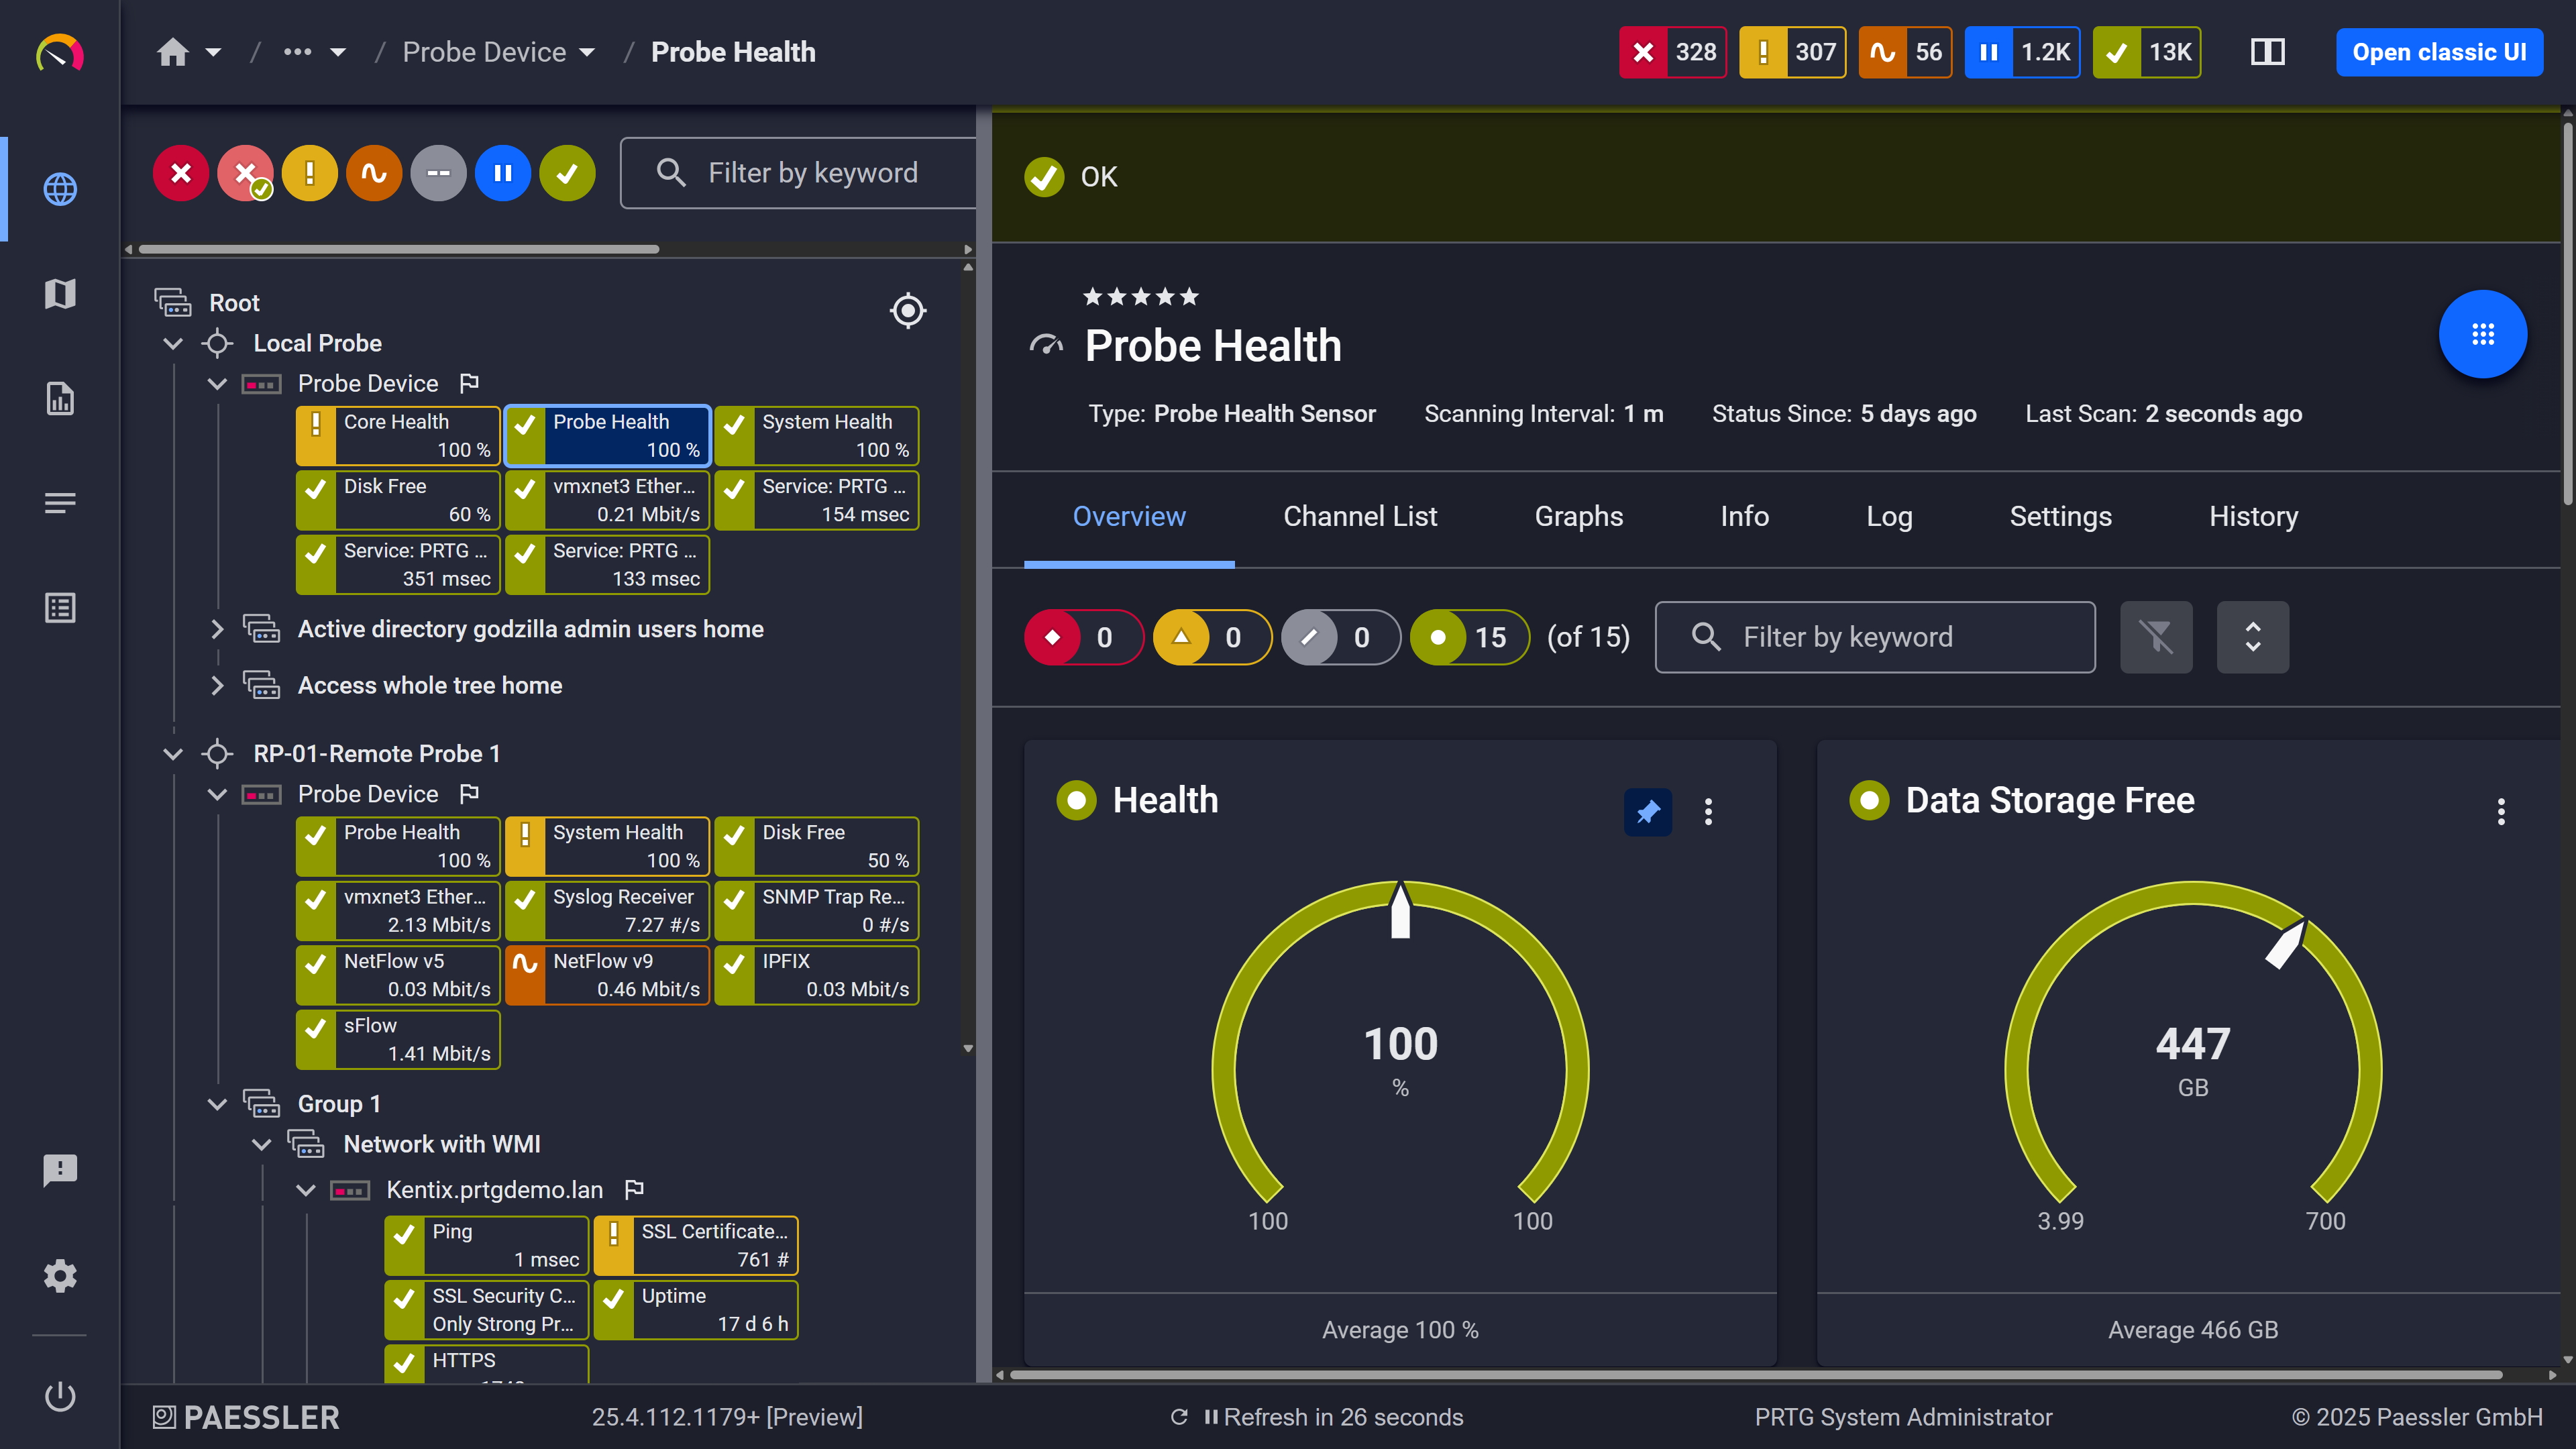
PRTG web interface showing Probe Health sensor with health and storage gauge widgets

Probe health at a glance

One view across your vendor landscape

Most environments are mixed. Cisco here, something else in the core, a couple of legacy boxes that need to stay in production. Each platform has its own management interface, and consolidating visibility across them speeds up troubleshooting considerably.  

PRTG pulls SNMP monitoring into one view. You get preconfigured sensors for many common devices and vendors, plus one set of dashboards and notifications across your network devices. When built-in coverage stops, you can still extend monitoring with custom sensors that poll specific OIDs, optionally with MIB support for readability. Same system, just deeper coverage. 

  • Preconfigured SNMP sensors for many common vendors
  • Monitor routers, switches, firewalls, and servers where SNMP data is available
  • Less context switching between vendor tools
  • Extend monitoring with custom OID-based sensors
  • Consistent dashboards and alerting across devices

See Why IT Professionals Trust PRTG

Start monitoring your infrastructure in minutes. No professional services, no complex configuration, no risk.

Free download
PRODUCT OVERVIEW

Start SNMP monitoring without OID digging

You don't have to start with raw OIDs to get useful monitoring. For many devices, PRTG's preconfigured sensors cover standard SNMP metrics such as interface traffic, CPU load, and uptime, so you get value quickly without manual MIB work.  

+When you need vendor-specific or deeper data, you can monitor specific OIDs (object identifiers) and use a MIB (management information base) to make results easier to interpret. Credentials (community strings for SNMP v1 and SNMP v2c, or SNMP v3 users) are set per device, which helps in mixed environments. Some niche or legacy hardware still needs manual setup. 
  • Start fast with preconfigured SNMP sensors
  • Avoid OID lookups for many common monitoring needs
  • Use a MIB to make custom metrics easier to interpret where applicable
  • Enter OIDs manually when you need full control
  • Configure communities or SNMP v3 users per device
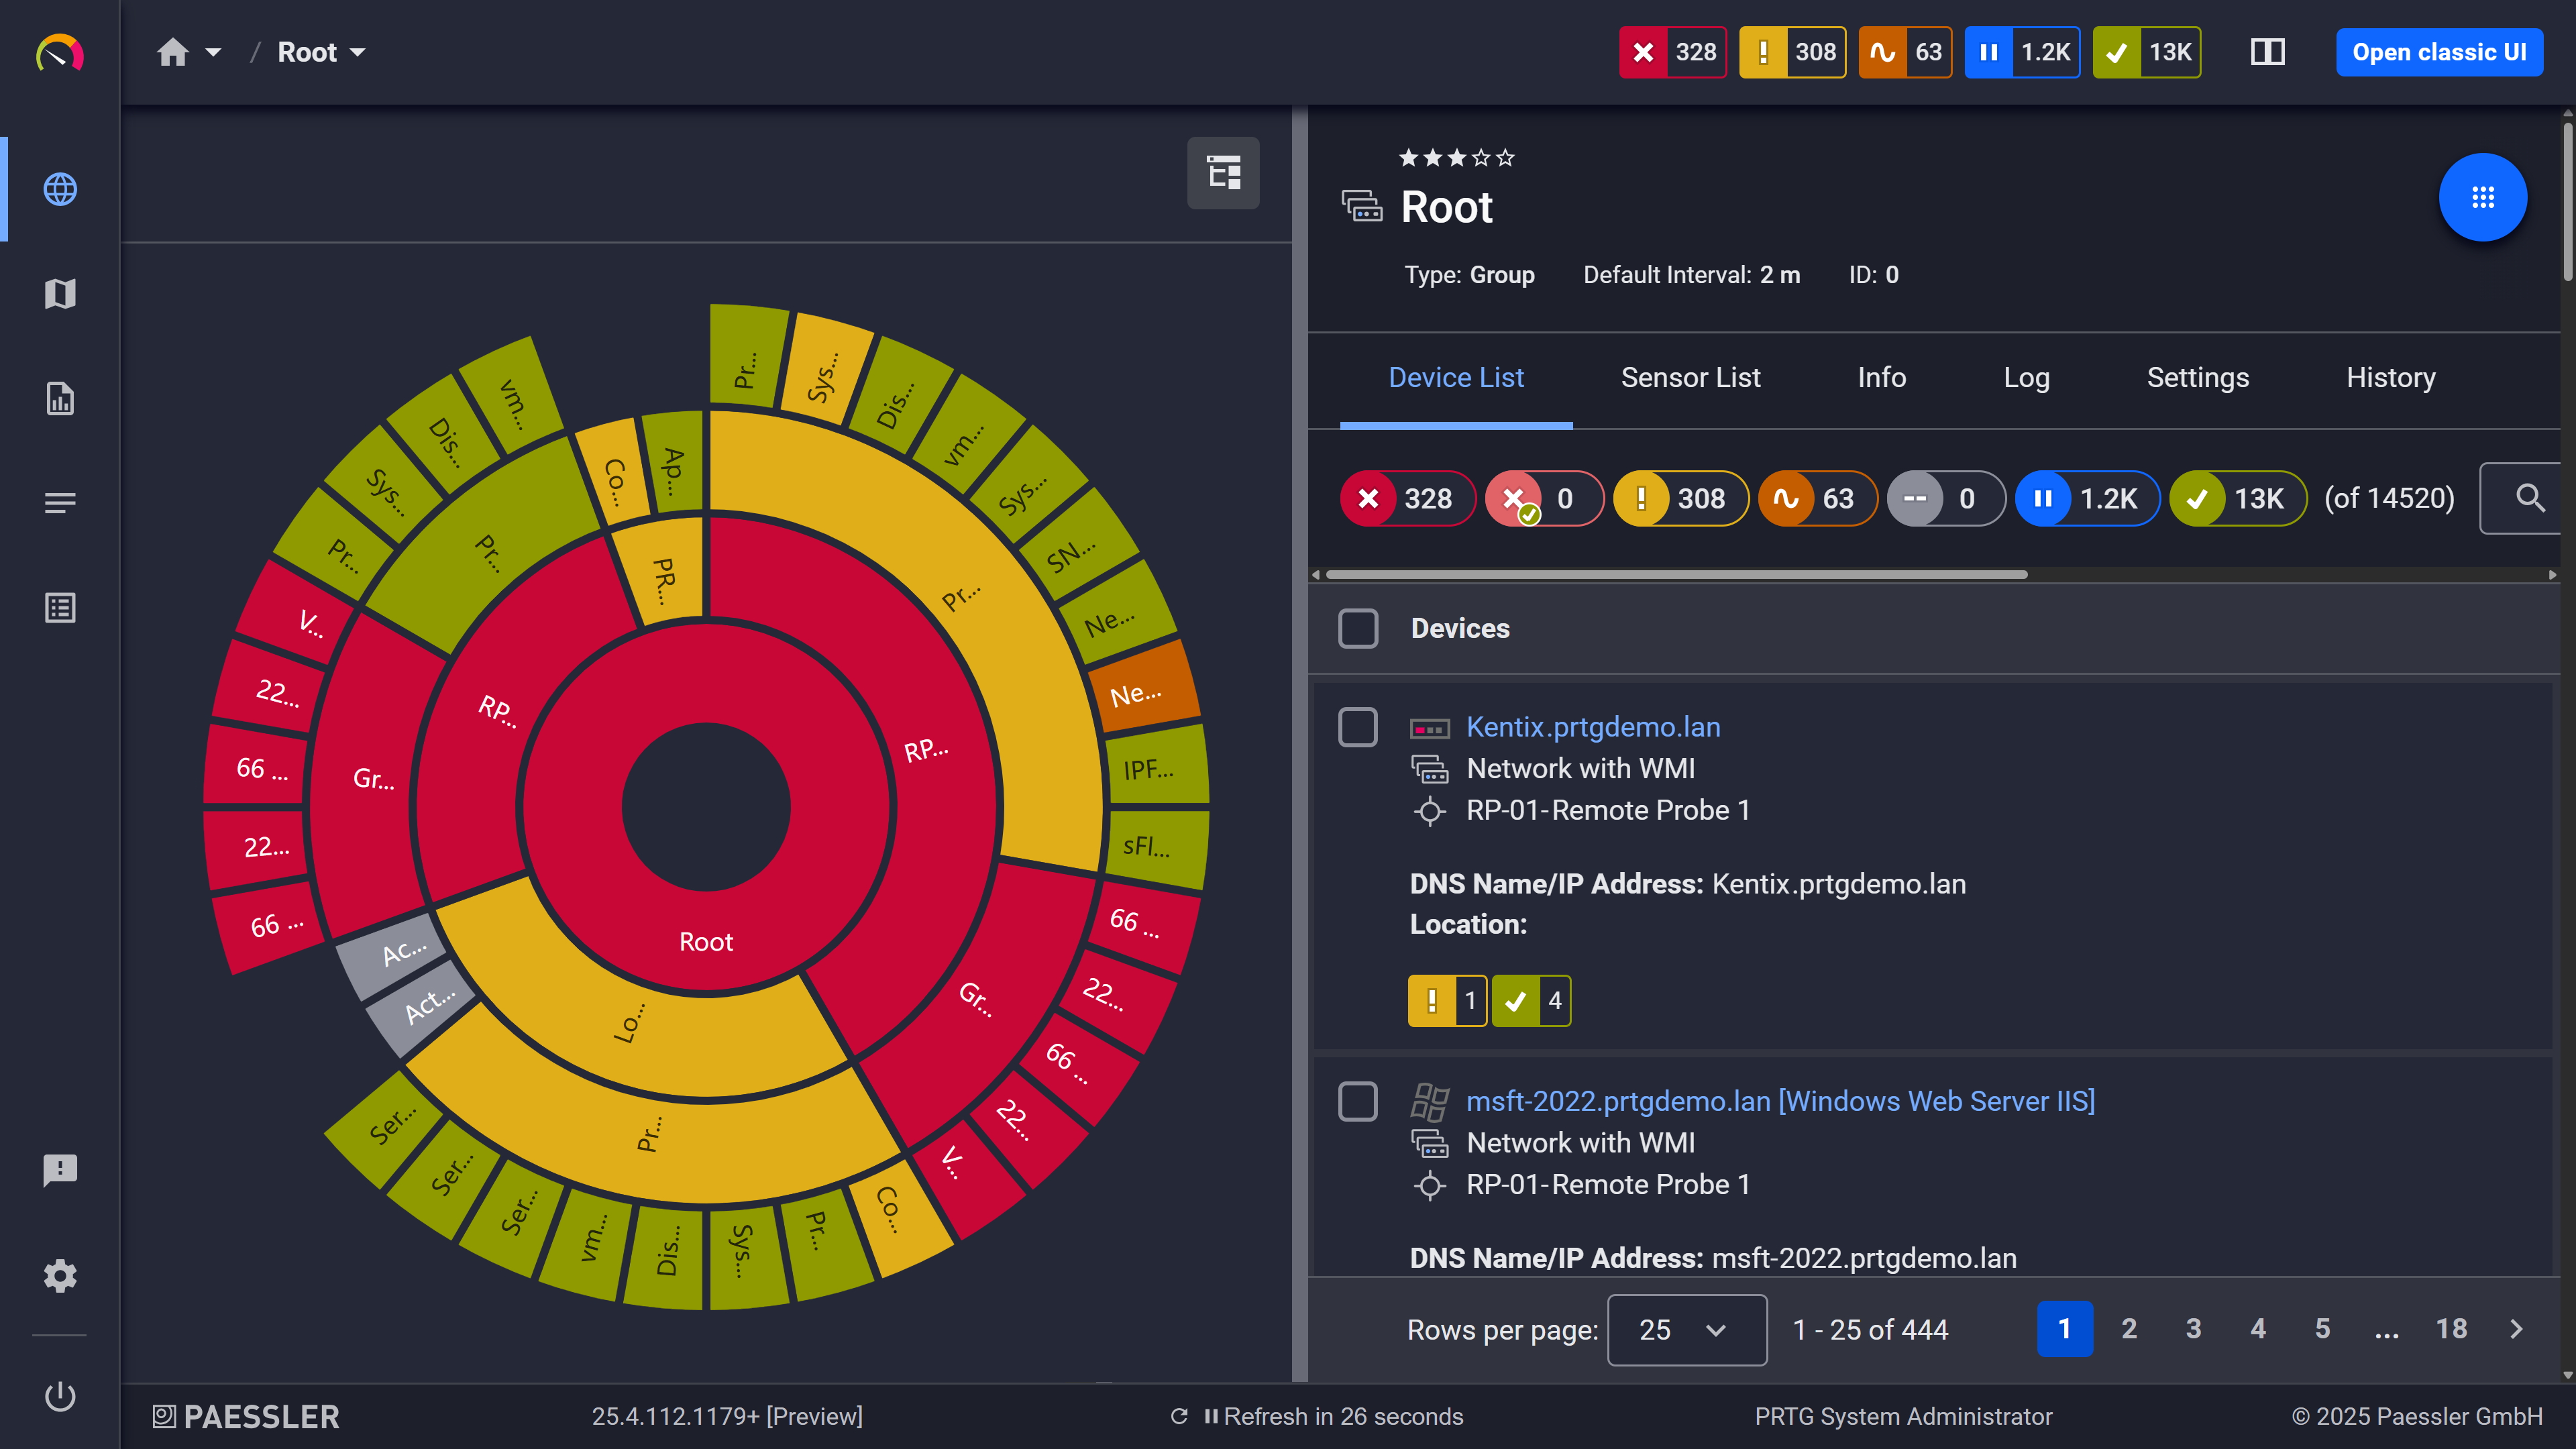
PRTG sunburst chart visualizing the full network hierarchy with color-coded sensor status

Your entire network, visualized instantly
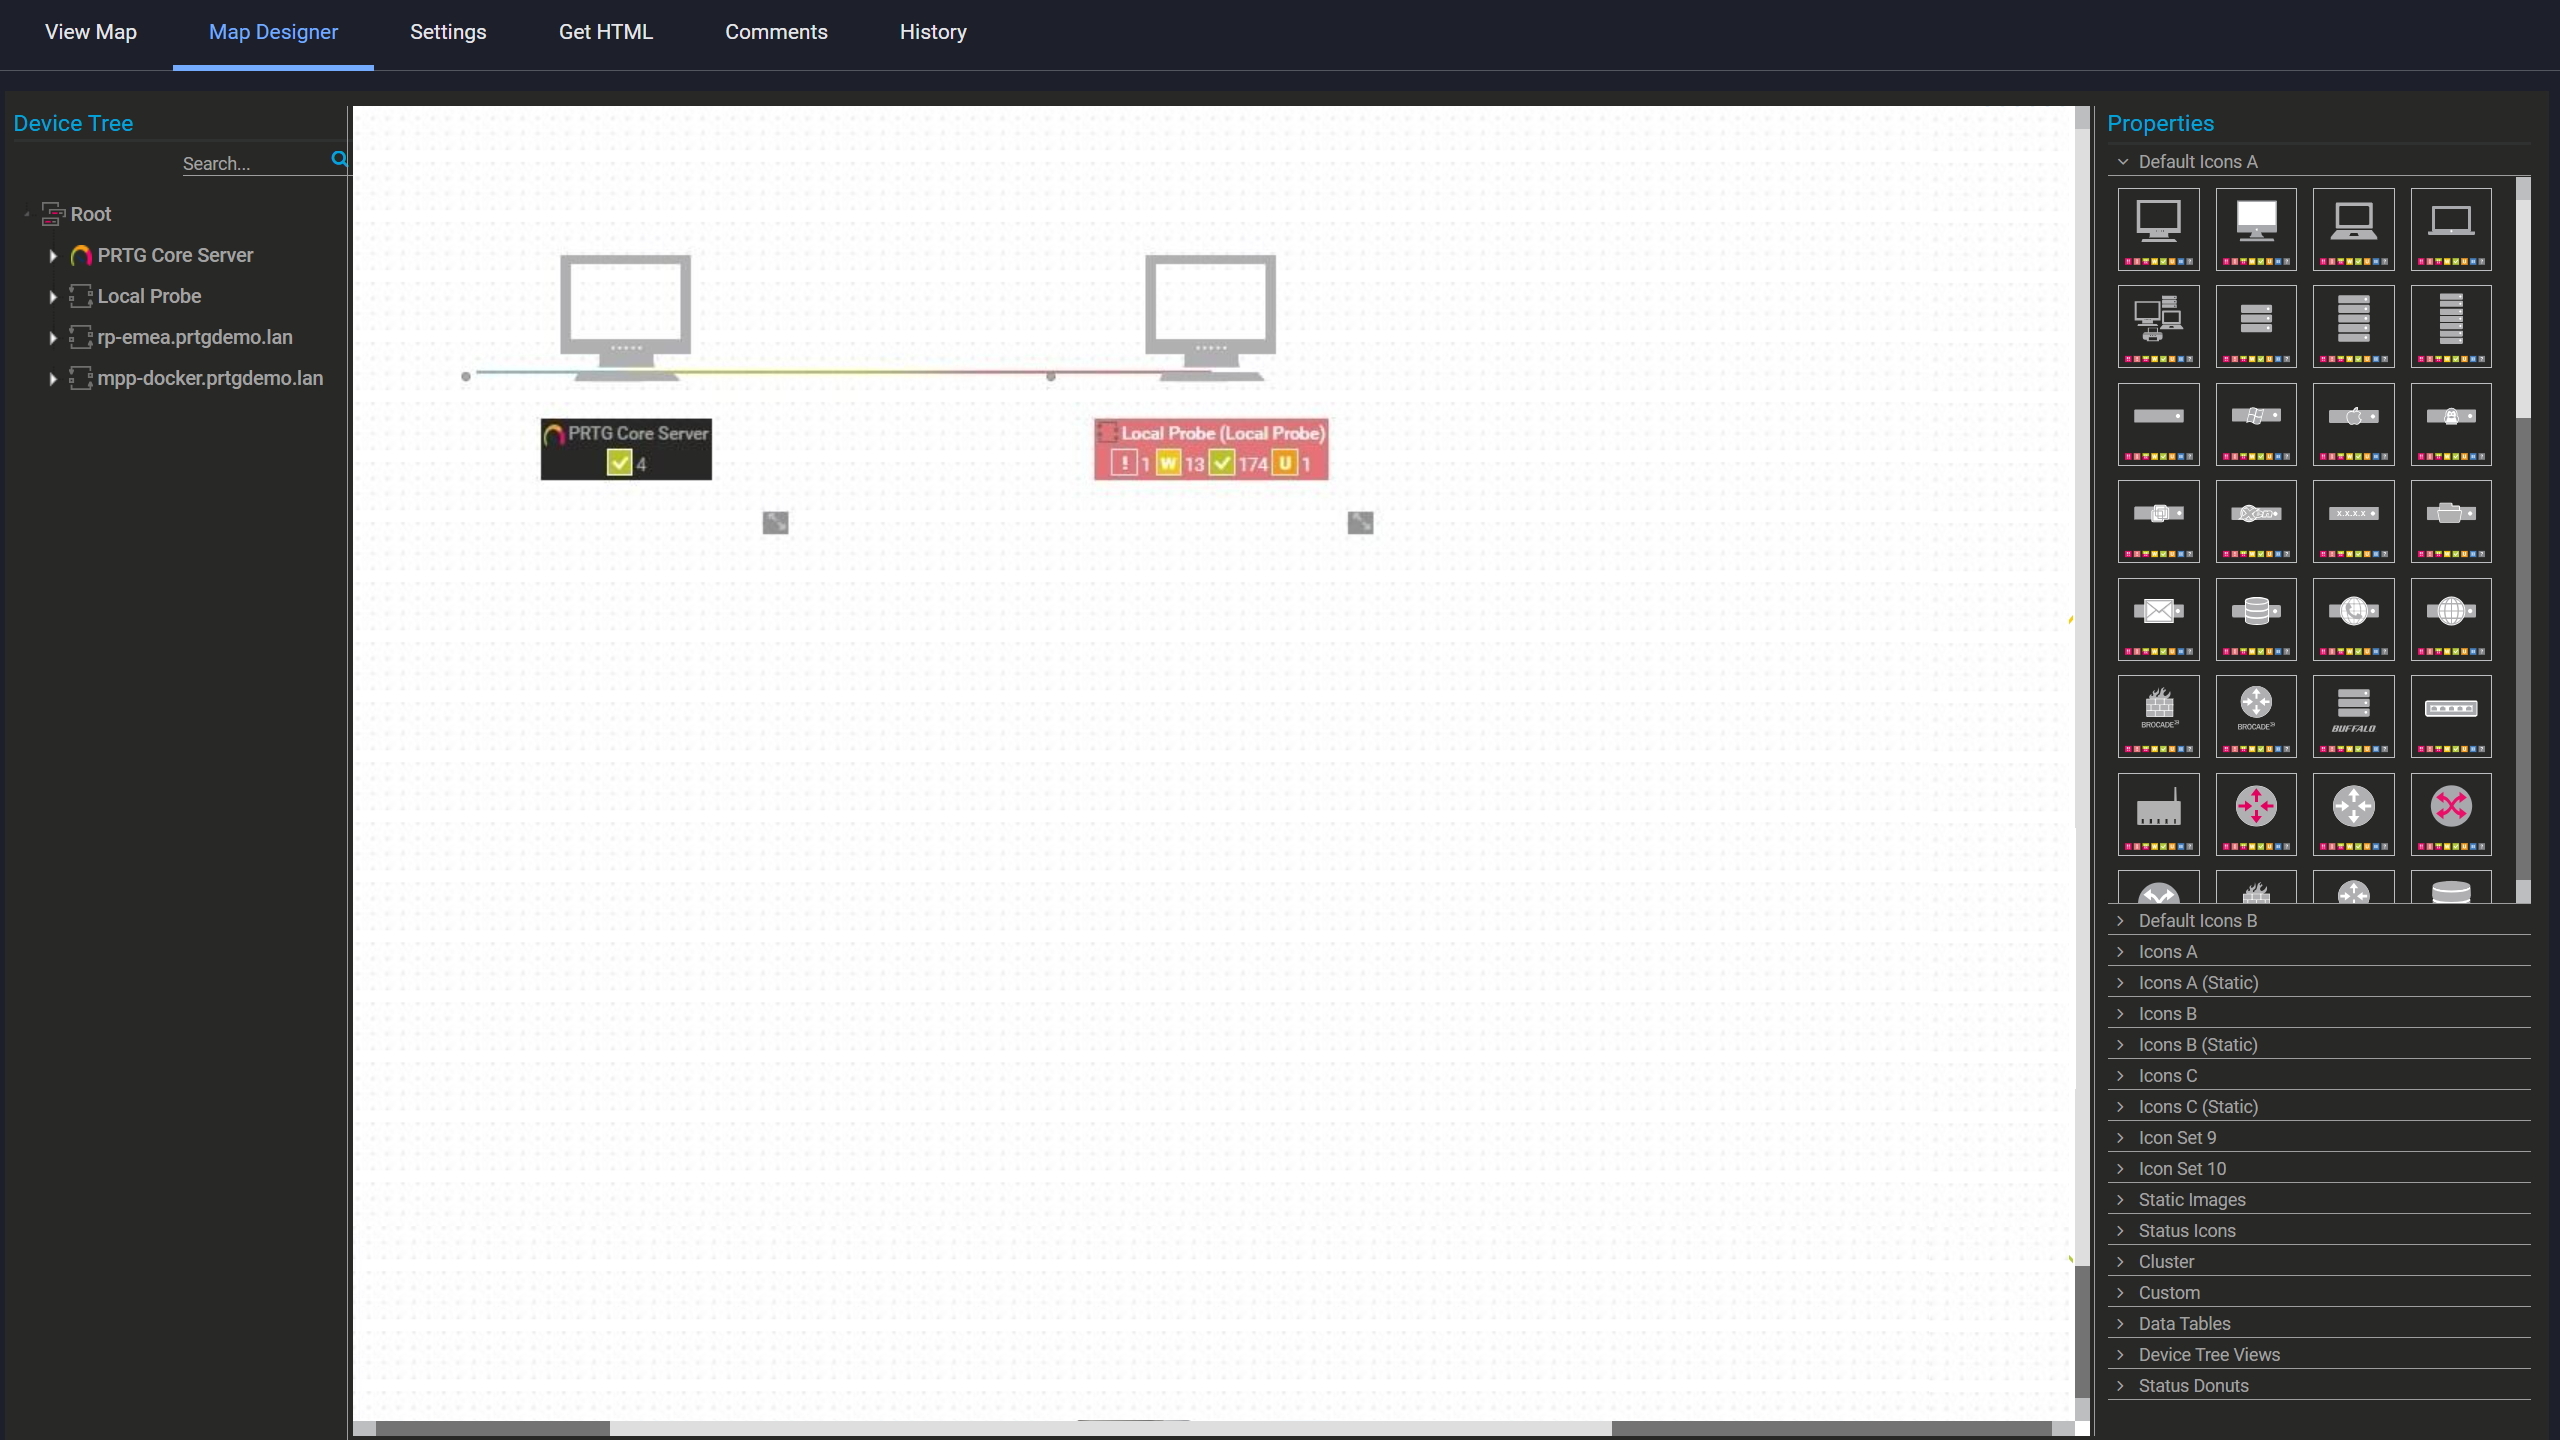
PRTG Map Designer with two network devices placed on a blank canvas

Build your own network map

PRTG reports list showing scheduled monitoring reports with run times and sensor counts

Scheduled reports, always on time

Monitor mixed SNMP versions in production

Real networks run mixed SNMP versions. Older devices may only support SNMP v1 or SNMP v2c, while newer gear uses SNMP v3 for authentication and encryption. PRTG supports SNMP v1, SNMP v2c, and SNMP v3 per device, so you monitor what you have today without turning this into a standardization project first.  

Many teams default to SNMP v2c because it supports 64-bit counters and is widely compatible. SNMP v3 improves security with user-based authentication and optional encryption, but it increases CPU load on the probe, especially at scale. If you monitor a lot of SNMP v3 devices, plan probe capacity and distribute sensors across probes. PRTG can also receive SNMP traps for event-driven messages that complement polling.

  • Support SNMP v1, SNMP v2c, and SNMP v3 per device
  • SNMP v2c as a practical default in many environments
  • SNMP v3 authentication and encryption when you need it
  • Plan probe sizing for larger SNMP v3 deployments and distribute load across probes
  • Receive SNMP traps for event-driven visibility

How PRTG Monitors SNMP Devices

The following covers the technical methods PRTG uses to collect SNMP data: polling, trap reception, discovery, and custom sensor creation. Overview only. Not a step-by-step configuration guide. 

SNMP polling basics

PRTG polls SNMP agents on managed devices over UDP port 161. Depending on the device and the sensor, SNMP requests such as GET and GETBULK may be used to retrieve data efficiently. Polling intervals are configurable per sensor. Many SNMP sensors run at 60 seconds or higher, depending on load and requirements.  

SNMP auto-discovery

When you run auto-discovery, PRTG sends SNMP queries across your defined IP address ranges from the probe. Devices that respond can be matched against built-in templates, which influence which sensors are suggested or created. DNS resolution can populate hostnames where available.  

Discovery and polling run from the probe. For remote networks behind firewalls/NAT or with restricted routing, deploy a Remote Probe in that network to simplify access and reduce WAN dependency.

SNMP traps

The SNMP Trap Receiver sensor listens on UDP port 162 for messages pushed by device agents. Traps are event-driven. A device sends one when a specific condition occurs, instead of waiting for the next poll. Traps complement polling, they do not replace it. Trap Receiver is heavy on resources, and Paessler recommends running no more than 50 SNMP Trap Receiver sensors per probe:

MIBs and OIDs

MIB files map numeric OID values to human-readable names, for example translating numeric identifiers into labels like “System Uptime,” depending on the MIB. When you need to monitor metrics that are not covered by built-in sensors, you can create custom SNMP sensors that poll specific OIDs. MIB handling can vary by environment. Even without a MIB, you can still monitor by entering OIDs directly.

SNMP version specifics

SNMP v1 uses community strings and does not support 64-bit counters, which can affect traffic accuracy on high-throughput links. SNMP v2c supports 64-bit counters and is often a practical default. SNMP v3 adds user-based authentication and optional encryption, which can help when you need stronger access controls, but it increases CPU load on the probe. For larger SNMP v3 deployments, plan probe capacity and distribute sensors across probes as needed. 

free downLoad

SNMP scanning with and without PRTG

Capability

Without PRTG

Without PRTG

With PRTG

With PRTG

Device discovery

Without PRTG
not included

Point-in-time list; outdated quickly

With PRTG
included

Device discovery via IP scans; device tree maintained in PRTG after discovery

Continuous status monitoring

Without PRTG
not included

No ongoing checks or alerting

With PRTG
included

Scheduled polling with threshold-based alerting

Vendor sensor coverage

Without PRTG
not included

You supply OIDs; no vendor context 

With PRTG
included

Options to use MIBs for readability plus manual OID-based custom sensors 

MIB and OID handling

Without PRTG
not included

Raw OIDs; manual interpretation

With PRTG
included

Options to use MIBs for readability plus manual OID-based custom sensors

SNMP version support

Without PRTG
not included

Often v1/v2c; v3 depends on tooling

With PRTG
included

SNMP v1/v2c/v3 supported per device 

Alerts and historical data

Without PRTG
not included

No history; no notifications

With PRTG
included

Graphs/history plus notifications (email and other methods, including push; SMS via gateway/service)

free downLoad

“We strive to equip our systems with state-of-the-art technology to safeguard our educational practices for the future. Part of this includes ensuring that all our systems run smoothly at all times. On any given day, we rarely have time to keep an eye on all our systems. We therefore decided to monitor our school’s IT environment with a centralized network monitoring tool.”

Stefan Roschewitz, IT administrator
BBS Holzminden

With PRTG, we are now more proactive and have improved the quality of our services. Now, we have everything measured: power, air conditioning, tanks, surveillance cameras (CCTV), processors, memories, disks, switches, bandwidth, and network traffic. We can see what is happening and act before any problem arises.

Esbin Saúl Lázaro García, IT Infrastructure and Security Engineer
Hospital El Pilar

The reactivity, know-how, and technical solutions of Paessler support are outstanding in every situation. For me, no monitoring tool compares to PRTG.

 Andreas Reimann, Senior Networking Communication Architect
Zurich Airport

Paessler PRTG Network Monitor licenses & pricing

Choose the PRTG Network Monitor subscription that's best for you.

License NameLicense descriptionPriceLicense DetailsGet startedPricing Details
PRTG 500$200per month paid annuallyBuy nowBuy now

Enough to monitor multiple aspects of 50 devices

PRTG 1000$358per month paid annuallyBuy nowBuy now

Enough to monitor multiple aspects of 100 devices

PRTG 2500$742per month paid annuallyBuy nowBuy now

Enough to monitor multiple aspects of 250 devices

PRTG 5000$1,300per month paid annuallyBuy nowBuy now

Enough to monitor multiple aspects of 500 devices

PRTG 10000$1,642per month paid annuallyBuy nowBuy now

Enough to monitor multiple aspects of 1000 devices

Over 100,000 Customers Worldwide Love Paessler  

customer success stories

 SNMP Scanner: Frequently Asked Questions


What’s the difference between an SNMP scanner and continuous SNMP monitoring?

An SNMP scanner discovers devices that support SNMP at a point in time. You get a list. Continuous SNMP monitoring polls those devices on a schedule, tracks metrics over time, and alerts you when something changes. Discovery tells you what is there. Monitoring shows what is happening. 

Which SNMP versions does PRTG support and which should I use?

Per device: SNMP v1, SNMP v2c, or SNMP v3. For many environments, SNMP v2c is a practical choice because it supports 64-bit counters and keeps setup simple. If you need authentication and encryption, use SNMP v3 and plan probe capacity accordingly, because encryption increases CPU load per probe. 

Do I need to load MIB files manually for every device?

No. PRTG includes preconfigured sensors for many common devices, which do not require MIB work to get started. A MIB is mainly useful when you monitor devices or metrics not covered by built-in sensors and want more readable names for OIDs. If no MIB is available, you can still enter OIDs manually. 

How does PRTG handle devices that don’t have a pre-built sensor?

For SNMP-capable devices without dedicated coverage, PRTG’s custom SNMP sensors let you define which OIDs to poll. You can use a MIB where applicable for more readable metric names, or enter OIDs directly if you already know them. It takes more setup than using a preconfigured sensor, but it covers a wide range of SNMP-exposed metrics. 

What is a community string, and how does it work with SNMP monitoring?

A community string is a plain-text identifier used by SNMP v1 and SNMP v2c to authenticate requests between the monitoring system and the device agent. PRTG includes the community string in each SNMP query. If it matches what the device accepts, the device responds with data. Because community strings are transmitted in clear text, keep them to trusted internal networks. SNMP v3 replaces community strings with user-based authentication and optional encryption. 

Can PRTG monitor Windows and Linux systems via SNMP?

Yes, if Windows or Linux systems run SNMP agents that expose metrics such as CPU, memory, disk, and uptime, PRTG can monitor those metrics via SNMP sensors. In many Windows environments, WMI can provide more detailed information than SNMP, and PRTG supports WMI as well. 

What’s the difference between SNMP polling and SNMP traps?

Polling means PRTG queries a device at set intervals. PRTG asks, the device answers. SNMP traps are sent by the device agent to PRTG when an event occurs, without waiting for the next poll. Polling provides consistent metric collection. Traps can provide faster notification for specific events. They work best together. 

Which ports does PRTG use for SNMP scanning and trap collection?

PRTG uses UDP port 161 for SNMP polling. SNMP traps are received on UDP port 162. Ensure these ports are permitted between your probe and the monitored devices. Firewalls and ACLs are common causes of missing SNMP responses. 

Paessler PRTG

Paessler PRTG

Network Monitoring Software – Version 26.1.116.1532 (February 9th, 2026)

Hosting icon

Hosting

Download for Windows and cloud-based version PRTG Hosted Monitor available

Languages icon

Languages

English, German, Spanish, French, Portuguese, Dutch, Russian, Japanese, and Simplified Chinese

test

Monitor everything

Network devices, bandwidth, servers, applications, virtual environments, remote systems, IoT, and more

test

Pricing

Choose the PRTG Network Monitor subscription that's best for you

Discover more monitoring insights and stories

Content illustration

Powerful stories from the monitoring world

  • Closing Out 2025: Why the Net-SNMP Vulnerability Matters to Your ...
  • SNMP Doesn't Work! Can Somebody Out There Please Help?!
  • SNMP v2 vs v3: Security Comparison Guide for Network Monitoring
Support illustration

Resources to master your monitoring challenges

  • Disable SNMP Scanning on Groups of devices - Paessler Helpdesk
  • PRTG Manual: Monitoring via SNMP - Paessler
  • SNMP sensors on probe device after update - Paessler Helpdesk
Solution illustration

Solutions for all your monitoring needs

  • SNMP Scanner
  • Monitoring Technologies
  • SNMP Port Analyzer
PRTG Logo

Start Monitoring with PRTG and see how it can make your network more reliable and your job easier.

Free download
PRODUCT OVERVIEW

Products

  • Paessler PRTG
    Paessler PRTGMonitor your whole IT infrastructure
    • PRTG Network Monitor
    • PRTG Enterprise Monitor
    • PRTG Hosted Monitor
    • PRTG UVexplorer
    • PRTG extensions
      Extensions for Paessler PRTGExtend your monitoring to a new level
  • Icon Features
    FeaturesExplore all monitoring features

Monitoring with PRTG

  • Network monitoring
  • Bandwidth monitoring
  • SNMP monitoring
  • Network mapping
  • Wi-Fi monitoring
  • Server monitoring
  • Network traffic analyzer
  • NetFlow monitoring
  • Syslog server

Useful Links

  • PRTG Manual
  • Knowledge Base
  • Customer Success Stories
  • About Paessler
  • Subscribe to newsletter
  • PRTG Support
  • PRTG Consulting
  • PRTG Feedback & Roadmap

Contact

Paessler GmbH
Thurn-und-Taxis-Str. 14, 
90411 Nuremberg 
Germany

[email protected]

+49 911 93775-0

  • Contact us
©2026 Paessler GmbHTerms & ConditionsPrivacy PolicyImprintReport VulnerabilityDownload & InstallSitemap
SNMP, MIBs and OIDs SNMP, MIBs and OIDs SNMP, MIBs and OIDs