• Company
    • About Us
    • Case Studies
    • Press Center
    • Careers
    • Blog
    • Contact us
  • Contact us
  • Login
 
  • English
    • Deutsch
    • Español
    • Français
    • Italiano
    • Português
Paessler
                    - The Monitoring Experts
  • Products
    • Paessler PRTG
      Paessler PRTGMonitor your whole IT infrastructure
      • PRTG Network Monitor
      • PRTG Enterprise Monitor
      • PRTG Hosted Monitor
      • PRTG UVexplorer
      • PRTG extensionsExtensions for Paessler PRTGExtend your monitoring to a new level
    • Icon Features
      FeaturesExplore all monitoring features
      • Maps & dashboards
      • Alerts & notifications
      • Multiple user interfaces
      • Distributed monitoring
      • Customizable reporting
  • Solutions
    • Industries
      IndustriesMonitor various industry sectors
      • Industrial
      • Healthcare
      • Data Center
      • Education
      • Finance
      • Government
    • IT Topics
      IT TopicsMonitor all areas of IT
      • Network Monitoring
      • Bandwidth Monitoring
      • SNMP Monitor
      • Network Mapping
      • WiFi Monitoring
      • Server Monitoring
  • Pricing
  • Resources
    • Getting Started
      Getting StartedModules for self-paced learning
    • How-to Guides
      How-to GuidesGet the most out of PRTG
    • Videos & Webinars
      Videos & WebinarsLearn from Paessler experts
    • IT  Knowledge
      IT KnowledgeExpand your IT knowledge
    • PRTG Manual
      PRTG ManualFull documentation
    • Knowledge Base
      Knowledge BaseShare community knowledge
    • PRTG Sensor Hub
      PRTG Sensor HubGet sensors, scripts & templates
    • Trainings
      PRTG TrainingLearn how to work with PRTG
  • Partners
    • Icon Handshake
      Become a PartnerFor resellers and channel partners
    • Icon MSP
      Become an MSPDeliver monitoring as a managed service
    • icon partner
      Partner PortalLog in to your partner account
    • Deal Registration
      Deal RegistrationRegister your sales opportunities
    • icon search
      Find a PartnerFind partners selling Paessler products
    • icon technology
      Technology AlliancesSee Paessler technology partnerships
    • Partner HubTools for Your Success
  • Company
    • About Us
    • Case Studies
    • Press Center
    • Careers
    • Blog
    • Contact us
  • Contact us
  • Login
  • English
    • Deutsch
    • Español
    • Français
    • Italiano
    • Português
  • Get a quote
  • Free trial

Powerful MIB Browser

Import vendor MIB files, map your OIDs, and turn them into continuous SNMP monitoring sensors. 

Free download
PRODUCT OVERVIEW

How do you turn MIB files into continuous SNMP monitoring?  

Every SNMP-enabled device ships with a Management Information Base (MIB) that defines what it can report: interface counters, CPU load, temperatures, storage, fan speeds. Monitoring those values means knowing which OIDs to query, and that starts with importing and navigating the vendor's MIB file. The Paessler PRTG MIB Importer is a free, standalone Windows application that reads these files, lets you browse the full MIB tree, and converts selected OIDs to .oidlib format that PRTG picks up directly for sensor creation. SNMPv1, SNMPv2c, and SNMPv3 are all supported, including authentication and encryption. 

⚠️ Platform note: The MIB Importer and PRTG core server both require Windows. Neither runs on Linux or macOS. PRTG remote probes can run on Linux for distributed setups, but the core server stays Windows-based. PRTG monitors SNMP devices from Cisco, Juniper, Dell, SonicWall, QNAP, Synology, Rittal, and any vendor that provides a standard MIB file: routers, switches, firewalls, servers, UPS systems, and more. 

Download PRTG Trial

What you will find on this page

  • What Your MIB Files Tell You
  • How PRTG Monitors MIB
  • PRTG vs. Manual MIB Monitoring
  • FAQs

PRTG is compatible with all major vendors, products, and systems

compatible with all major vendors, products, and systems

Everything Your MIB Files Can Tell You

MIBs Into Live Monitoring  

Finding the right OID in a MIB tree is step one. Getting it into continuous monitoring usually means switching tools and starting a separate configuration from scratch. The Paessler MIB Importer browses the full MIB tree, converts selected OIDs to an .oidlib file, and PRTG picks that file up directly to create sensors. Channel names come from the MIB definition: actual object names and units, not raw strings like 1.3.6.1.4.1.x.x.x. One workflow from MIB import to live sensor. The channel names are readable by anyone on the team, not just whoever ran the initial import. 

  • Import any vendor MIB file and navigate the OID tree via the MIB Importer GUI  
  • Convert to .oidlib, then create SNMP sensors in PRTG directly. No separate protocol configuration step.  
  • Sensor channels labeled with MIB-defined object names and units, not numeric OID strings  
  • Works across SNMP Custom, SNMP Custom Advanced, SNMP Library, and SNMP Custom Table sensor types  
  • SNMP Trap sensors can also translate received OIDs into readable names, if the MIB has been configured for trap use 

Monitor Any SNMP Device 

If a device speaks SNMP and ships with a MIB file, all the data you need is already defined. Download the vendor MIB from the manufacturer's support portal (Cisco, Juniper, Dell, SonicWall, and most others publish them), import it into the MIB Importer, and the SNMP Library sensor maps every OID the file defines into a monitorable channel. For common vendors, PRTG's built-in MIB libraries cover this without any import step. Niche hardware, older product generations, proprietary appliances: virtually any device with SNMP support and a valid MIB file works, using the same import process.  

  • Import standard and vendor-specific MIB files, including proprietary and custom MIBs
  • The SNMP Library sensor reads the .oidlib to determine what data types and channels are available
  • Monitor any OID the MIB defines: interface counters, CPU load, temperature, fan speed, storage utilization. That covers most of what you'd actually need.
  • Built-in MIB libraries cover common vendors out of the box. Custom imports handle the rest.
  • One workflow across all vendors. No per-device tooling.
PRTG device overview for an HPE Aruba 2530 switch with port state, ping, and CPU sensors

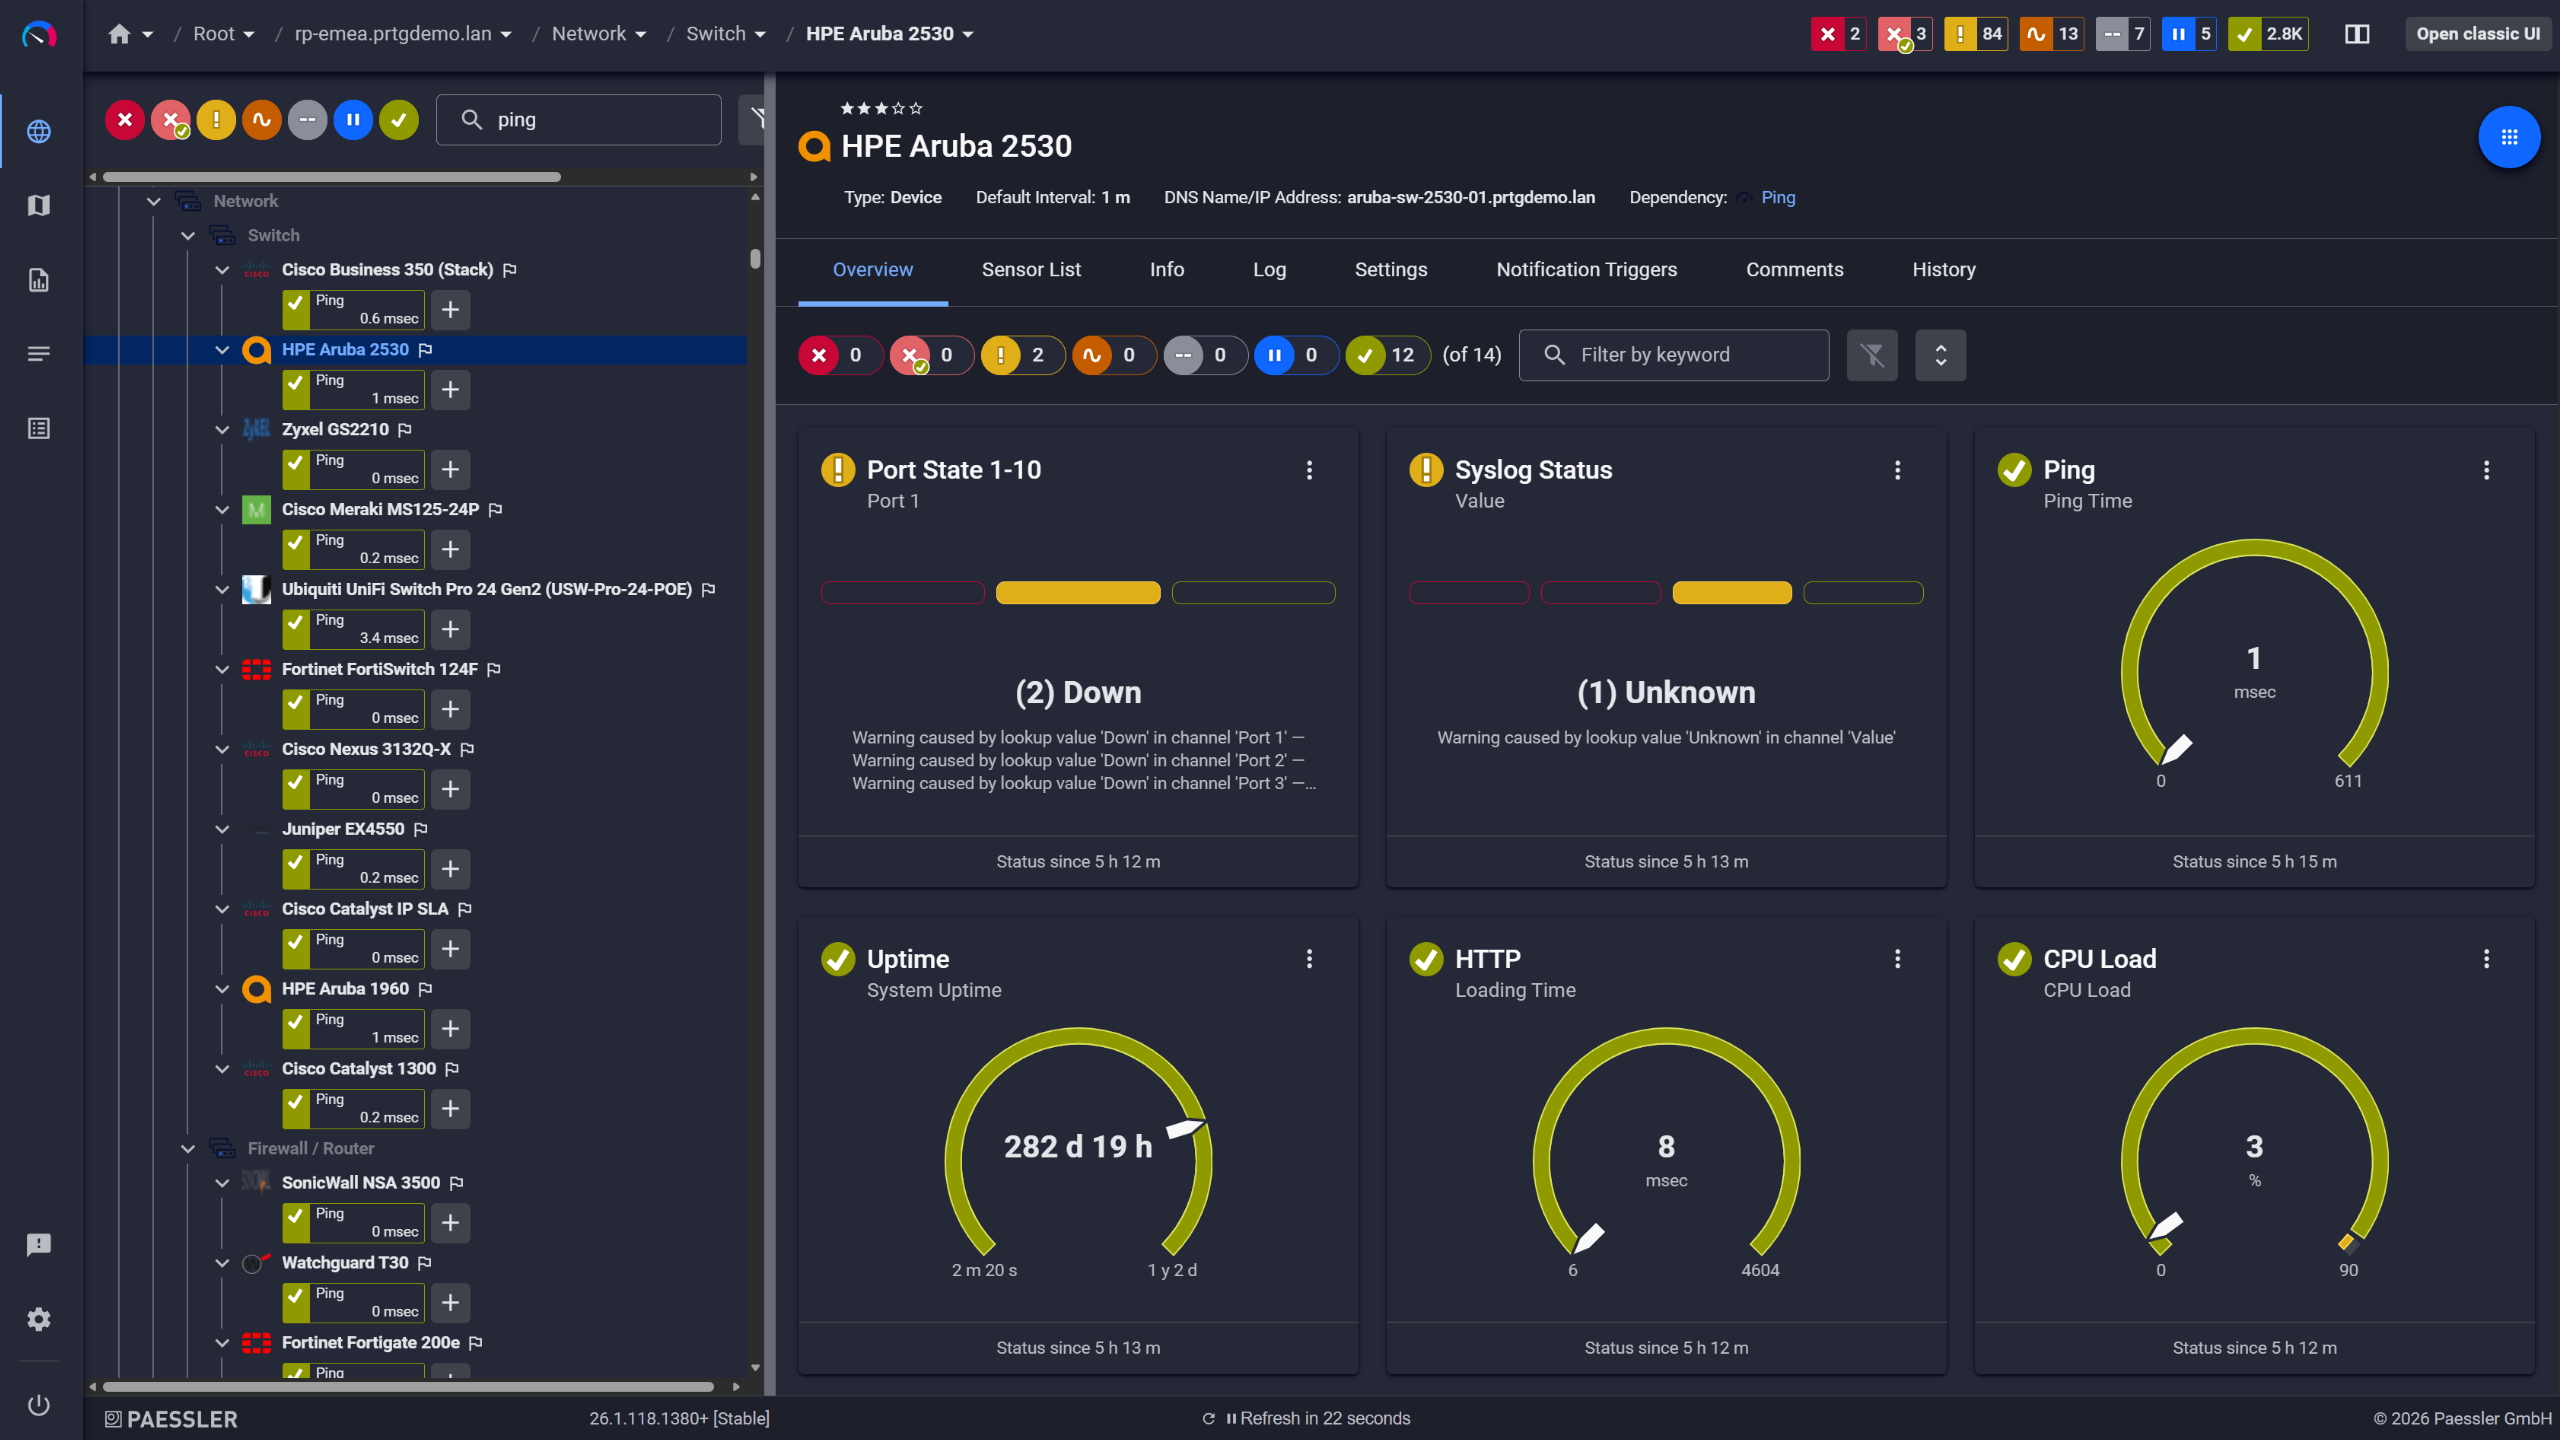
Network switches monitored across vendors

PRTG web interface showing device tree and full device list with sensor status badges

Full device list, instant overview

PRTG web interface showing Probe Health sensor with health and storage gauge widgets

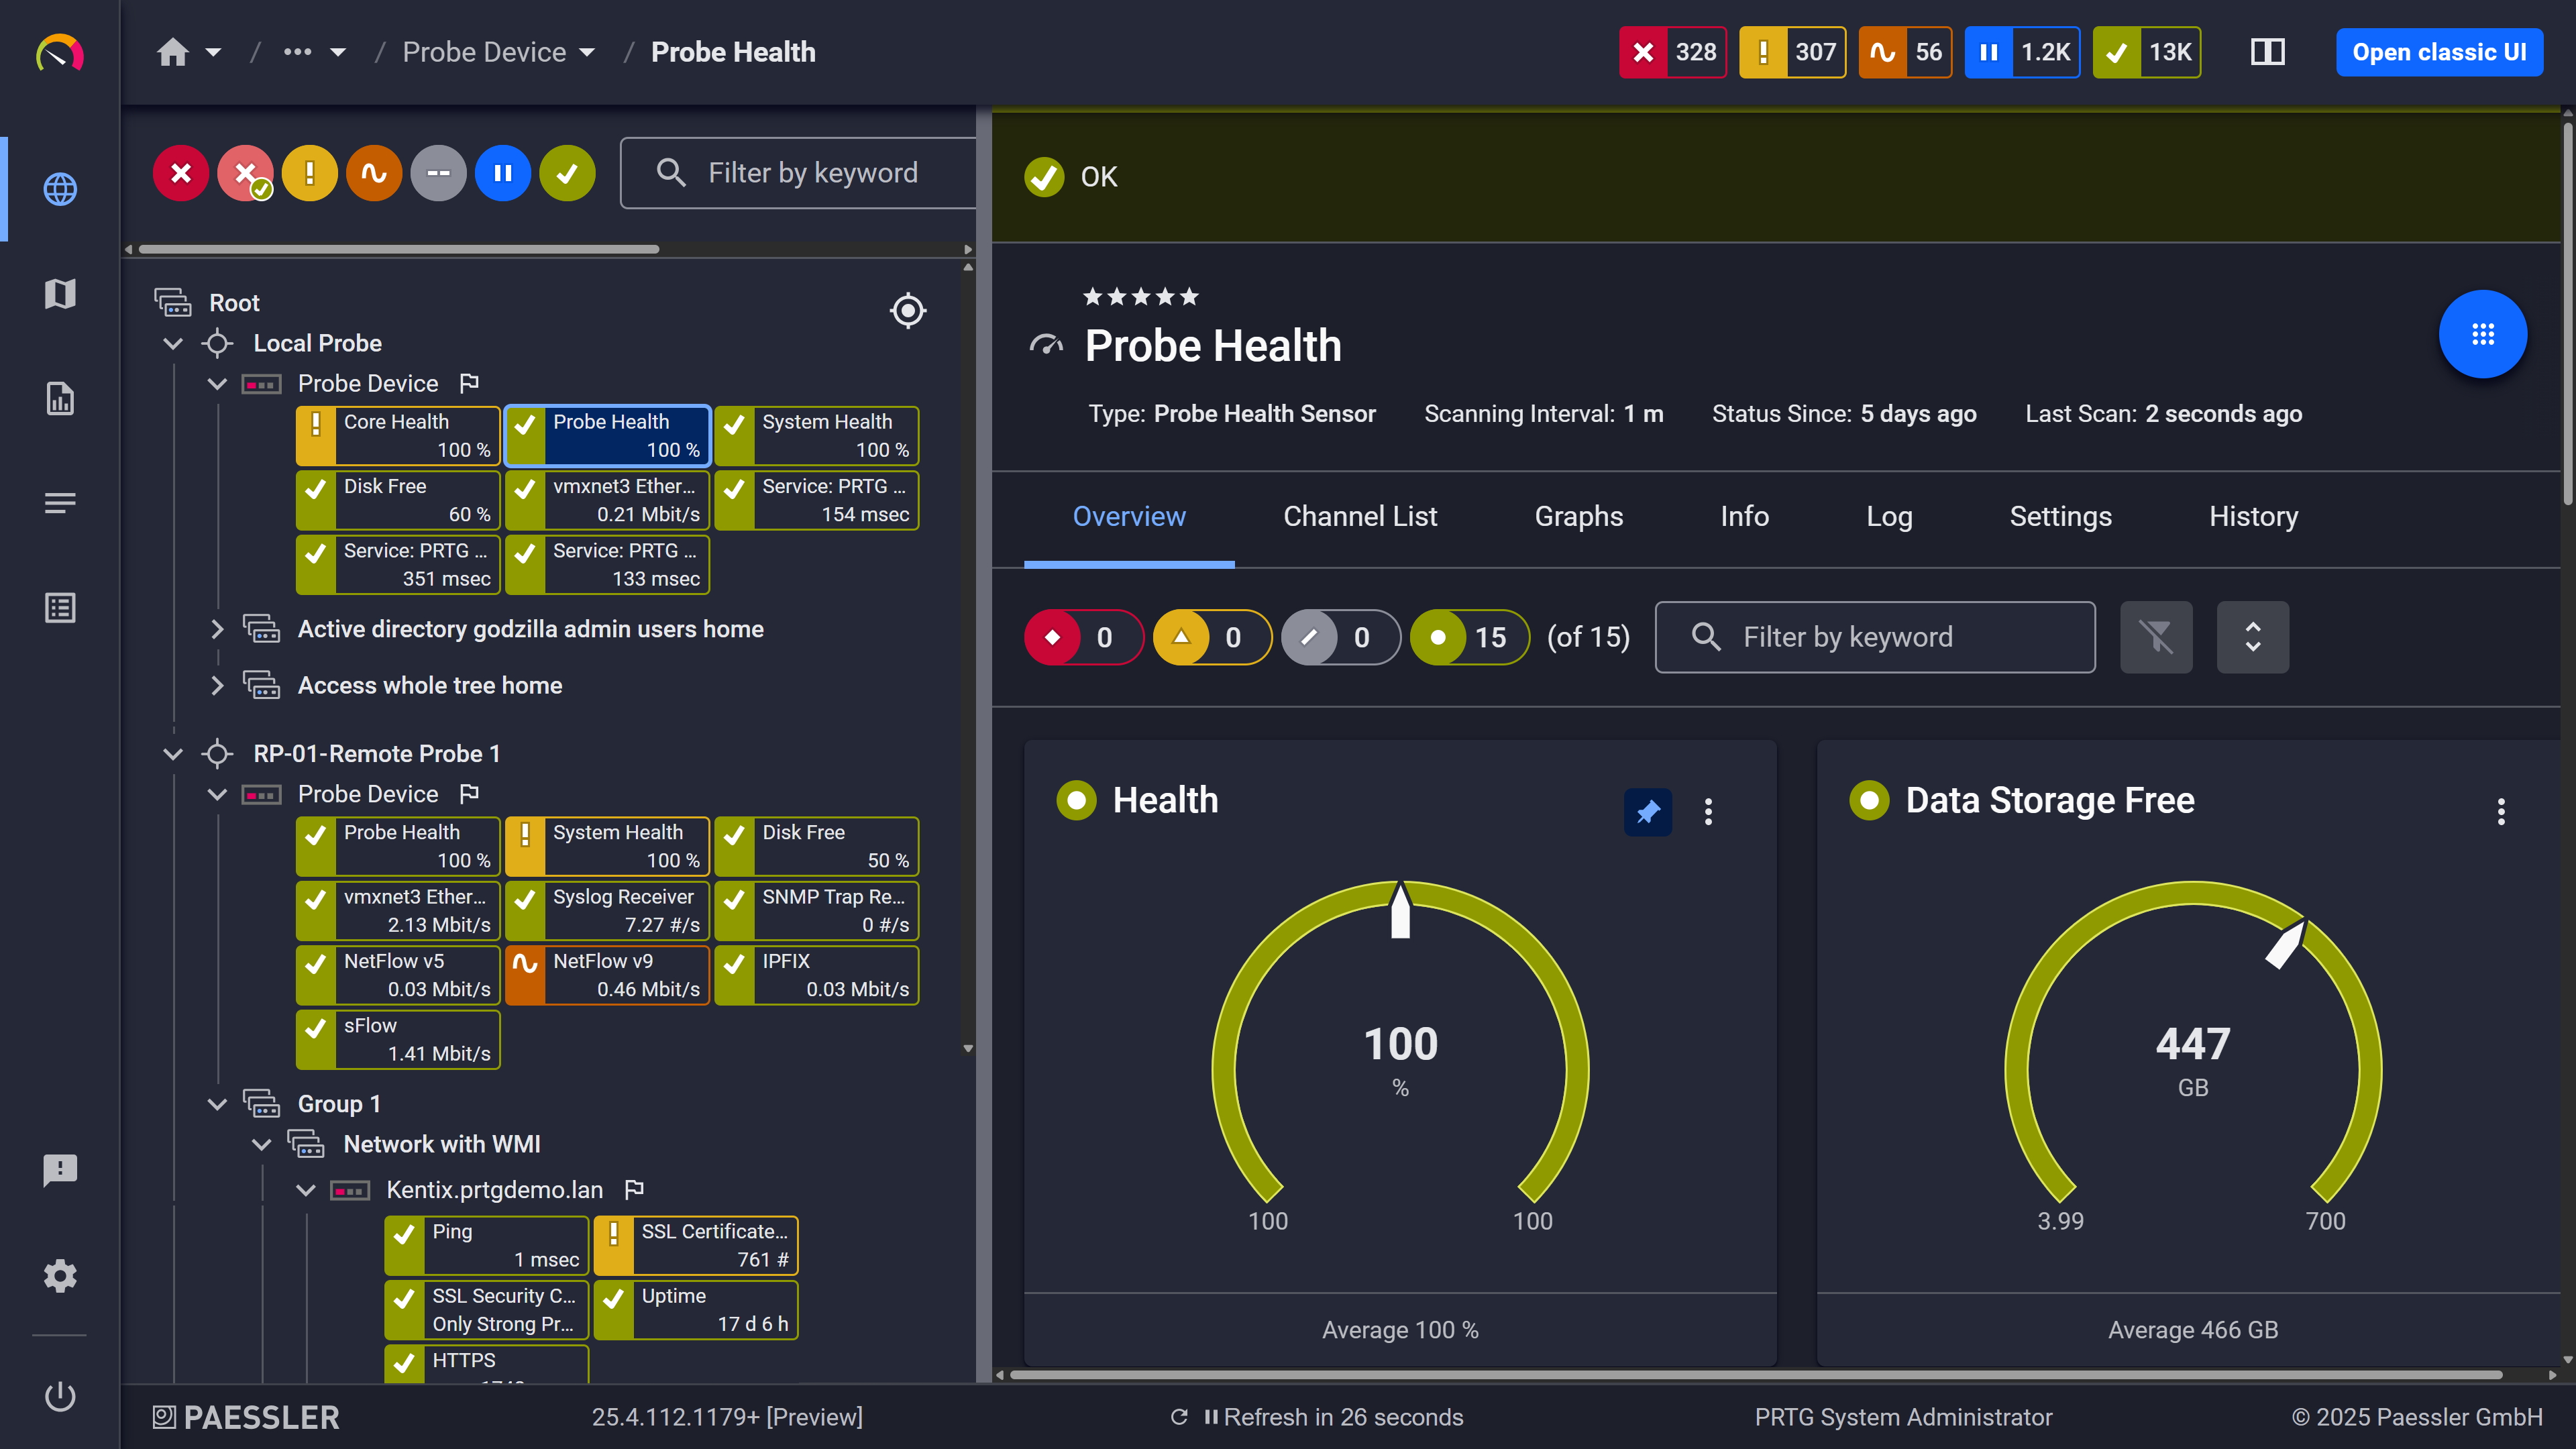
Probe health at a glance

Continuous Visibility Across All Devices 

Continuous polling captures every value a device reports over time. Each reading is stored, evaluated against your thresholds, and available as historical trend data. SNMP sensors in PRTG poll on a schedule you set (minimum every 60 seconds) and evaluate each returned value against upper and lower thresholds you define. When a value goes out of range, PRTG sends a notification via email, SMS, push, or webhook. All data is stored as historical trend graphs, so you can see exactly what a device was doing before a problem showed up. Dashboards give you a live view across all monitored devices.  

  • Polling intervals are set per sensor. Minimum is 60 seconds.
  • Set upper and lower thresholds per OID channel. PRTG alerts when either is breached.
  • Notifications go out via email, SMS, push, or webhook. Configurable per alert type.
  • Historical trend graphs per sensor, covering hours, days, or weeks depending on your retention settings
  • Dashboards show live sensor status across all monitored SNMP devices

See Why IT Professionals Trust PRTG

Start monitoring your infrastructure in minutes. No professional services, no complex configuration, no risk.

Free download
PRODUCT OVERVIEW

Full SNMPv3 Support Built In 

SNMPv3 support is common on paper. PRTG makes configuration straightforward: authentication protocol, encryption protocol, and credentials are set once at the device level, and every sensor inherits them. It supports SNMPv1, SNMPv2c, and SNMPv3 across all SNMP sensor types. SNMPv3 is configured at the device level: authentication protocol (MD5, SHA, and SHA variants), privacy/encryption protocol (DES, AES, and AES variants), and credentials. Every sensor on that device inherits those settings automatically. Mixed environments, where some devices run v2c and others require v3, are handled within the same PRTG installation. PRTG's own documentation flags v1 and v2c as unencrypted and unsuitable for unsecured networks. Use v3 where your security policies require it.  

  • Full SNMPv1, SNMPv2c, and SNMPv3 support across all SNMP sensor types 
  • SNMPv3 uses USM. Authentication options: MD5, SHA, and SHA variants. Encryption: DES, AES, and AES variants. 
  • SNMP version and credentials are set once at the device level. All child sensors inherit them. 
  • Mixed environments work fine. Devices running v2c and v3 coexist in the same PRTG installation without issue. 
  • PRTG's documentation flags v1 and v2c as unencrypted. For public or unsecured network segments, v3 is the explicit recommendation. 
PRTG web interface showing live performance graphs for a Probe Health sensor

Live graphs, real-time performance data

PRTG reports list showing scheduled monitoring reports with run times and sensor counts

Scheduled reports, always on time

PRTG tickets list showing system notifications, report completions, and update alerts

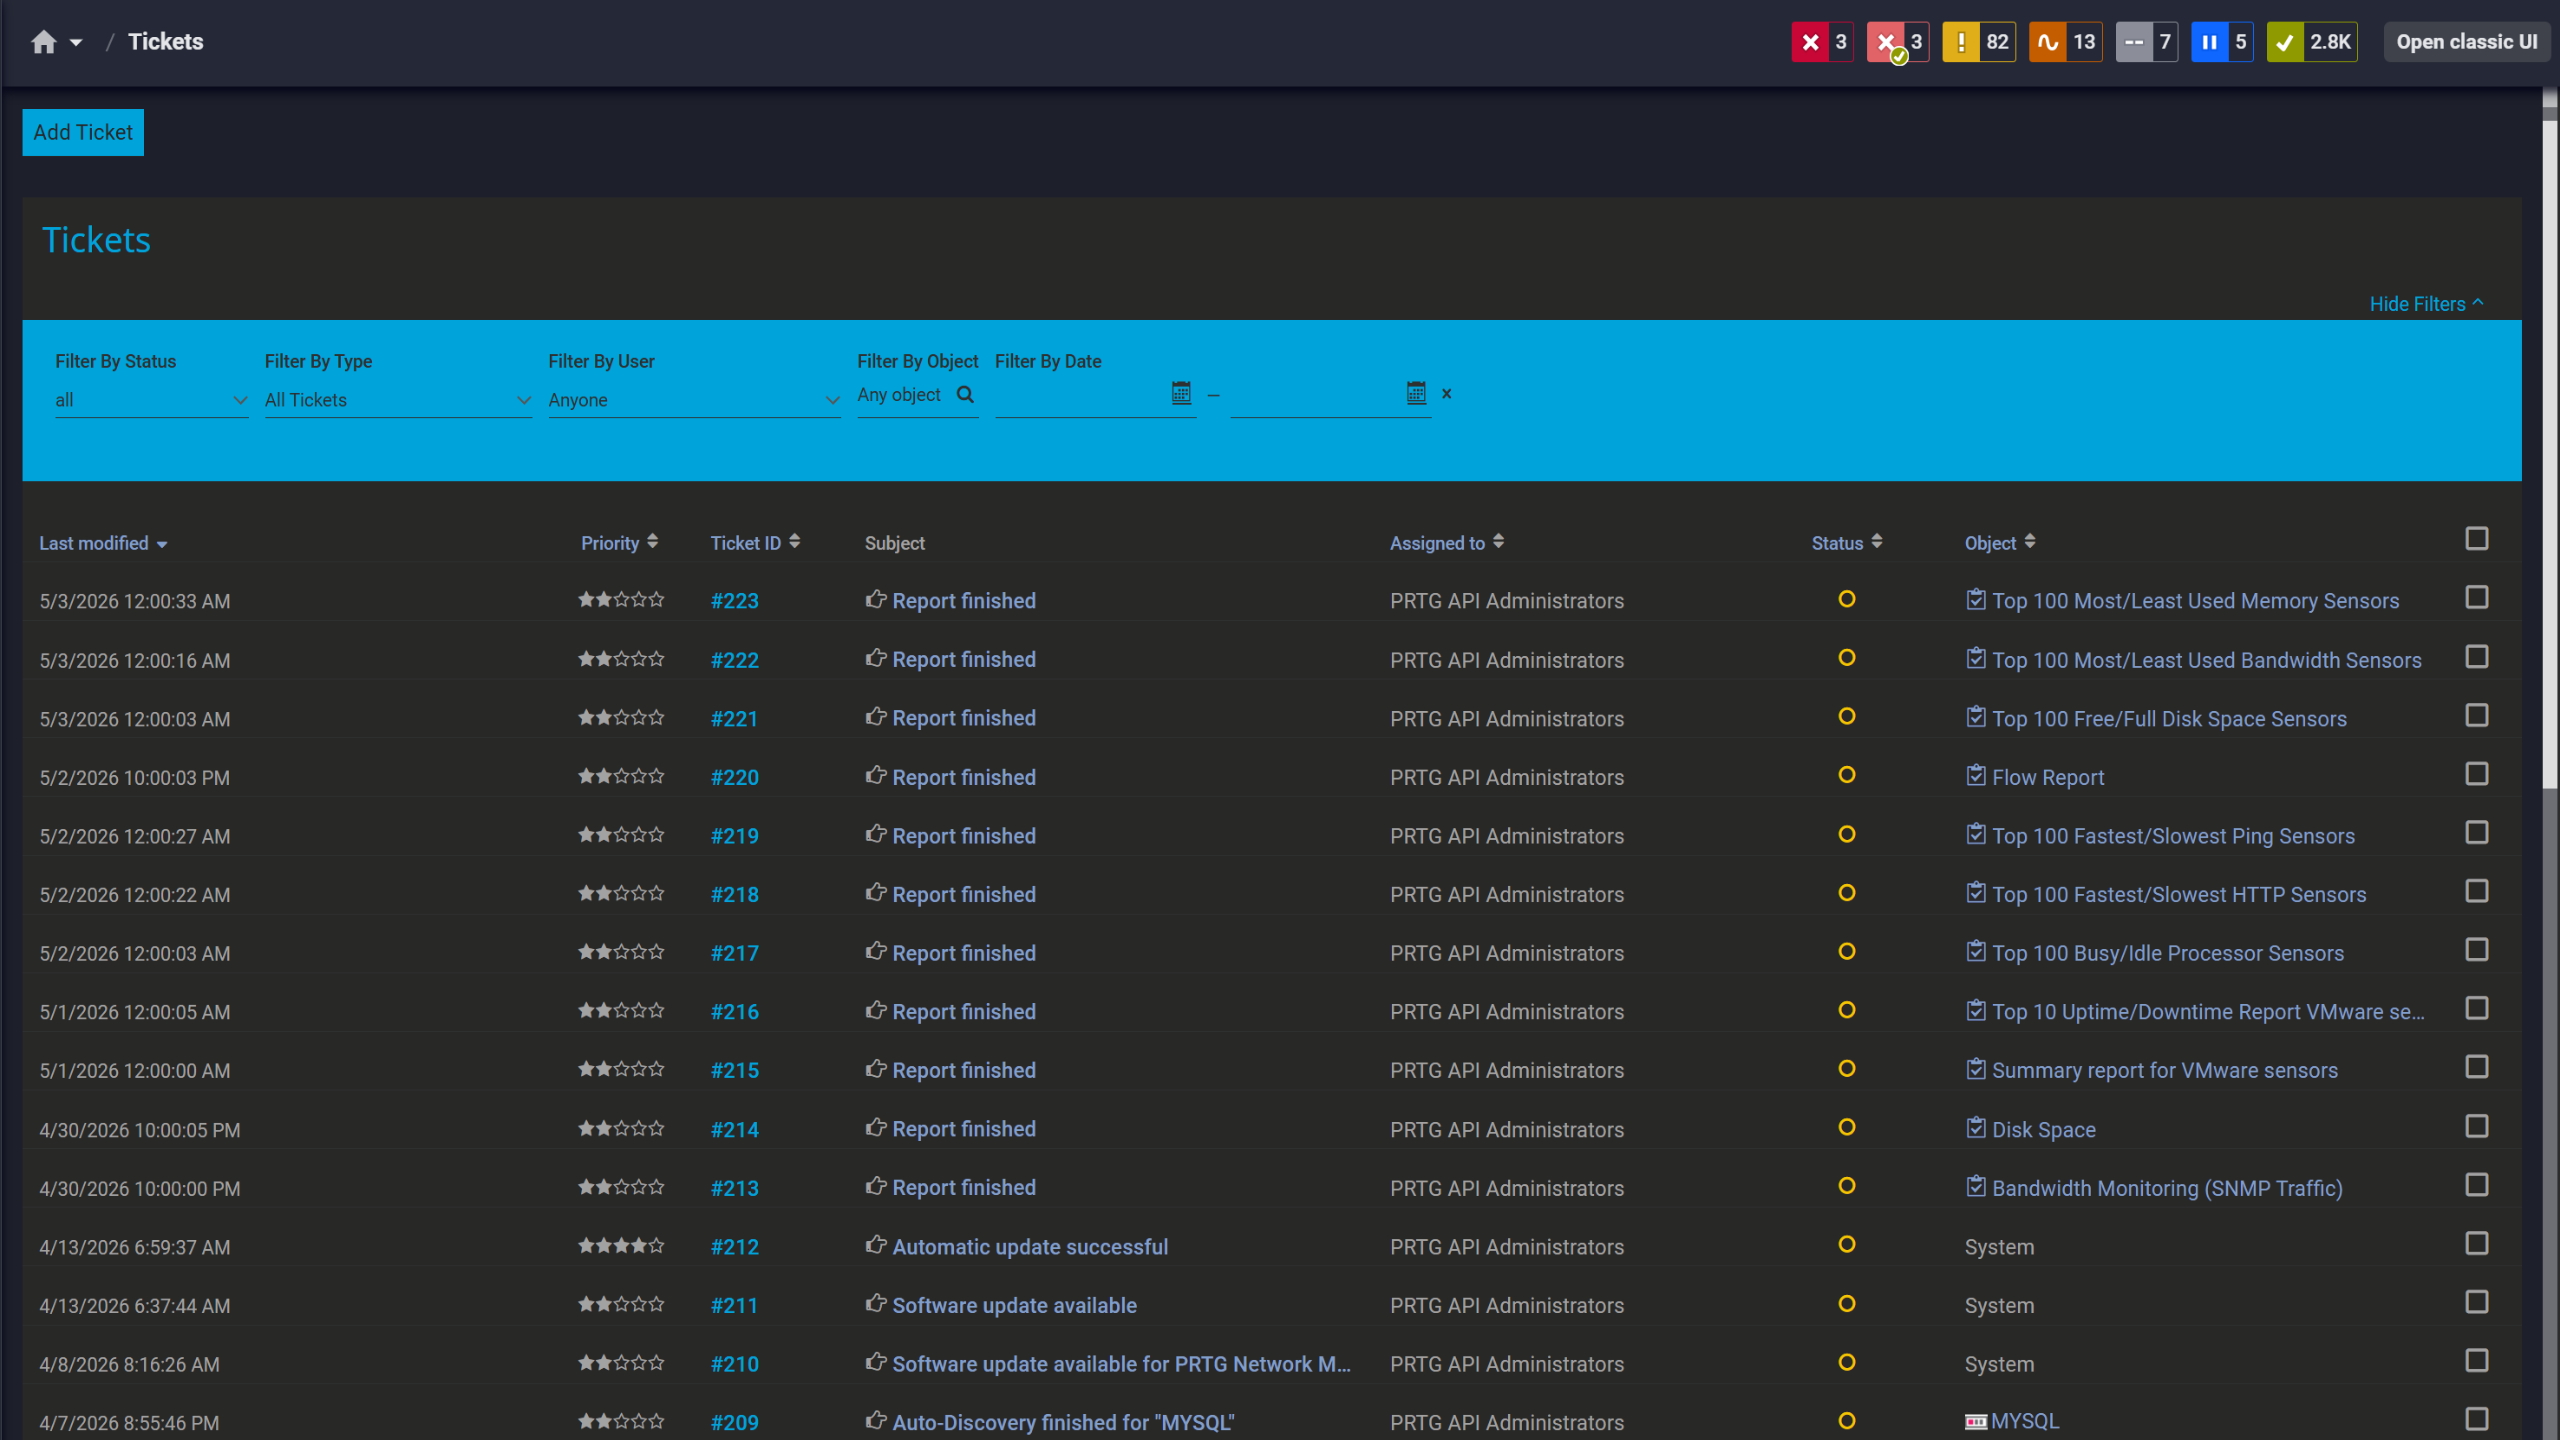
Tickets keep your team aligned

How PRTG Monitors SNMP Devices via MIB Files  

The tabs below introduce you to the technical mechanics: how the MIB Importer converts files, which SNMP sensor type fits which scenario, and how trap monitoring and auto-discovery work alongside the import workflow. 

MIB File Conversion 

The Paessler MIB Importer is a free, standalone Windows application that reads standard and vendor-specific MIB files, parses the MIB tree, and converts them, selectively or in full, to .oidlib format. The .oidlib file maps each OID to a human-readable name and data type, which is what PRTG's SNMP sensors read when creating channels.  
If the .oidlib includes lookup tables, you can define custom sensor states per returned value, useful for mapping numeric status codes to meaningful labels. One important distinction: the MIB Importer is a file conversion tool, not an interactive SNMP query tool. It doesn't perform live GET or WALK operations against devices. It reads MIB files and outputs .oidlib files

Sensor Type Selection 

PRTG includes four sensor types for MIB-based SNMP monitoring, each suited to a different scope. SNMP Custom monitors a single specific OID value. SNMP Custom Advanced monitors up to 10 OIDs per sensor, which is useful for grouping related metrics on a device. SNMP Library uses an imported .oidlib file and exposes all OIDs it defines as selectable channels. For broad per-device coverage, this is usually the right starting point. SNMP Custom Table monitors table-structured MIB data and creates one sensor per table entry. Interface tables are the common use case.

Trap Handling

The SNMP Trap Receiver sensor listens for inbound trap messages from SNMP agents. Unlike polled sensors where PRTG initiates the request on a schedule, traps are pushed by the device when a condition is met on its end. PRTG receives the trap, logs it, and can trigger alerts based on its content. When a MIB file has been imported and configured for trap use, PRTG uses it to translate the numeric OIDs in received traps into the human-readable names defined by that MIB. No manual OID lookup needed.

Auto-Discovery

PRTG's auto-discovery scans a defined IP range and creates sensors automatically for recognized device types using built-in device templates: routers, switches, firewalls, servers, and others. For devices not covered by a built-in template (niche vendor appliances, custom hardware, older equipment), sensors created from imported MIBs are added manually. Either way, you end up with the same result: sensors polling on a schedule, alerting on threshold breaches, and a full data history. Auto-discovery can run on demand or on a schedule and is scoped to specific subnets. 

free downLoad

MIB-Based SNMP Monitoring: With PRTG vs. Without PRTG

FEATURE

Without PRTG

Without PRTG

With PRTG

With PRTG

MIB file import and OID browsing

Without PRTG
not included

Tools like iReasoning MIB Browser or ManageEngine handle this, but the process ends at identifying the OID. No path to monitoring from the same tool.

With PRTG
included

The .oidlib from the MIB Importer feeds directly into PRTG sensor creation. No tool-switching required.

Continuous SNMP polling

Without PRTG
not included

Query-on-demand only. The device is invisible between active sessions.

With PRTG
included

PRTG polls each sensor on a configurable schedule and logs every value.

Threshold alerting

Without PRTG
not included

Not available. Catching a problem requires someone actively reviewing query results.

With PRTG
included

PRTG alerts via email, SMS, or push notification the moment it detects a threshold breach.

Historical data and trend graphs

Without PRTG
not included

No data retention. Past values are gone once the session ends.

With PRTG
included

All sensor data stored as historical trend graphs, available for post-incident review and capacity planning.

Multi-device dashboards

Without PRTG
not included

Single-device tools. Visibility across many devices means separate queries each time.

With PRTG
included

All monitored devices aggregated into dashboards showing full environment status.

free downLoad

“The reactivity, know-how, and technical solutions of Paessler are outstanding in every situation. For me, no monitoring tool compares to PRTG.”

Andreas Reimann, Senior Networking Communication Architect
Zurich Airport

“We want to include the tool in our set of solutions in order to solve problems more proactively in our technology infrastructure. PRTG has exceeded all our expectations because it is a reliable, extremely easy-to-use solution. There is no doubt that it lives up to the renowned quality of German technology.”

Esbin Saúl Lázaro García, IT Infrastructure and Security Engineer
Hospital El Pilar

“We strive to equip our systems with state-of-the-art technology to safeguard our educational practices for the future. Part of this includes ensuring that all our systems run smoothly at all times. On any given day, we rarely have time to keep an eye on all our systems. We therefore decided to monitor our school’s IT environment with a centralized network monitoring tool.”

Stefan Roschewitz, IT administrator
BBS Holzminden

Paessler PRTG Network Monitor licenses & pricing

Choose the PRTG Network Monitor subscription that's best for you.

License NameLicense descriptionPriceLicense DetailsGet startedPricing Details
PRTG 500$200per month paid annuallyBuy nowBuy now

Enough to monitor multiple aspects of 50 devices

PRTG 1000$358per month paid annuallyBuy nowBuy now

Enough to monitor multiple aspects of 100 devices

PRTG 2500$742per month paid annuallyBuy nowBuy now

Enough to monitor multiple aspects of 250 devices

PRTG 5000$1,300per month paid annuallyBuy nowBuy now

Enough to monitor multiple aspects of 500 devices

PRTG 10000$1,642per month paid annuallyBuy nowBuy now

Enough to monitor multiple aspects of 1000 devices

Over 100,000 Customers Worldwide Love Paessler  

customer success stories

 MIB Browser and SNMP Monitoring with PRTG: Frequently Asked Questions


What is the Paessler MIB Importer, and how does it differ from PRTG?

The Paessler MIB Importer and PRTG are two separate products built to work together. The MIB Importer is a free Windows application that reads MIB files, lets you navigate the MIB tree via a GUI, and converts OIDs to .oidlib format. It doesn't monitor anything on its own. PRTG is the monitoring platform that uses the .oidlib output to create sensors that poll devices, store data, and send alerts. Download and run the MIB Importer independently. It feeds into PRTG's sensor setup.

Which SNMP versions does PRTG support, and when should I use SNMPv3?

PRTG supports SNMPv1, SNMPv2c, and SNMPv3. SNMPv1 and SNMPv2c use community strings for authentication and transmit data in plain text. PRTG's own documentation notes these are not suitable for unsecured networks. SNMPv3 uses the User-based Security Model (USM) with configurable authentication (MD5, SHA, and SHA variants) and encryption (DES, AES, and AES variants). If your security policies restrict unencrypted protocols, or if devices are monitored across an untrusted network segment, use SNMPv3. SNMP version and credentials are configured at the device level. All sensors on that device inherit the settings.

What's the difference between SNMP GET, GETNEXT, GETBULK, and SNMP Walk, and which does PRTG use?

GET retrieves the value of a specific OID. GETNEXT retrieves the next OID in the MIB tree, which is the basis of SNMP Walk: it traverses a subtree by repeatedly issuing GETNEXT requests. GETBULK is the SNMPv2 and v3 equivalent and retrieves multiple OIDs in a single request, which is more efficient for bulk data collection. PRTG uses GET and GETBULK internally for sensor polling and doesn't expose GETNEXT or SNMP Walk as user-facing operations. The MIB Importer is not a live query tool. It works with MIB files only and doesn't perform any SNMP operations against devices.

Does PRTG work on Linux or macOS?

No. Both the PRTG core server and the MIB Importer require Windows. Neither runs natively on Linux or macOS. Remote probes can run on Linux for distributed setups, but the core server still needs to be Windows-based. No component of the PRTG stack supports macOS.

What are SNMP Traps, and how does PRTG handle them?

With standard SNMP polling, PRTG initiates a request to the device on a schedule and retrieves the current value. SNMP traps work the other way: the device sends a message to the trap receiver when a specific condition is met on its end, without being asked. PRTG includes an SNMP Trap Receiver sensor that listens for these inbound messages, logs them, and can trigger alerts based on their content. When a MIB file has been imported and configured for trap use, PRTG translates the numeric OIDs in received traps into the human-readable names from the MIB. Readable without manual lookup.

How does PRTG compare to iReasoning MIB Browser or ManageEngine's free MIB browser?

iReasoning MIB Browser and ManageEngine's free MIB browser are interactive SNMP query tools: load a MIB, connect to a device, issue GET or Walk operations, see the results. They're useful for troubleshooting, OID discovery, and ad-hoc inspection, but the session ends there. PRTG handles the ongoing side: sensors polling on a schedule, threshold alerting, historical trend graphs, and dashboards across all devices. Both tool types are often used alongside each other. A free MIB browser for exploration and validation, PRTG for monitoring. Pricing is based on sensor count. A free tier is available for you to check out the product before commiting. See the pricing page for current details.

Does PRTG have an API for accessing SNMP monitoring data?

Yes. PRTG includes a REST-based API that lets you retrieve sensor data, status information, and historical values programmatically. Useful for integrating PRTG data into external systems, building custom dashboards, or automating sensor management. For MSPs managing multiple client environments, the API supports workflows like automated reporting, sensor provisioning, and integration with ticketing or service management tools.

Paessler PRTG

Paessler PRTG

Network Monitoring Software – Version 26.1.116.1532 (February 9th, 2026)

Hosting icon

Hosting

Download for Windows and cloud-based version PRTG Hosted Monitor available

Languages icon

Languages

English, German, Spanish, French, Portuguese, Dutch, Russian, Japanese, and Simplified Chinese

test

Monitor everything

Network devices, bandwidth, servers, applications, virtual environments, remote systems, IoT, and more

test

Pricing

Choose the PRTG Network Monitor subscription that's best for you

Discover more monitoring insights and stories

Content illustration

Powerful stories from the monitoring world

  • Master MIB Browser Usage: From Import to Network Monitoring ...
  • What Is SNMP, MIBs and OIDs? – IT Explained
  • 3 Essential Cisco MIB Resources You Need to Bookmark
Support illustration

Resources to master your monitoring challenges

  • Custom OID not working
  • MIB importer parse error
  • UPS-Mib - Error 223 using table - Paessler Helpdesk
Solution illustration

Solutions for all your monitoring needs

  • MIB Browser
  • Monitoring Technologies
  • SNMP Scanner
PRTG Logo

Start Monitoring with PRTG and see how it can make your network more reliable and your job easier.

Free download
PRODUCT OVERVIEW

Products

  • Paessler PRTG
    Paessler PRTGMonitor your whole IT infrastructure
    • PRTG Network Monitor
    • PRTG Enterprise Monitor
    • PRTG Hosted Monitor
    • PRTG UVexplorer
    • PRTG extensions
      Extensions for Paessler PRTGExtend your monitoring to a new level
  • Icon Features
    FeaturesExplore all monitoring features

Monitoring with PRTG

  • Network monitoring
  • Bandwidth monitoring
  • SNMP monitoring
  • Network mapping
  • Wi-Fi monitoring
  • Server monitoring
  • Network traffic analyzer
  • NetFlow monitoring
  • Syslog server

Useful Links

  • PRTG Manual
  • Knowledge Base
  • Customer Success Stories
  • About Paessler
  • Subscribe to newsletter
  • PRTG Support
  • PRTG Consulting
  • PRTG Feedback & Roadmap

Contact

Paessler GmbH
Thurn-und-Taxis-Str. 14, 
90411 Nuremberg 
Germany

[email protected]

+49 911 93775-0

  • Contact us
©2026 Paessler GmbHTerms & ConditionsPrivacy PolicyImprintReport VulnerabilityDownload & InstallSitemap
References References References