• Company
    • About Us
    • Case Studies
    • Press Center
    • Careers
    • Blog
    • Contact us
  • Contact us
  • Login
 
  • English
    • Deutsch
    • Español
    • Français
    • Italiano
    • Português
Paessler
                    - The Monitoring Experts
  • Products
    • Paessler PRTG
      Paessler PRTGMonitor your whole IT infrastructure
      • PRTG Network Monitor
      • PRTG Enterprise Monitor
      • PRTG Hosted Monitor
      • PRTG UVexplorer
      • PRTG extensionsExtensions for Paessler PRTGExtend your monitoring to a new level
    • Icon Features
      FeaturesExplore all monitoring features
      • Maps & dashboards
      • Alerts & notifications
      • Multiple user interfaces
      • Distributed monitoring
      • Customizable reporting
  • Solutions
    • Industries
      IndustriesMonitor various industry sectors
      • Industrial
      • Healthcare
      • Data Center
      • Education
      • Finance
      • Government
    • IT Topics
      IT TopicsMonitor all areas of IT
      • Network Monitoring
      • Bandwidth Monitoring
      • SNMP Monitor
      • Network Mapping
      • WiFi Monitoring
      • Server Monitoring
  • Pricing
  • Resources
    • Getting Started
      Getting StartedModules for self-paced learning
    • How-to Guides
      How-to GuidesGet the most out of PRTG
    • Videos & Webinars
      Videos & WebinarsLearn from Paessler experts
    • IT  Knowledge
      IT KnowledgeExpand your IT knowledge
    • PRTG Manual
      PRTG ManualFull documentation
    • Knowledge Base
      Knowledge BaseShare community knowledge
    • PRTG Sensor Hub
      PRTG Sensor HubGet sensors, scripts & templates
    • Trainings
      PRTG TrainingLearn how to work with PRTG
  • Partners
    • Icon Handshake
      Become a PartnerFor resellers and channel partners
    • Icon MSP
      Become an MSPDeliver monitoring as a managed service
    • icon partner
      Partner PortalLog in to your partner account
    • Deal Registration
      Deal RegistrationRegister your sales opportunities
    • icon search
      Find a PartnerFind partners selling Paessler products
    • icon technology
      Technology AlliancesSee Paessler technology partnerships
    • Partner HubTools for Your Success
  • Company
    • About Us
    • Case Studies
    • Press Center
    • Careers
    • Blog
    • Contact us
  • Contact us
  • Login
  • English
    • Deutsch
    • Español
    • Français
    • Italiano
    • Português
  • Get a quote
  • Free trial

Automated Network Device Scanner  

Discover every device on your network automatically. Monitor them all from one place.  

Free download
PRODUCT OVERVIEW

How Do I Automatically Discover and Monitor All Devices on My Network?   

Keeping track of every device on a network is harder than it sounds. IP ranges grow, hardware gets added without documentation, and manual inventories fall behind quickly. A proper network device scanner doesn't just find what's connected - it tells you what each device is, puts it in a structured overview, and starts monitoring it.  

Paessler PRTG scans your defined IP ranges using ICMP, SNMP, and ARP, identifies each device it finds, and builds a live monitoring setup from the results automatically. When it finds a Windows machine, it sets up WMI-based monitoring. Linux and macOS devices get SSH-based sensors. Discovery runs on a schedule, so new devices appear without manual intervention.  

PRTG discovers and monitors: Windows · Linux · macOS · Routers · Switches · Firewalls · Printers · IoT devices · Wi-Fi access points · SNMP-capable network hardware from all major vendors  

Download PRTG Trial

What you will find on this page

  • Get Full Network Visibility
  • How PRTG Monitors Network Devices
  • Manual Network Scanning vs. PRTG
  • FAQs

PRTG is compatible with all major vendors, products, and systems

compatible with all major vendors, products, and systems

Full Network Visibility, Without the Manual Work

See Everything on Your Network From Day One 

Most networks have more devices than anyone's spreadsheet shows. A printer someone plugged in last month. A VM a developer spun up and never documented. These things happen, and in most environments nobody notices until something doesn’t seem right and a comprehensive list is needed.  

PRTG's auto-discovery scans your defined IP ranges and adds every device it finds to a structured monitoring setup. Each discovered device gets sensors assigned based on what PRTG detects. No manual setup. Run auto-discovery, and your network is in PRTG.  

  • No manual configuration. PRTG adds every device it finds automatically
  • The device tree is built on first run
  • Active Directory integration pulls Windows computer lists, up to 1,000 per discovery run
  • Subnets up to /16 (65,536 addresses) covered in a single run
  • Works out of the box. No scripting, no command-line

Keep Your Device Inventory Current, Automatically 

Nmap, Angry IP Scanner, and Advanced IP Scanner do their job well for point-in-time scans. Networks change constantly though, and a current device inventory needs more than a manually triggered tool. PRTG runs auto-discovery on a schedule you set: once, hourly, daily, or weekly. Every time it runs, your device inventory gets updated. New devices get picked up and added to monitoring automatically. You don't need a separate scanning tool sitting next to your monitoring platform just to keep the device list current.  

  • Schedule auto-discovery to run once, hourly, daily, or weekly
  • New devices get added automatically on the next run
  • Unknown devices appear in your device tree without any manual work
  • No separate scanning tools needed alongside your monitoring platform
  • GUI-based setup. No command-line required
PRTG web interface showing device tree and full device list with sensor status badges

Full device list, instant overview

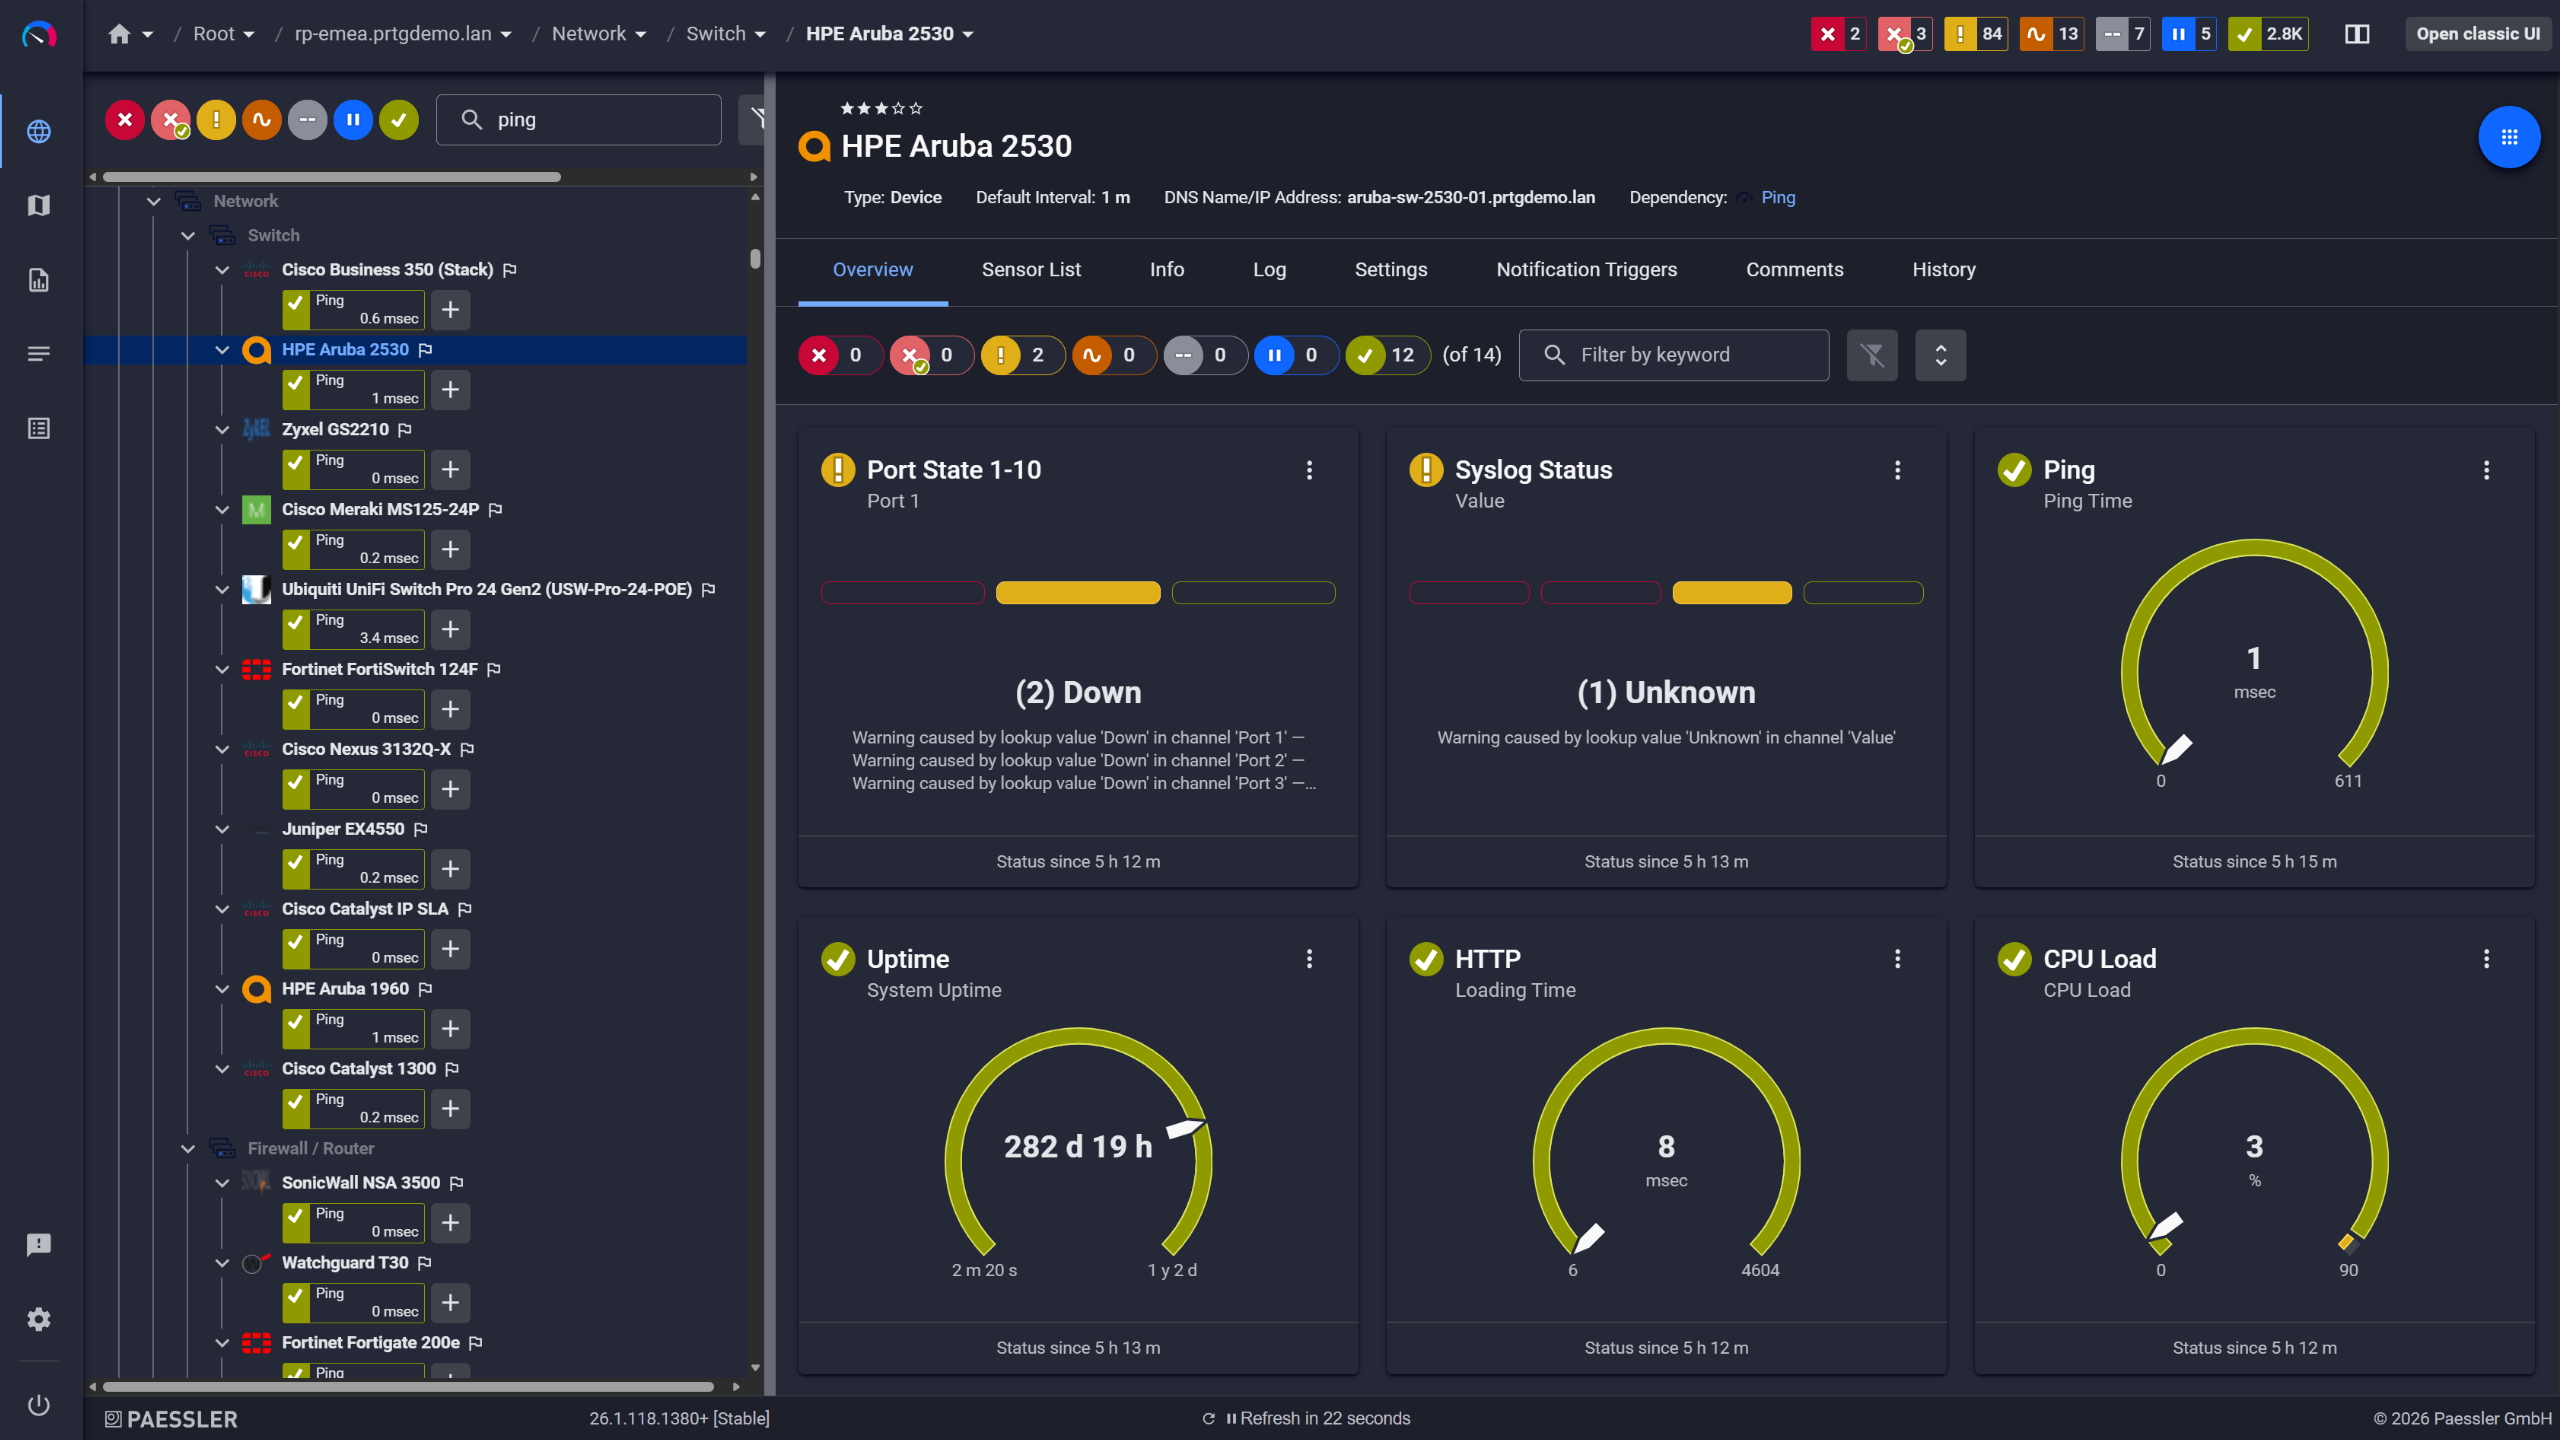
PRTG device overview for an HPE Aruba 2530 switch with port state, ping, and CPU sensors

Network switches monitored across vendors
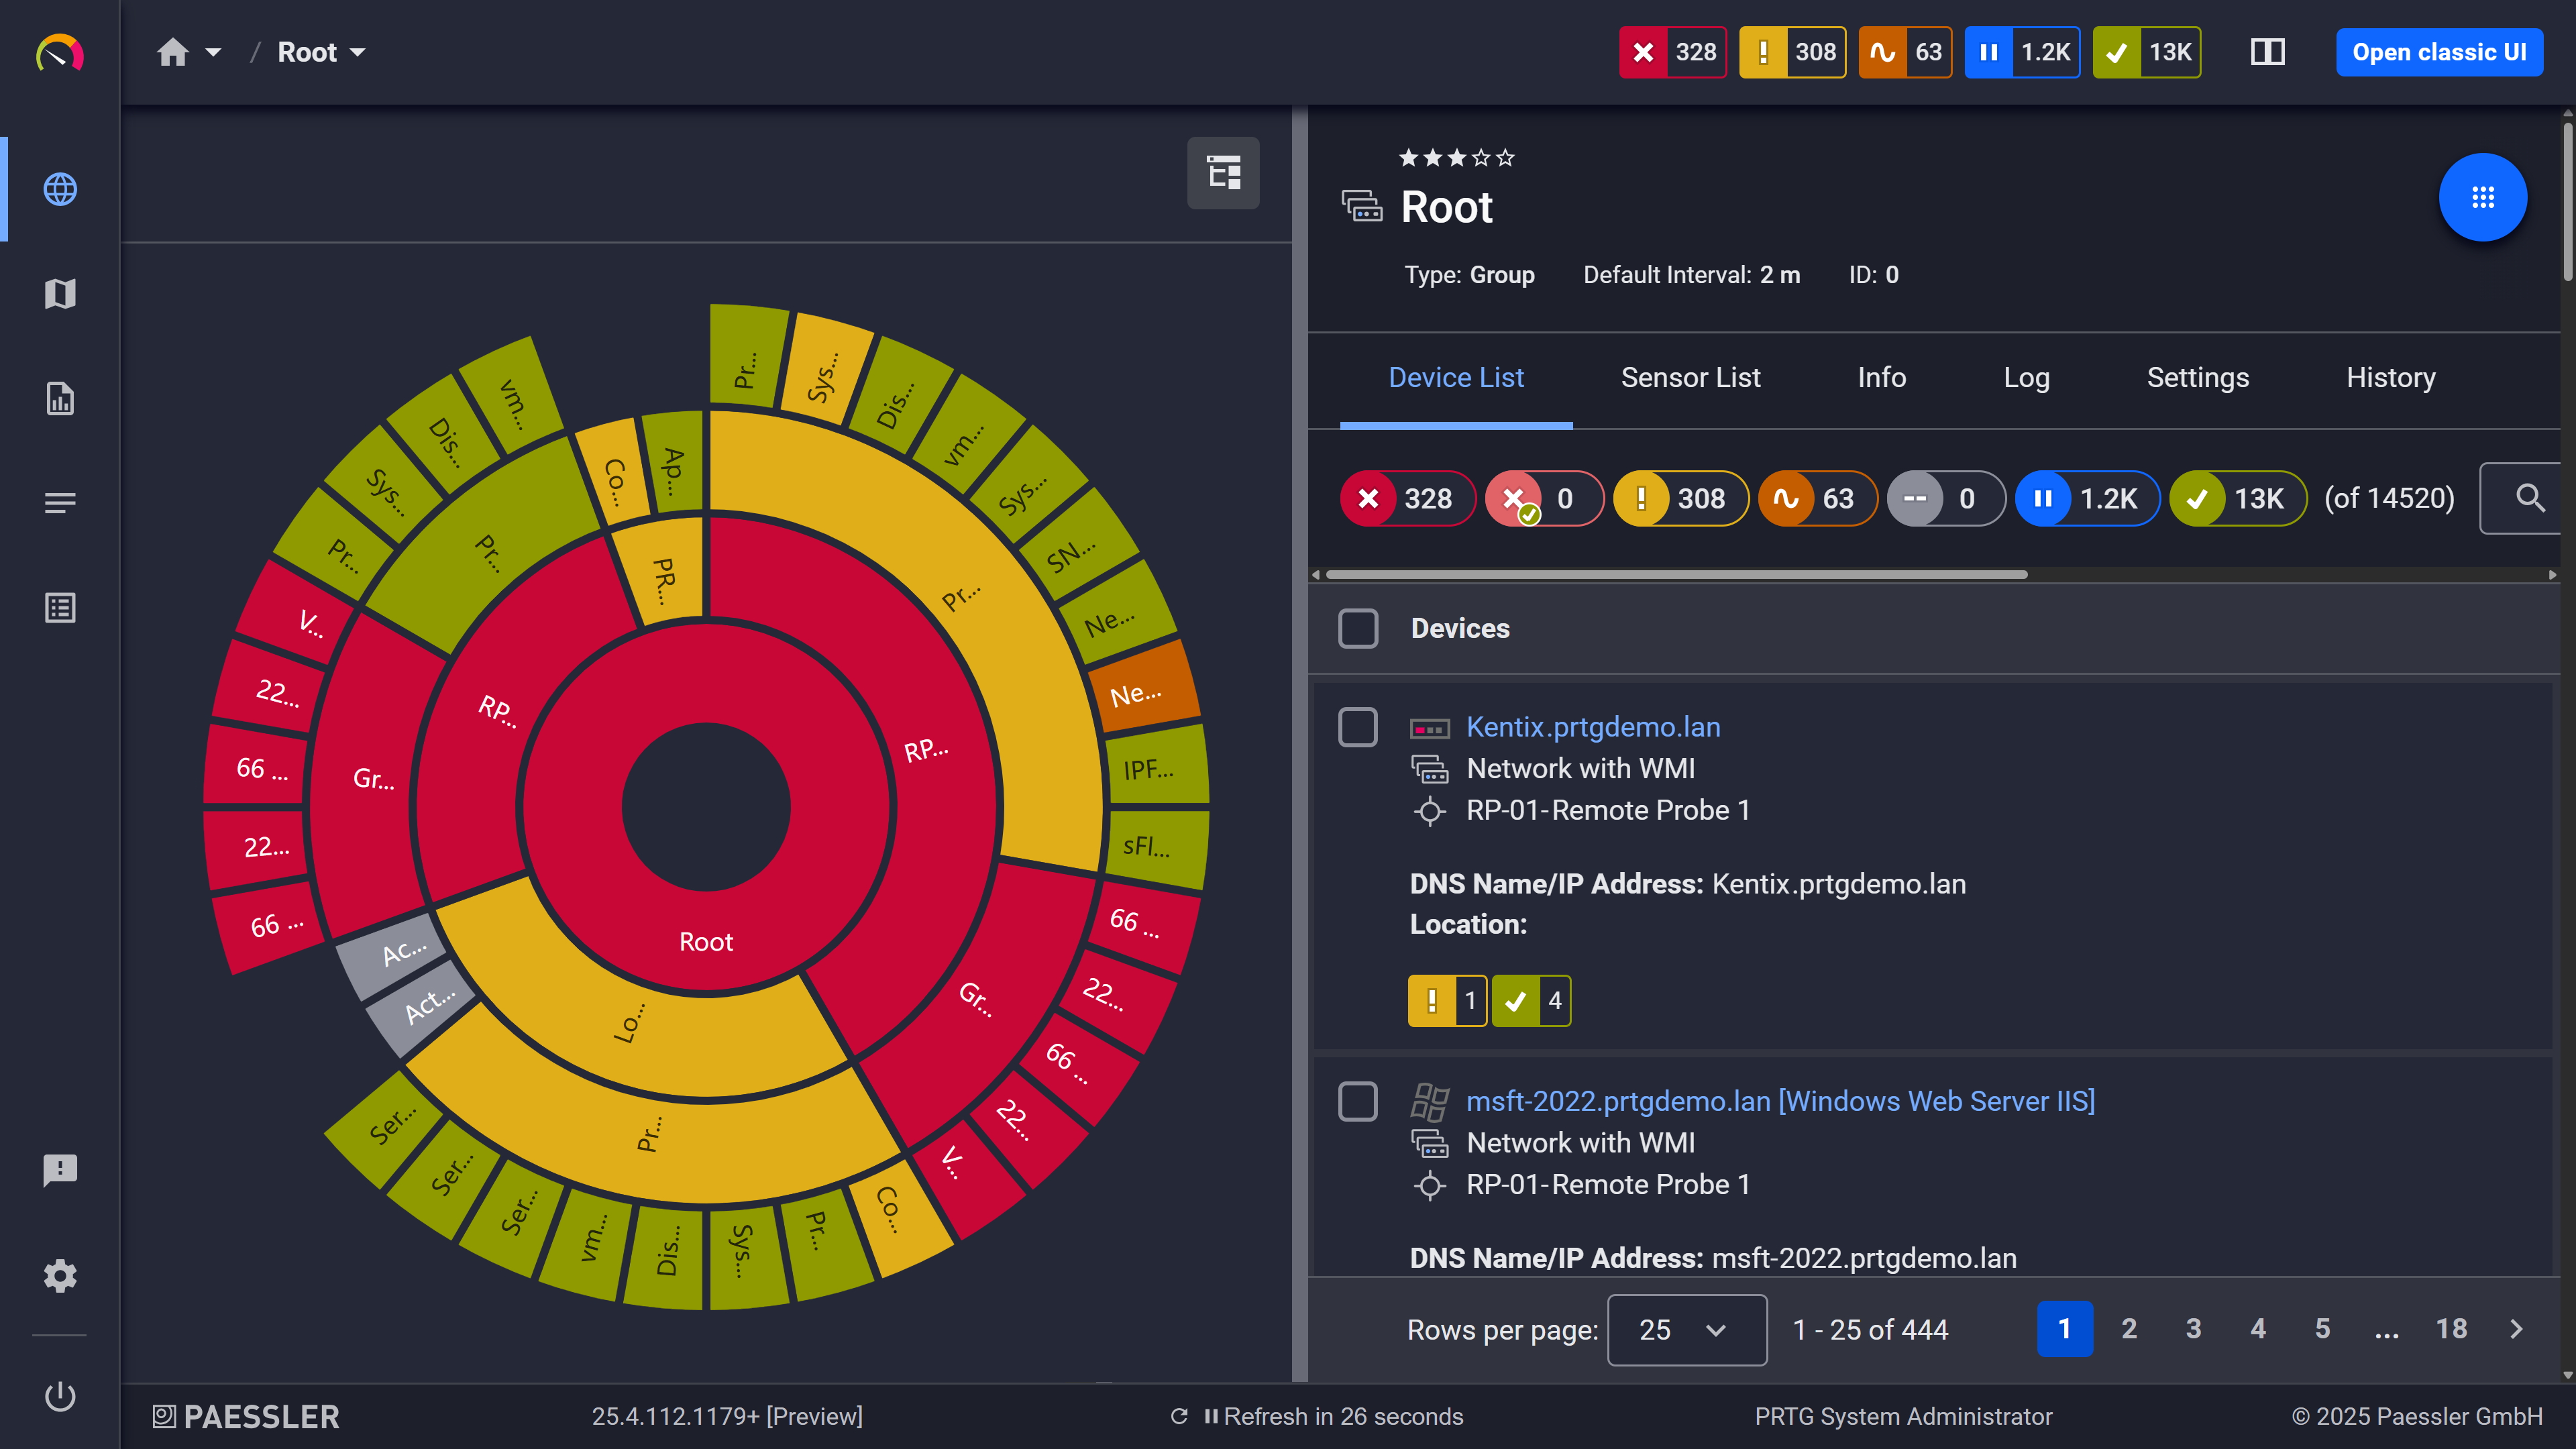
PRTG sunburst chart visualizing the full network hierarchy with color-coded sensor status

Your entire network, visualized instantly

Auto-discovery Is Just the Start

Finding a device on your network is step one. Knowing whether it's actually working is the part that matters.  

PRTG starts monitoring the moment it discovers a device. The Ping Sensor tracks uptime and availability. The SNMP Traffic Sensor picks up interface traffic. The SNMP CPU Load Sensor covers CPU load. Set a threshold, get a notification. And because PRTG stores historical data, you can look back at trends when you need to track down a recurring issue or plan for capacity.  

  • The Ping Sensor tracks uptime and availability per device from day one
  • Switch and router traffic goes through the SNMP Traffic Sensor
  • Cisco, HPE, Dell, and other major vendors are covered out of the box
  • PRTG sends a notification via email, SMS, or push when a threshold is crossed
  • Historical data is there when you need to troubleshoot or plan ahead

See Why IT Professionals Trust PRTG

Start monitoring your infrastructure in minutes. No professional services, no complex configuration, no risk.

Free download
PRODUCT OVERVIEW

Know What's Running on Every Device 

An IP address tells you a device is there. PRTG's System Information feature tells you what's actually on it.  

PRTG pulls installed software with version numbers, connected hardware components, active services, and processes for each device in your setup. Core system data covers the basics: OS version, BIOS serial number, MAC address, IP. The System, Hardware, and Software tabs update every 24 hours. Users, Services, and Processes refresh each time you open the tab. No manual checks, no stale documentation.  
  • Installed software with version numbers, per Windows device
  • Hardware components and their properties, per device
  • OS version, BIOS serial number, MAC address, and IP for each system
  • Services and processes are visible on demand
  • Everything updates on a fixed schedule. No manual work required.
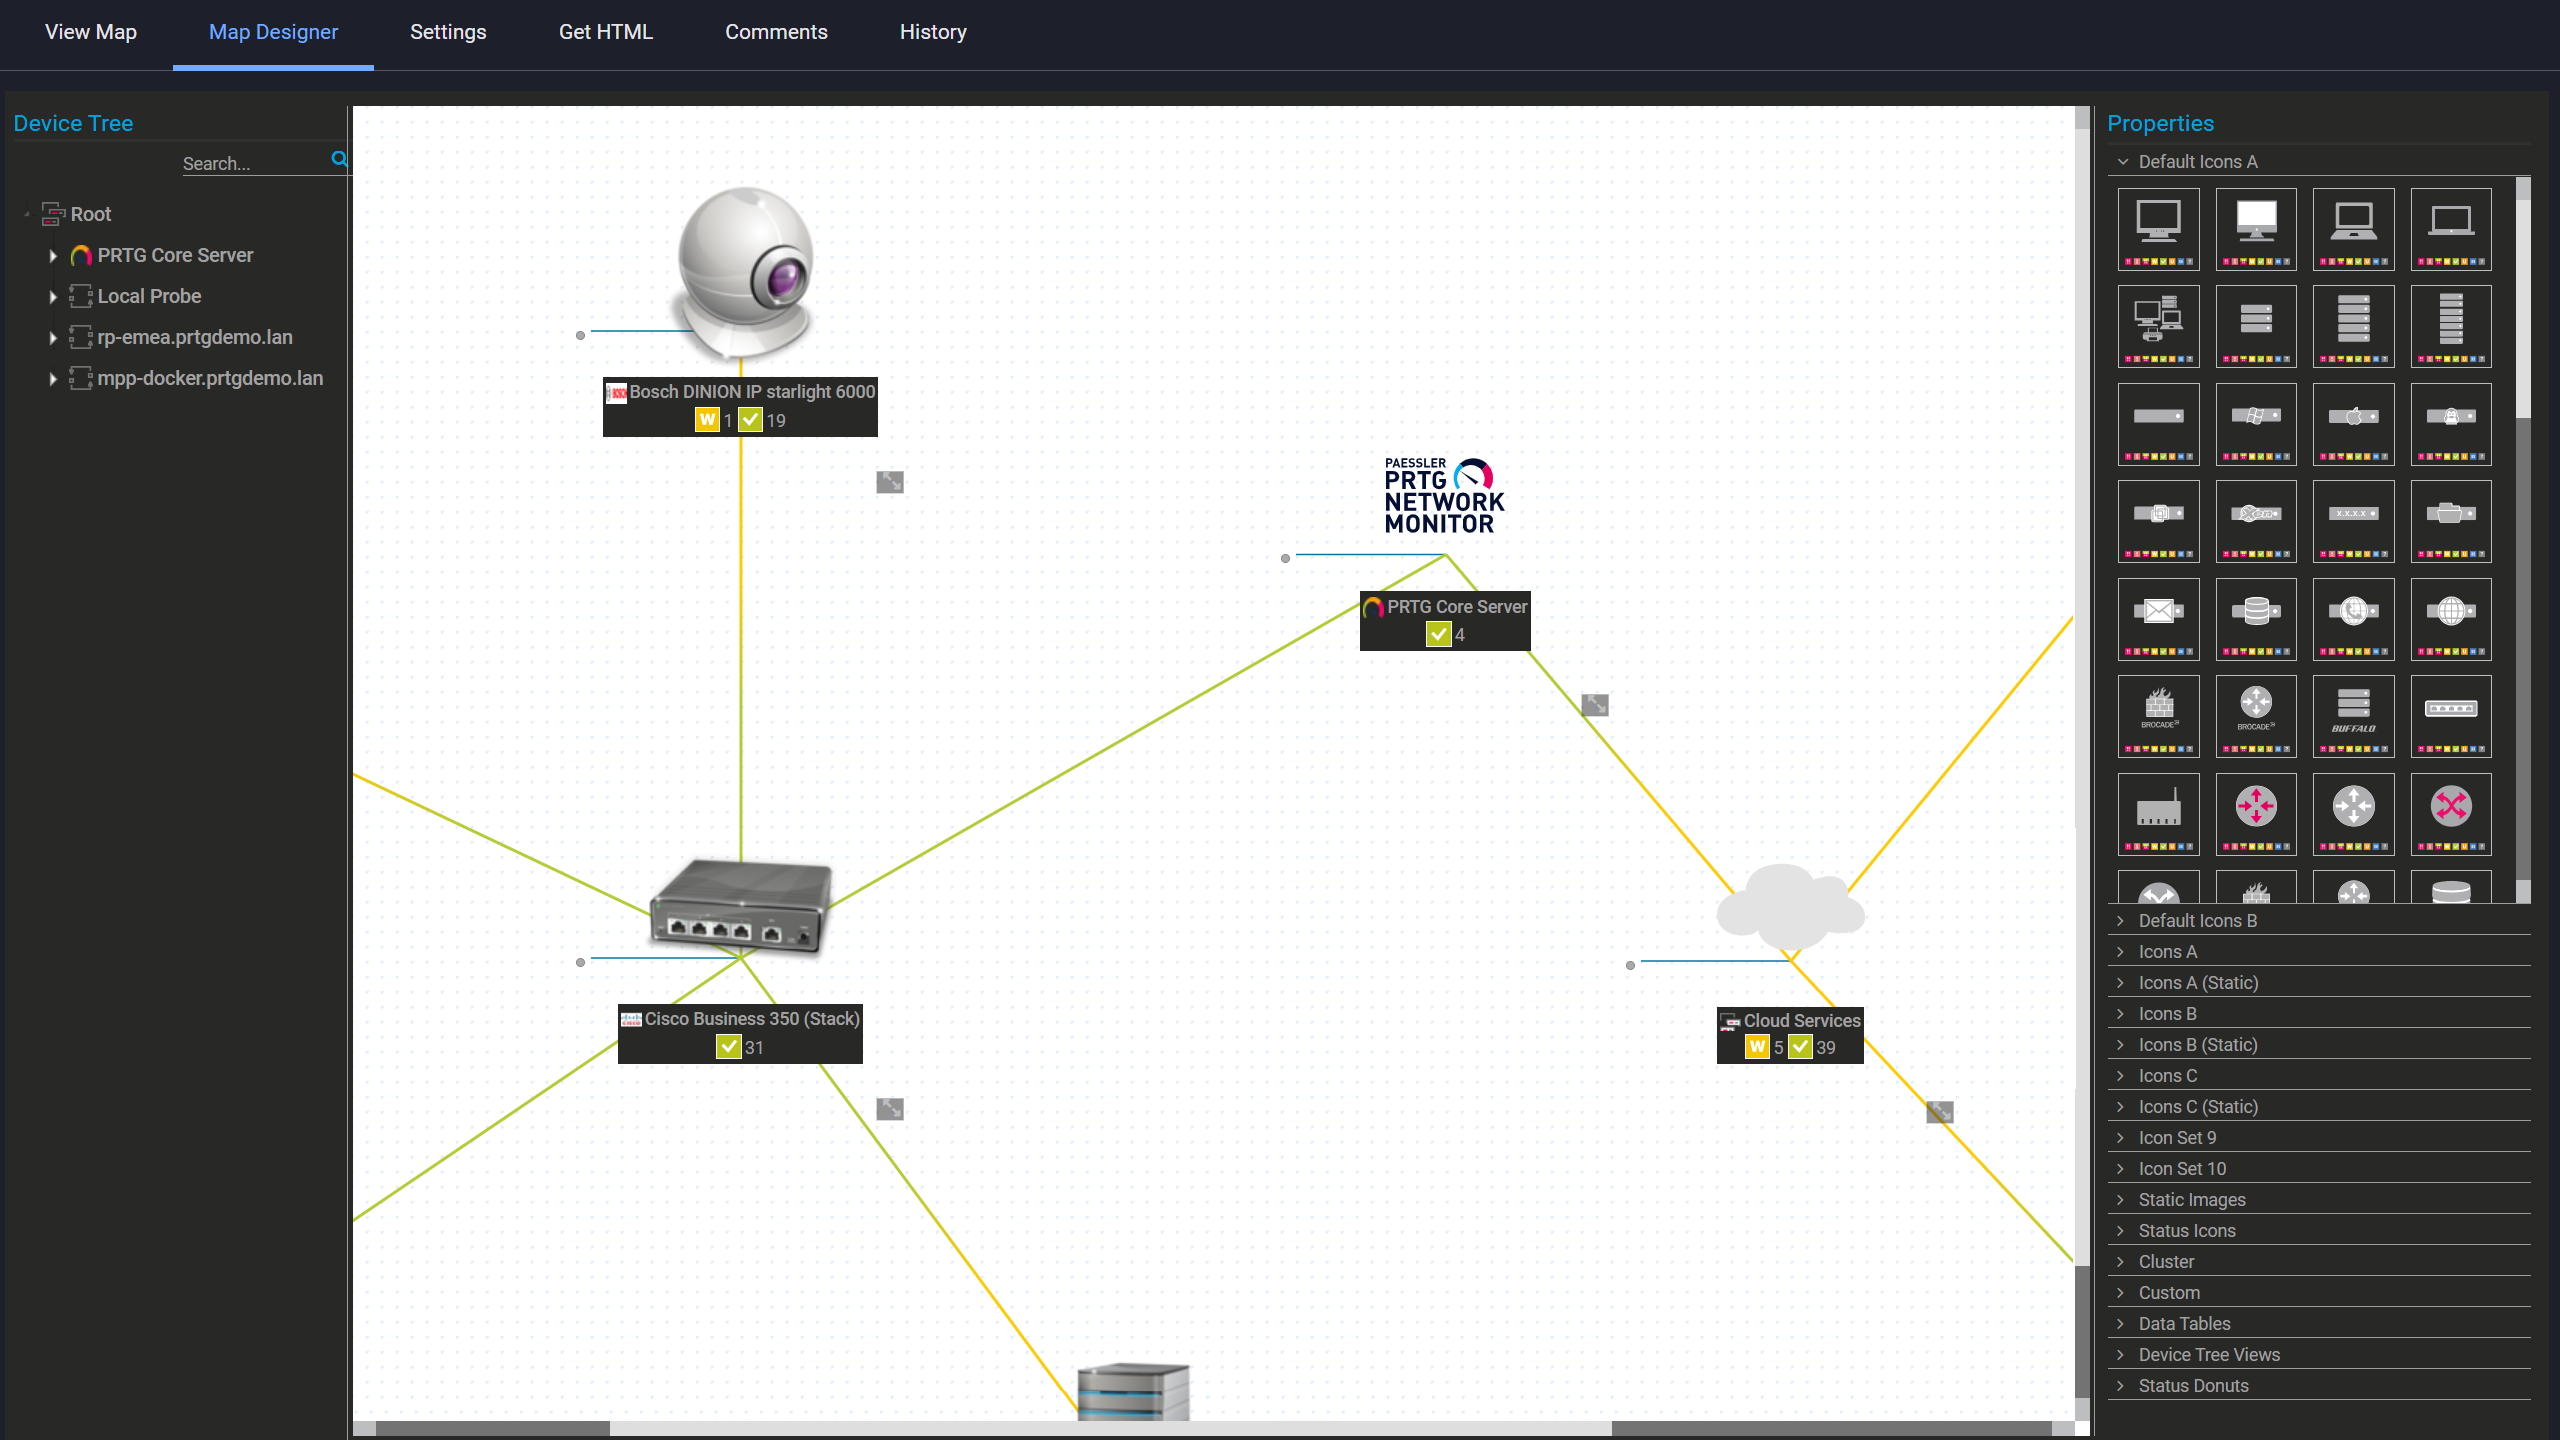
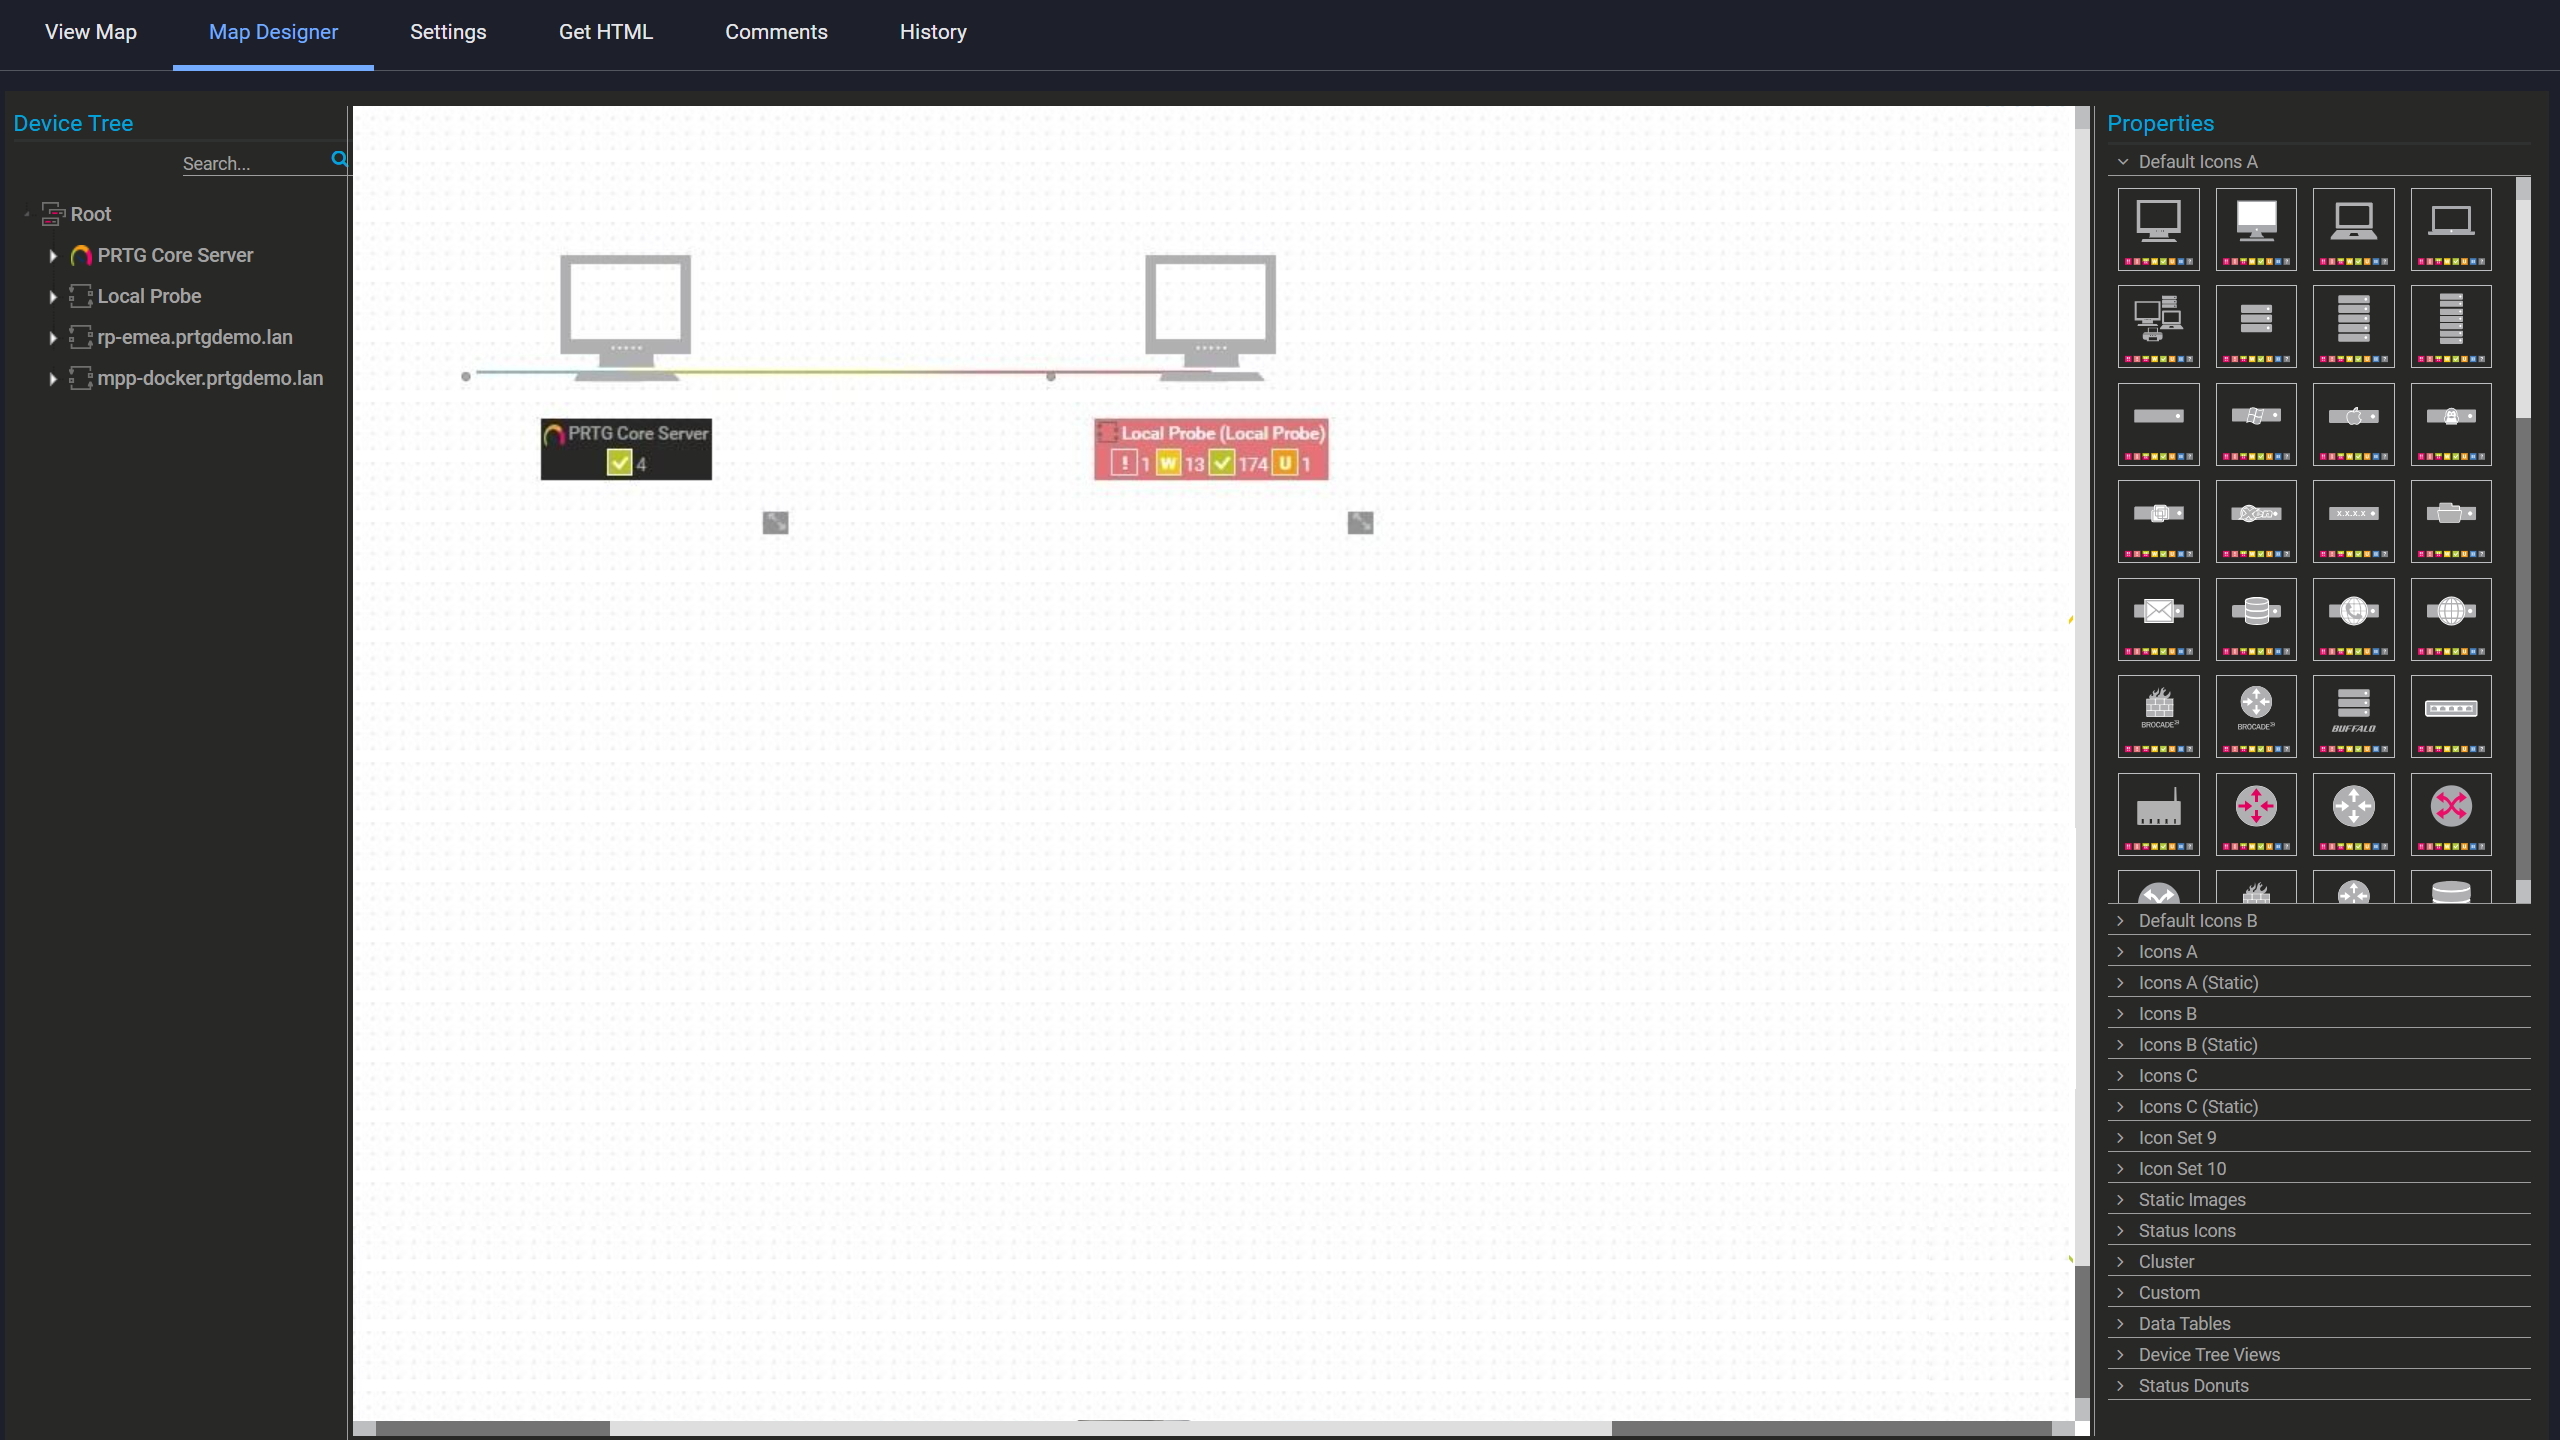
PRTG Map Designer with two network devices placed on a blank canvas

Build your own network map

PRTG Map Designer showing a custom network map with live device status and vendor icons

Custom maps with live status

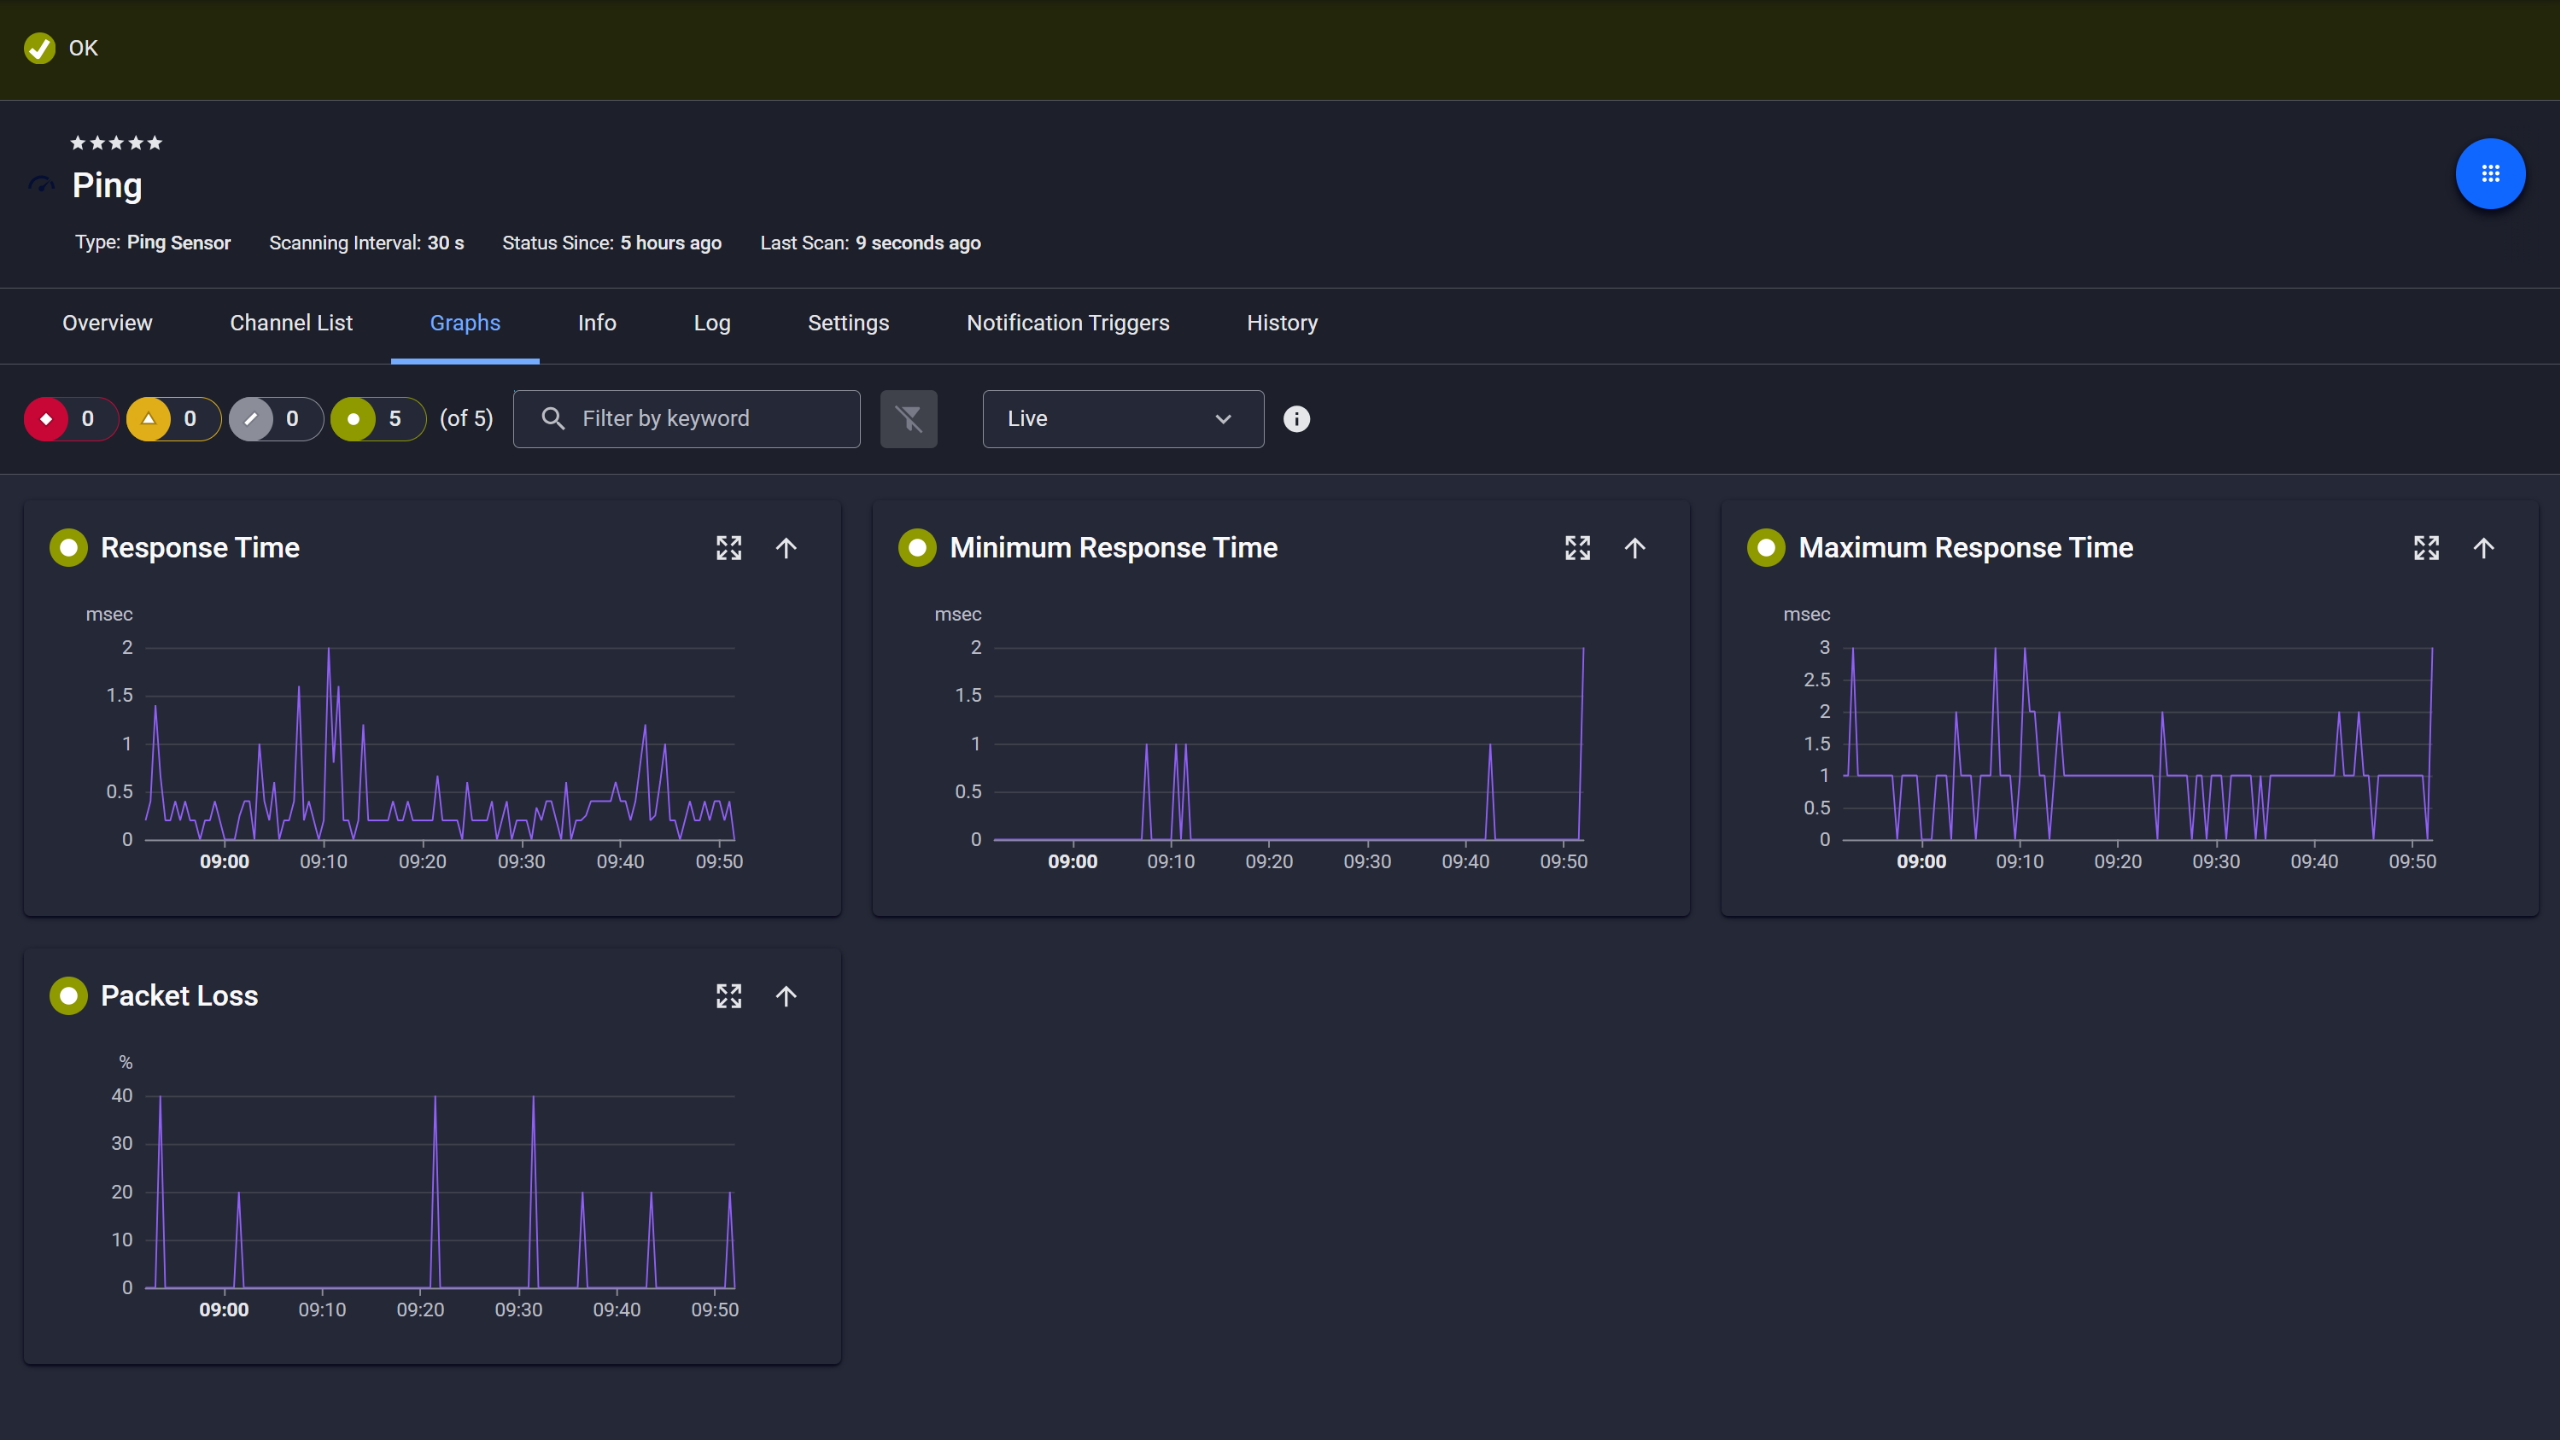
PRTG Ping sensor graphs showing response time, min, max, and packet loss over time

Ping response and packet loss

Remote Offices Are Part of Your Network Too

If a subnet isn't directly reachable from your PRTG core server, devices on it won't be discovered. That's a blind spot. In environments with multiple sites or separated network segments, it's a common one.  

PRTG remote probes solve this. A probe runs locally at each site. It takes care of auto-discovery and monitoring for that subnet and sends the results back to your the core PRTG server. You don't need to route all scan traffic through headquarters or set up a VPN tunnel just to monitor a remote office.  

  • Each probe handles auto-discovery and monitoring for its own subnet
  • All results go to one central PRTG interface
  • Deploy on Windows (classic probes) or Linux (multi-platform probes)
  • Every site's devices are managed locally and visible in one place
  • Works for one remote office or dozens of distributed sites

How PRTG Monitors Network Devices 

PRTG uses several protocols during discovery and ongoing monitoring, and which one applies depends on the device type and what it's running. The final tab covers Paessler PRTG UVexplorer, a separately installed companion product that adds Layer 2 topology discovery on top of PRTG.

ICMP Ping and ARP

PRTG starts by sending ICMP pings across your defined IP ranges. For IPv4 devices that respond, it resolves MAC addresses via ARP. Those MAC addresses tell PRTG what type of device it's dealing with and which icon to assign in the device tree. One limitation: ARP only works within the same local network segment. Your PRTG probe needs to be on the same subnet as the devices it's scanning. IPv6 devices respond to ICMP, but ARP-based MAC resolution is IPv4 only.  

SNMP Device Identification 

When a device responds, PRTG queries it via SNMP to identify the device type and read initial system data. It picks the matching device templates and creates sensors from them. You don't configure sensors manually for SNMP-capable devices. 

Port Probing

PRTG scans common TCP and UDP ports to check which services are active: HTTP, HTTPS, DNS, FTP, and others. When it finds an open port with a running service, it creates a sensor for it. That's how it figures out what each device is actually doing, not just whether it's online. 

Windows Device Data

On Windows devices, PRTG uses WMI to collect CPU load, memory usage, disk I/O, and event log data. Running processes are captured too. The System Information feature runs on WMI; on SNMP-capable devices, SNMP handles system and process data instead. Hardware and software inventory refreshes every 24 hours. WMI needs valid Windows credentials. Without them, PRTG can ping the device, but that's about it. 

Active Directory Integration

PRTG can pull device lists directly from Active Directory, up to 1,000 computers per discovery run, scoped to a specific organizational unit if needed. Scanning IP ranges alone won't give you device names in Windows-heavy environments. AD discovery fills that gap. PRTG uses DNS to resolve hostnames and doesn't query your DHCP server directly. 

Layer 2 Topology with Paessler PRTG UVexplorer

PRTG discovery builds your device tree from IP-range scans. To see how those devices physically connect, PRTG UVexplorer adds automated Layer 2 discovery and port-level topology mapping. It reveals device-to-device relationships down to the switch port and collects richer device inventory than ping and ARP alone can provide. It runs as a separately installed companion to PRTG, refreshes through scheduled discoveries, and its maps and inventory can be surfaced inside PRTG. 
Explore Paessler PRTG UVexplorer.

free downLoad

Network Scanning: With PRTG or with standalone tools? 

FEATURE

Standalone Scanners (Nmap, Angry IP, etc.)

Standalone Scanners (Nmap, Angry IP, etc.)

PRTG

PRTG 

Initial device discovery 

Standalone Scanners (Nmap, Angry IP, etc.)
not included

Manual scan required 

PRTG
included

Automatic on first setup 

Recurring scheduled scans 

Standalone Scanners (Nmap, Angry IP, etc.)
not included

Manual re-run only 

PRTG
included

Hourly, daily, or weekly 

Continuous device health monitoring 

Standalone Scanners (Nmap, Angry IP, etc.)
not included

Not included 

PRTG
included

Starts immediately post-discovery 

Software/hardware inventory per device 

Standalone Scanners (Nmap, Angry IP, etc.)
not included

Not included 

PRTG
included

Via WMI / System Information 

Remote/multi-site subnet coverage 

Standalone Scanners (Nmap, Angry IP, etc.)
not included

Requires direct network access 

PRTG
included

Via remote probes 

Alerting on device changes or failures 

Standalone Scanners (Nmap, Angry IP, etc.)
not included

Not included 

PRTG
included

Email, SMS, push notification 

Multi-vendor SNMP support

Standalone Scanners (Nmap, Angry IP, etc.)
not included

Limited or manual 

PRTG
included

Native, broad vendor coverage 

free downLoad

“I would recommend PRTG because it has helped us significantly improve service uptime by highlighting important alerts that would otherwise result in a system failure or service disruption if action was not taken. Thanks to PRTG, we can ensure that The Ritz London’s network and IT systems are five-star, just like the hotel.”

Richard Isted, IT Manager
The Ritz London

Ultimately, people do better when they focus on the solution, not the tool. This is the mantra we live by at Skyscanner. Without PRTG, we’d still be spending half a day or more on monitoring our internal tools.

Barry Kelly, Systems Engineer
Skyscanner

Adopting PRTG has been like going from being in the dark to being in the light. Before, we had limited visibility into what was happening in the infrastructure and in the network. Now, however, thanks to the comprehensive dashboard and real-time notifications, we receive constant updates on the status of facilities and services, and our way of working has gone from passive to proactive.

Luca Meneghesso, senior IT infrastructure and security specialist
Banca Profilo

Paessler PRTG Network Monitor licenses & pricing

Choose the PRTG Network Monitor subscription that's best for you.

License NameLicense descriptionPriceLicense DetailsGet startedPricing Details
PRTG 500$200per month paid annuallyBuy nowBuy now

Enough to monitor multiple aspects of 50 devices

PRTG 1000$358per month paid annuallyBuy nowBuy now

Enough to monitor multiple aspects of 100 devices

PRTG 2500$742per month paid annuallyBuy nowBuy now

Enough to monitor multiple aspects of 250 devices

PRTG 5000$1,300per month paid annuallyBuy nowBuy now

Enough to monitor multiple aspects of 500 devices

PRTG 10000$1,642per month paid annuallyBuy nowBuy now

Enough to monitor multiple aspects of 1000 devices

Over 100,000 Customers Worldwide Love Paessler  

customer success stories

 Network Device Scanner: Frequently Asked Questions  

What's the difference between a network device scanner and an IP scanner?

An IP scanner tells you which addresses are alive on your network. PRTG identifies what each device is, puts it in a structured device tree, creates sensors for it, and starts monitoring it. The scan itself is just step one. 

Does PRTG support IPv6 network scanning?

Partially. PRTG reaches IPv6 devices via ICMP ping, but ARP-based MAC address resolution is IPv4 only. That means device type identification and icon assignment via MAC address won't work for IPv6-only devices. On dual-stack networks, most discovery happens via the IPv4 side anyway. 

Can PRTG detect devices connected via Wi-Fi?

Yes, because wireless devices have IP and MAC addresses like anything else on the network. PRTG discovers them via ICMP ping and ARP the same way it would a wired device. The probe just needs to be able to reach that subnet. 

Can PRTG export device scan results to CSV?

Yes. Reports in PRTG can be exported as PDF, CSV, or HTML and cover monitoring data including device lists and sensor data. You run them manually or set them on a schedule. 

Does PRTG support Wake-on-LAN or remote device shutdown?

Wake-on-LAN yes, remote shutdown no. Not natively, anyway. For WoL, you set up a notification that triggers an Execute Program action to send the magic packet when a device goes offline. The same Execute Program mechanism can run a shutdown script, but that depends on your environment and whether you have the access to make it work. 

Is PRTG suitable for home networks?

PRTG is built for business and enterprise environments. The feature set and the licensing aren't aimed at home use. Angry IP Scanner or Advanced IP Scanner are free and will do everything a home network actually needs. 

What is a sensor in PRTG, and how many do I need per device?

A sensor monitors one specific thing on one device. An SNMP CPU Load sensor tracks CPU load. An SNMP Traffic sensor tracks traffic on a switch port. A Ping sensor tracks reachability. Most devices end up with several sensors. The number depends on the device type and how much visibility you want. Auto-discovery creates a starting set, and you adjust from there. Since subscription is based on sensor count, running the free trial first is the practical way to get a realistic number before you commit. 

Does PRTG work in DHCP environments where IP addresses change frequently?

It works, with a limitation. PRTG tracks devices by IP address, so if an address changes after discovery, PRTG won't pick up the new one automatically. Active Directory-based discovery handles this better. PRTG pulls device lists from AD by hostname rather than IP. PRTG resolves those hostnames via DNS and doesn't talk to your DHCP server directly. 

Paessler PRTG

Paessler PRTG

Network Monitoring Software – Version 26.1.116.1532 (February 9th, 2026)

Hosting icon

Hosting

Download for Windows and cloud-based version PRTG Hosted Monitor available

Languages icon

Languages

English, German, Spanish, French, Portuguese, Dutch, Russian, Japanese, and Simplified Chinese

test

Monitor everything

Network devices, bandwidth, servers, applications, virtual environments, remote systems, IoT, and more

test

Pricing

Choose the PRTG Network Monitor subscription that's best for you

Discover more monitoring insights and stories

Content illustration

Powerful stories from the monitoring world

  • How to see all IP addresses on network: A guide for IT professionals
  • How to identify unknown devices on your network: A complete guide
  • How to find IP addresses on your network: A complete guide for IT ...
Support illustration

Resources to master your monitoring challenges

  • PRTG Manual: Monitoring via SNMP - Paessler
  • PRTG Manual: Folder Sensor - Paessler
  • Notification paused
Solution illustration

Solutions for all your monitoring needs

  • SNMP Monitoring
  • IP Monitoring
  • Database Monitoring
PRTG Logo

Start Monitoring with PRTG and see how it can make your network more reliable and your job easier.

Free download
PRODUCT OVERVIEW

Products

  • Paessler PRTG
    Paessler PRTGMonitor your whole IT infrastructure
    • PRTG Network Monitor
    • PRTG Enterprise Monitor
    • PRTG Hosted Monitor
    • PRTG UVexplorer
    • PRTG extensions
      Extensions for Paessler PRTGExtend your monitoring to a new level
  • Icon Features
    FeaturesExplore all monitoring features

Monitoring with PRTG

  • Network monitoring
  • Bandwidth monitoring
  • SNMP monitoring
  • Network mapping
  • Wi-Fi monitoring
  • Server monitoring
  • Network traffic analyzer
  • NetFlow monitoring
  • Syslog server

Useful Links

  • PRTG Manual
  • Knowledge Base
  • Customer Success Stories
  • About Paessler
  • Subscribe to newsletter
  • PRTG Support
  • PRTG Consulting
  • PRTG Feedback & Roadmap

Contact

Paessler GmbH
Thurn-und-Taxis-Str. 14, 
90411 Nuremberg 
Germany

[email protected]

+49 911 93775-0

  • Contact us
©2026 Paessler GmbHTerms & ConditionsPrivacy PolicyImprintReport VulnerabilityDownload & InstallSitemap
SNMP, MIBs and OIDs SNMP, MIBs and OIDs SNMP, MIBs and OIDs