




Custom alerts and data visualization let you quickly identify and prevent issues with your switches.

Hewlett Packard Enterprises and Paessler are collaborating in a fresh new way to bring increased value to you as our customer.
What does this mean for you?
Diagnose network issues by continuously tracking your network switches. Show hardware health, bandwidth usage, packet loss, uptime, port utilization and port status, and other key metrics in real time. Visualize monitoring data in clear graphs and topology maps to identify problems more easily. Gain the overview you need to troubleshoot your switches efficiently.
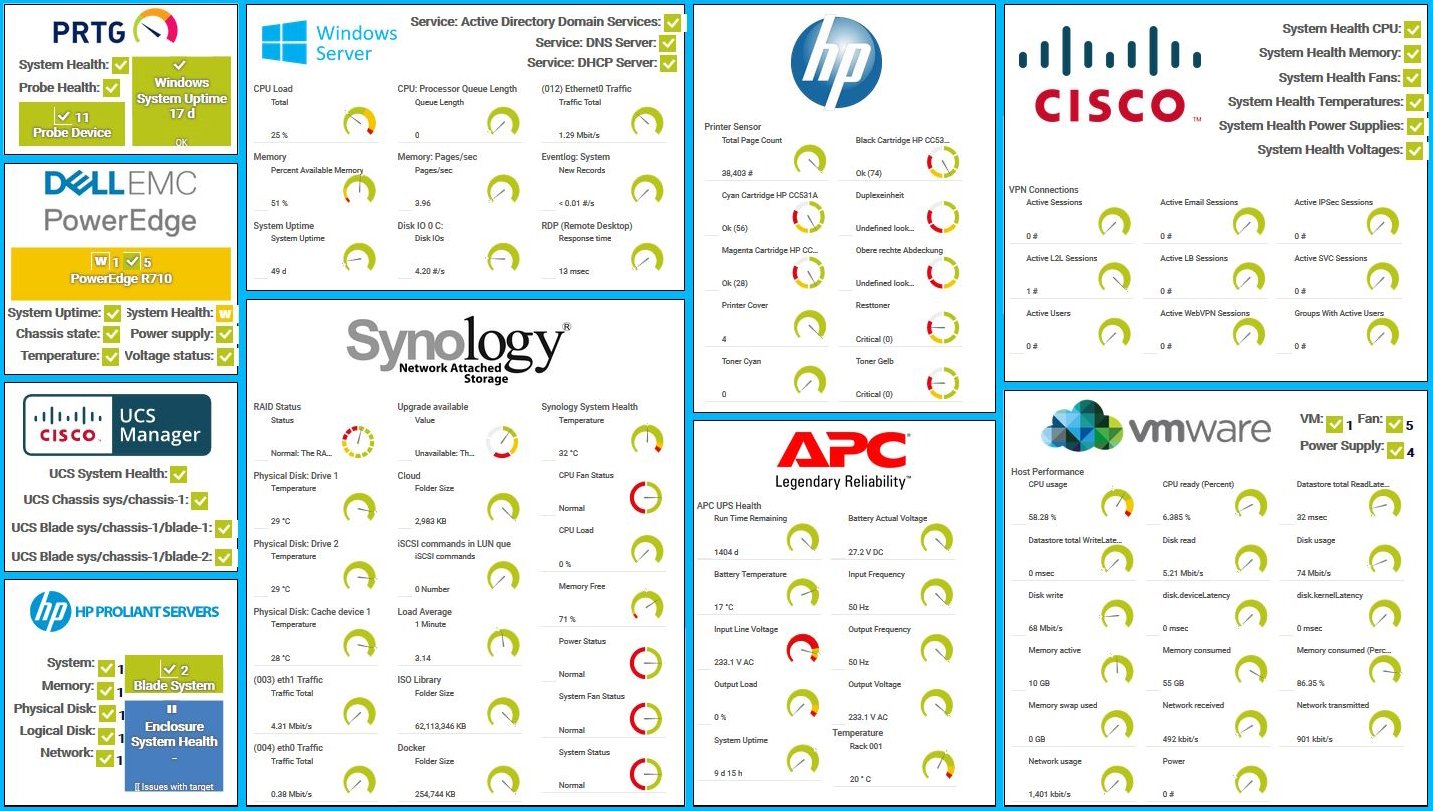
Map of hardware monitoring
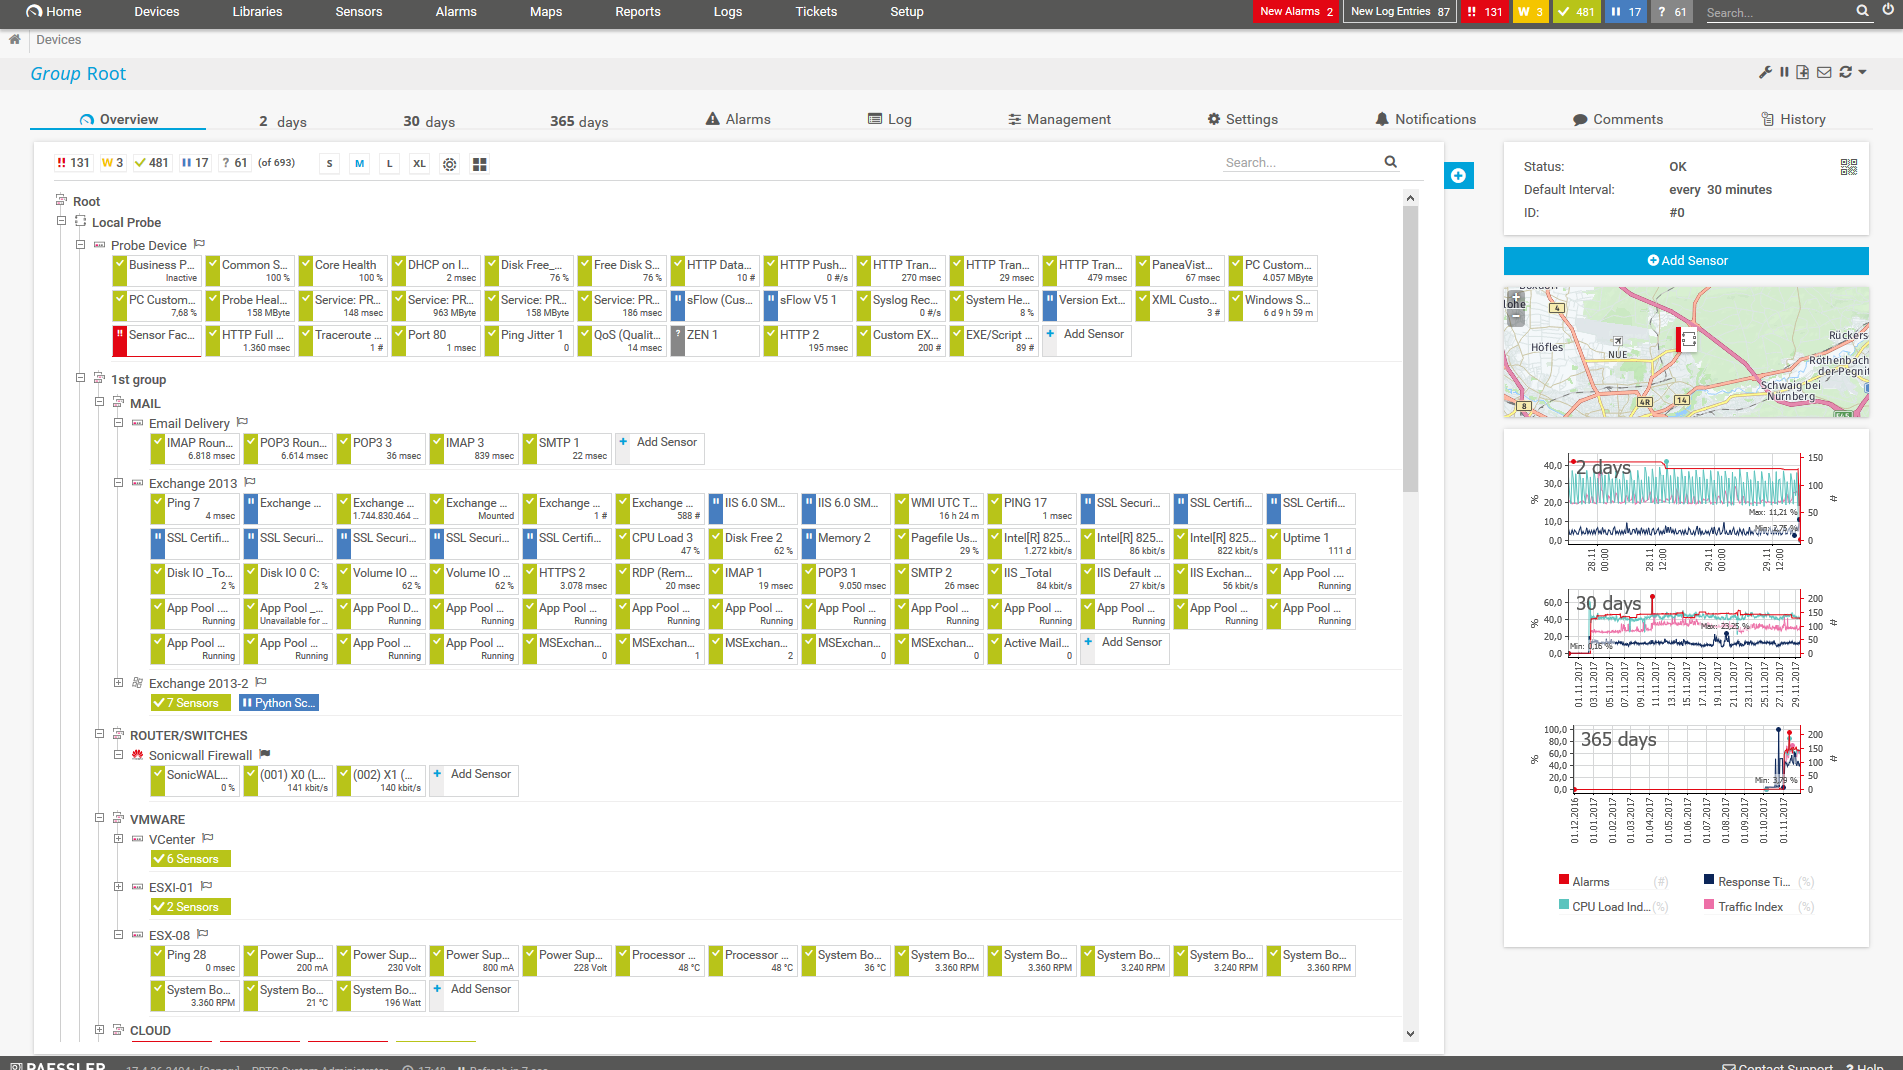
Device tree view of the complete monitoring setup
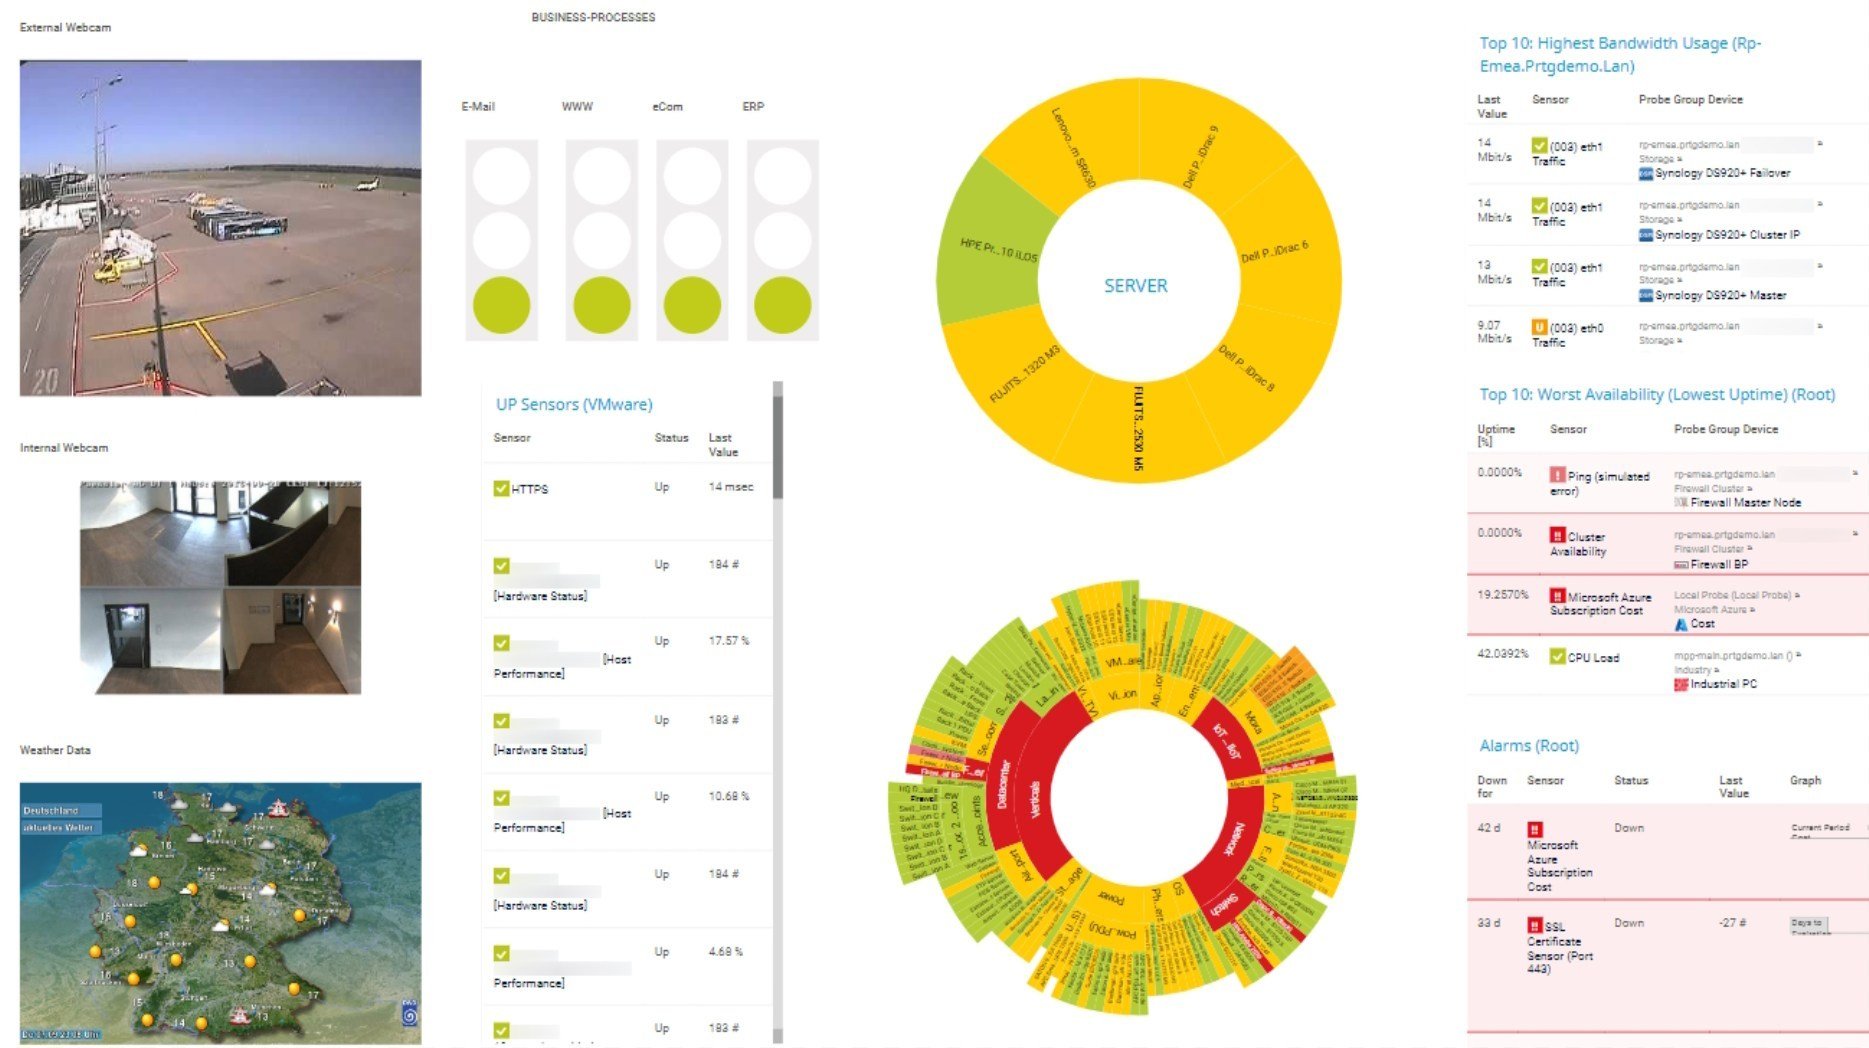
Custom PRTG dashboard for keeping an eye on the entire IT infrastructure
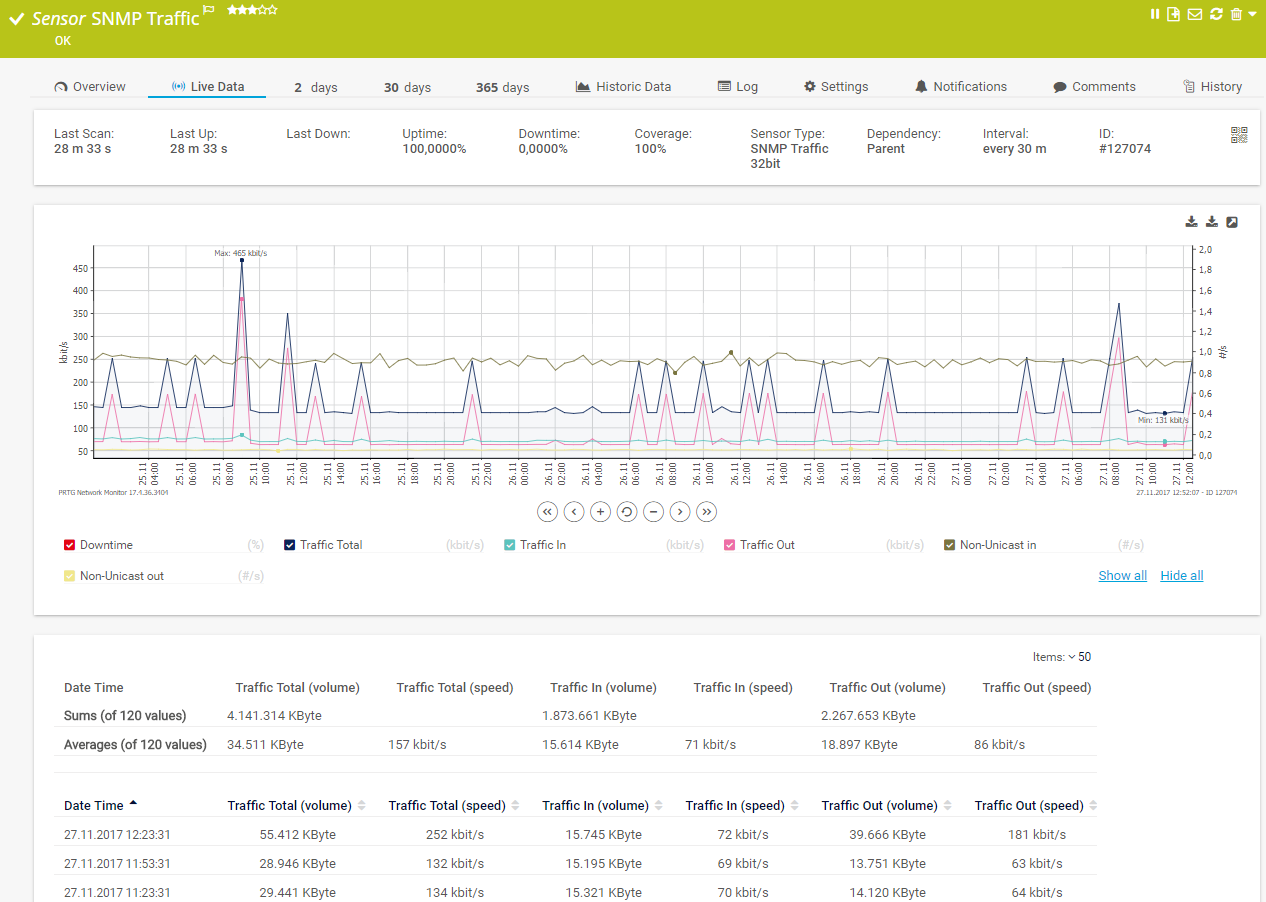
Live traffic data graph in PRTG

“All-around winning
network monitor”

“The real beauty of PRTG is the endless possibilities it offers”

“PRTG Network Monitor
is very hard to beat”
When monitoring switch ports, administrators are up against some major challenges. They must be able to continually check for closed ports that should actually be open, as well as for potentially dangerous open ports.
With PRTG, you'll keep constant track of your switch ports and automatically receive an alarm if there is some unusual activity.
If a switch is stretched beyond its capacities, then it is sure to break down. Such a situation is both frustrating and unnecessary.
With PRTG, you are quickly informed of impending overloads and can upgrade the switch accordingly and also plan for more hardware resources – for more bandwidth capacity on your switches.
Switch monitoring is not just about observing the status of your switches. It’s also important to understand the kind of traffic they are handling.
With PRTG, you gain insights into the data flowing through each switch, allowing for a comprehensive traffic analysis. These insights let you identify patterns, prioritize critical applications, and optimize bandwidth allocation.
PRTG's monitoring capabilities go beyond tracking the health and performance of your network switches. The network monitoring tool also provides an overview of your entire vital network infrastructure including all critical connections and components.
This ensures that you have a properly working network environment and minimizes potential downtimes.
Real-time notifications mean faster troubleshooting so that you can act before more serious issues occur.
Set up PRTG in minutes and use it on almost any mobile device.
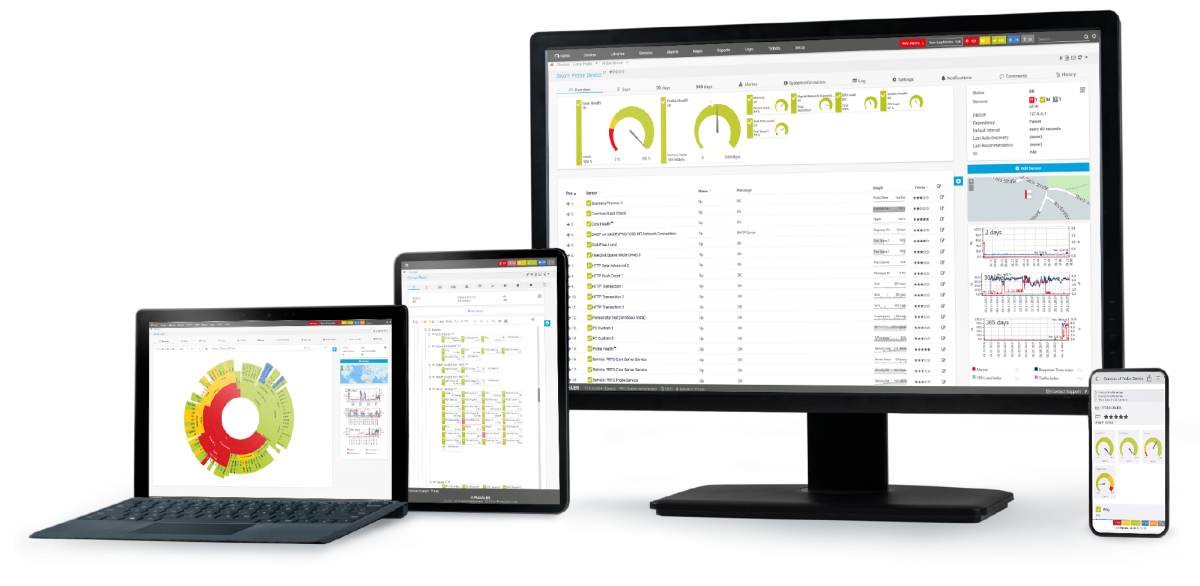
Custom alerts and data visualization let you quickly identify and prevent issues with your switches.
Switch monitoring is the process of continuously observing and managing the performance, status, and activities of network switches. It allows network administrators to ensure switches are operating efficiently, identify potential issues before they escalate, and keep a tab on network traffic.
Switch monitoring with PRTG offers multiple benefits:
Many sysadmins resort to the command line for swift checks, such as verifying the availability of a particular network device (e.g., a switch). Nonetheless, expert monitoring delves deeper.
An advanced monitoring solution employs protocols like SNMP, NetFlow, and IPFIX to consistently oversee all your crucial network devices. PRTG equips you with multiple SNMP sensors, enabling you to initiate your monitoring immediately.
In PRTG, “sensors” are the basic monitoring elements. One sensor usually monitors one measured value in your network, for example the traffic of a switch port, the CPU load of a server, or the free space on a disk drive. On average, you need about 5-10 sensors per device or one sensor per switch port.
Paessler PRTG is used by companies of all sizes. Sysadmins love PRTG because it makes their job a whole lot easier.
Bandwidth, servers, virtual environments, websites, VoIP services – PRTG keeps an eye on your entire network.
Everyone has different monitoring needs. That’s why we let you try PRTG for free.
