• Company
    • About Us
    • Case Studies
    • Press Center
    • Careers
    • Blog
    • Contact us
  • Contact us
  • Login
 
  • English
    • Deutsch
    • Español
    • Français
    • Italiano
    • Português
Paessler
                    - The Monitoring Experts
  • Products
    • Paessler PRTG
      Paessler PRTGMonitor your whole IT infrastructure
      • PRTG Network Monitor
      • PRTG Enterprise Monitor
      • PRTG Hosted Monitor
      • PRTG UVexplorer
      • PRTG extensionsExtensions for Paessler PRTGExtend your monitoring to a new level
    • Icon Features
      FeaturesExplore all monitoring features
      • Maps & dashboards
      • Alerts & notifications
      • Multiple user interfaces
      • Distributed monitoring
      • Customizable reporting
  • Solutions
    • By TeamFor your organization size
      • Small Business IT
      • Mid-Market IT
      • Enterprise IT
      • MSP Network Monitoring
    • Industries
      By IndustryFor your business sector
      • Industrial
      • Healthcare
      • Government
      • Education
      • Data Center
      • Finance
    • IT Topics
      By Use CaseFor every technical scenario
      • Network Monitoring
      • Server Monitoring
      • OT Monitoring
      • Distributed Monitoring
      • Network Topology Mapping
      • SNMP Monitoring
      • Bandwidth Monitoring
  • Pricing
  • Resources
    • Getting Started
      Getting StartedModules for self-paced learning
    • How-to Guides
      How-to GuidesGet the most out of PRTG
    • Videos & Webinars
      Videos & WebinarsLearn from Paessler experts
    • IT  Knowledge
      IT KnowledgeExpand your IT knowledge
    • PRTG Manual
      PRTG ManualFull documentation
    • Knowledge Base
      Knowledge BaseShare community knowledge
    • PRTG Sensor Hub
      PRTG Sensor HubGet sensors, scripts & templates
    • Trainings
      PRTG TrainingLearn how to work with PRTG
  • Partners
    • Icon Handshake
      Become a PartnerFor resellers and channel partners
    • Icon MSP
      Become an MSPDeliver monitoring as a managed service
    • icon partner
      Partner PortalLog in to your partner account
    • Deal Registration
      Deal RegistrationRegister your sales opportunities
    • icon search
      Find a PartnerFind partners selling Paessler products
    • icon technology
      Technology AlliancesSee Paessler technology partnerships
    • Partner HubTools for Your Success
  • Company
    • About Us
    • Case Studies
    • Press Center
    • Careers
    • Blog
    • Contact us
  • Contact us
  • Login
  • English
    • Deutsch
    • Español
    • Français
    • Italiano
    • Português
  • Get a quote
  • Free trial
  1. Home>
  2. Company>
  3. Case Studies>
  4. Process Automation Solutions

The only limit is your imagination: how Process Automation Solutions (Orise) brings OT monitoring to industrial networks with PRTG 

Challenge: OT networks in manufacturing lack monitoring; IT and OT teams have separate toolsets

download PDF
Logo Company Process Automation Solutions

COMPANY
Process Automation Solutions (Orise)

INDUSTRY
Manufacturing

COMPANY SIZE
Midsized Company

COUNTRY
Germany

SCALE
1,400 employees, 50+ global offices, IT/OT MSP

Icon Industry

Faulty network switch causing packet loss detected via SNMP at a chemicals plant

Icon Sensor

Legacy Honeywell coaxial DCS systems monitored via custom PRTG sensors

Icon Warning

Agentless deployment covers both IT and OT without disrupting production networks

The problem

Process Automation Solutions (Orise) serves manufacturers across automotive, chemical, pharmaceutical, food and beverage, and oil and gas industries. Its Digitalization team helps clients bridge the gap between enterprise IT and operational technology.

OT networks have historically been isolated from IT. As industrial processes grow more dependent on connected systems, that separation creates risk. Equipment failures and redundancy gaps go undetected. Unlike IT environments, OT rarely has monitoring in place.

To address this, Process Automation Solutions became a Paessler partner and built TINA (The Industrial Network Analyzer), combining PRTG with OT expertise to deliver monitoring as a service to manufacturing clients.

What changed with PRTG

PRTG monitors OT and IT environments using SNMP, SSH, OPC UA, Modbus TCP, WMI, REST APIs, and custom-scripted sensors. This covers DCS systems, PLCs, historians, MES, LIMS, batch management, industrial protocols like Profibus, and standard IT infrastructure.

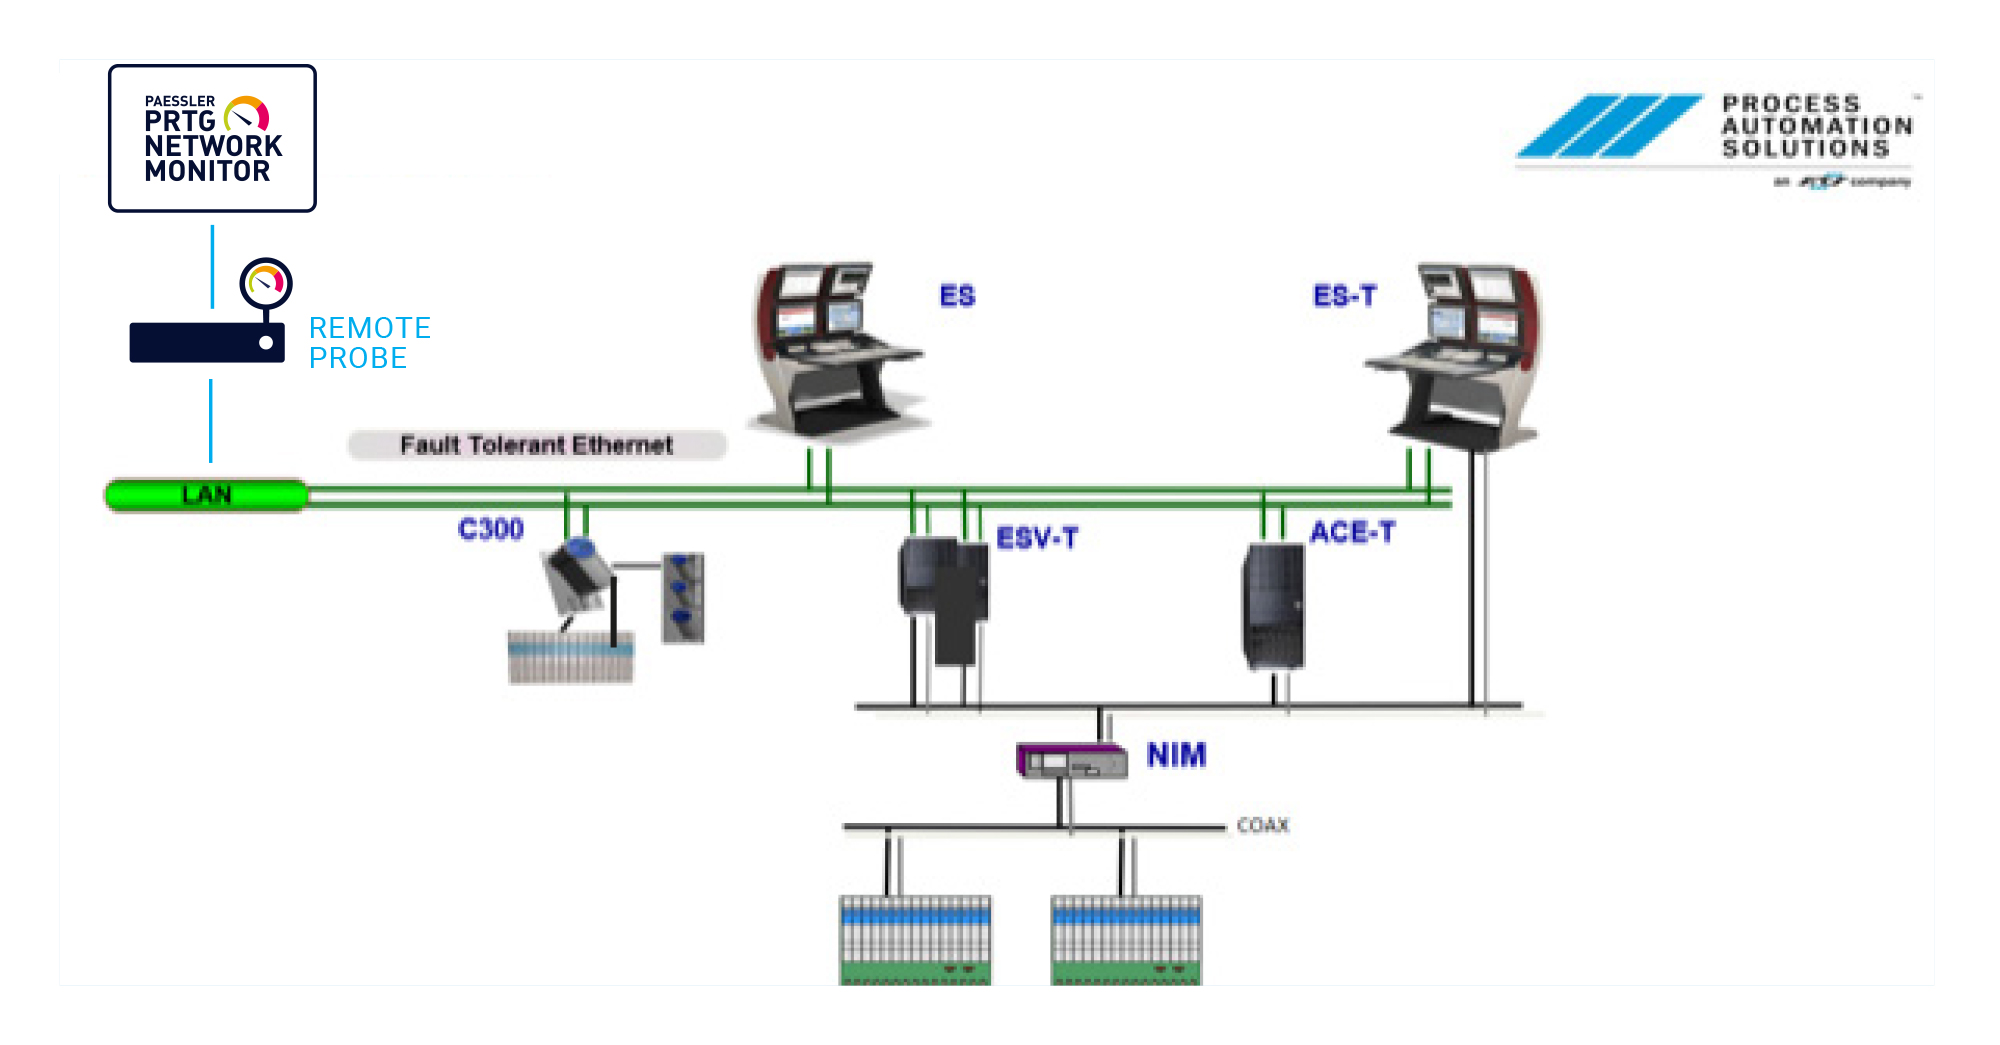
Three client incidents demonstrate the value. At a petrochemical plant, DCS redundant servers were swapping unpredictably. PRTG identified a memory leak in Honeywell Experion services crashing the master server. At a chemicals plant, project downloads caused severe packet loss. PRTG pinpointed a faulty switch via SNMP, which was replaced and connectivity restored. Custom sensors were also developed for legacy Honeywell DCS architectures using coaxial token ring networks.

PRTG dashboards let engineers place sensors on network diagrams. When something fails, the location is immediately visible.

In the past, the enterprise and the industrial network were completely separated with very different requirements, such as security versus productivity. We see that within OT, monitoring is not widely used yet for several reasons, but processes are depending on IT systems more and more. The need for a reliable OT network is growing rapidly, and that’s where we come in.

Pascal Vercammen, Digitalization & IT Department Manager
Process Automation Solutions
PRTG Logo

PRTG gives OT-focused MSPs the flexibility to monitor any industrial environment, however complex.

CONTACT SALES
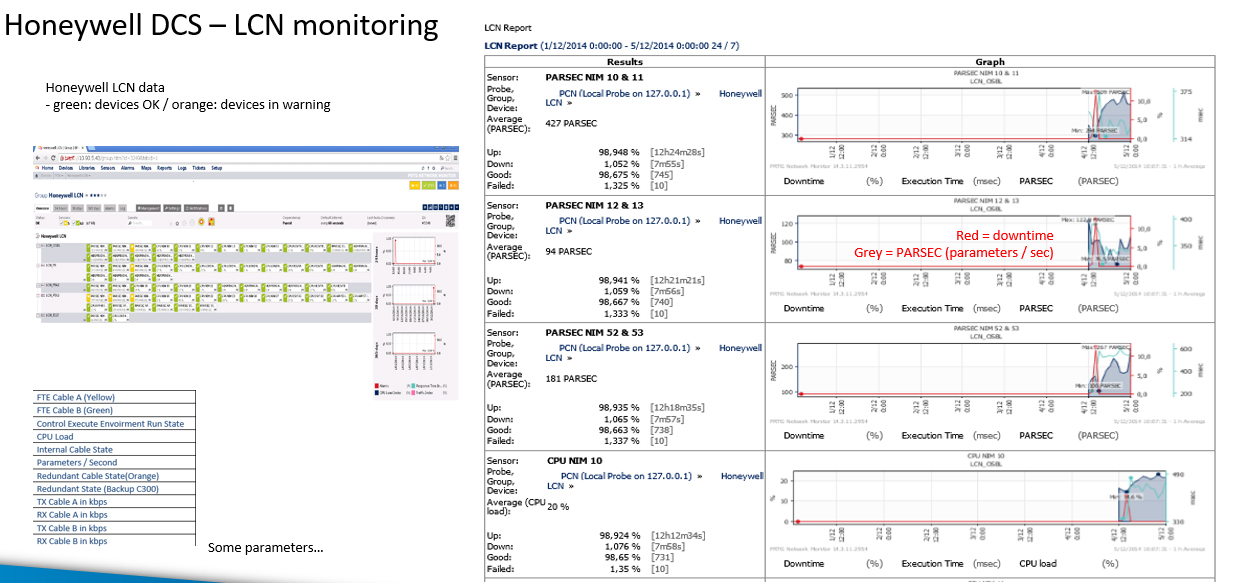
PRTG report about Honeywell DCS - LCN monitoring
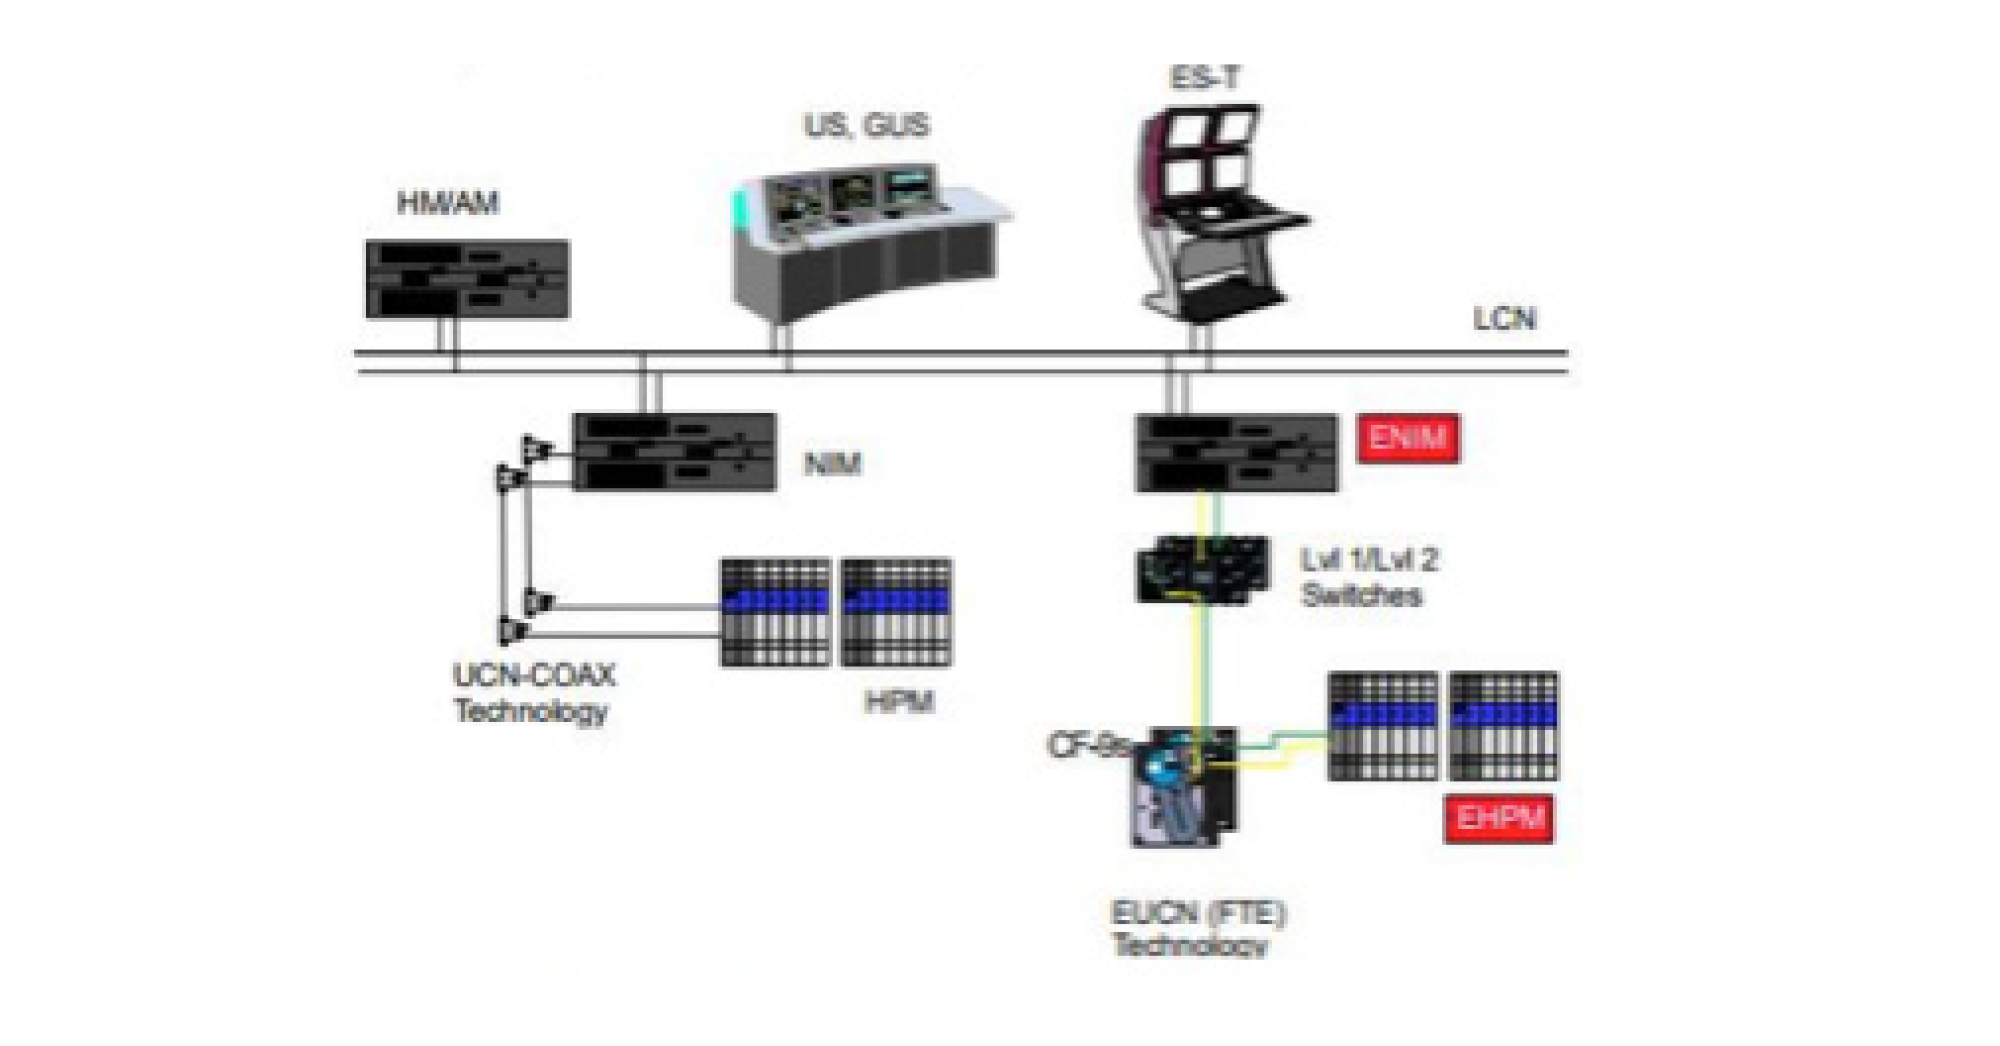
Custom map in PRTG: TPB/TPS system with FTE-based UCN
PRTG network overview: Honeywell DCS - LCN monitoring

Discover more monitoring insights and stories

Solution illustration

Solutions for all your monitoring needs

  • Industrial IT Monitoring
  • OT Cybersecurity Strategy Monitoring
  • SCADA Integration
Content illustration

Powerful stories from the monitoring world

  • Video: Quick overview of PRTG
  • Customer success story: Riverford & PRTG
  • Understanding MQTT architecture: a deep dive
Support illustration

Resources to master your monitoring challenges

  • Make the SSL Certificate Sensor to check SAN records
  • Generating aggregated metrics from sensor historical data
  • Is there a sensor that shows the ip address of the remote computer
Explore All Case Studies

Products

  • Paessler PRTG
    Paessler PRTGMonitor your whole IT infrastructure
    • PRTG Network Monitor
    • PRTG Enterprise Monitor
    • PRTG Hosted Monitor
    • PRTG UVexplorer
    • PRTG extensions
      Extensions for Paessler PRTGExtend your monitoring to a new level
  • Icon Features
    FeaturesExplore all monitoring features

Monitoring with PRTG

  • Network monitoring
  • Bandwidth monitoring
  • SNMP monitoring
  • Network mapping
  • Wi-Fi monitoring
  • Server monitoring
  • Network traffic analyzer
  • NetFlow monitoring
  • Syslog server

Useful Links

  • PRTG Manual
  • Knowledge Base
  • Customer Success Stories
  • About Paessler
  • Subscribe to newsletter
  • PRTG Support
  • PRTG Consulting
  • PRTG Feedback & Roadmap

Contact

Paessler GmbH
Thurn-und-Taxis-Str. 14, 
90411 Nuremberg 
Germany

[email protected]

+49 911 93775-0

  • Contact us
©2026 Paessler GmbHTerms & ConditionsPrivacy PolicyImprintReport VulnerabilityDownload & InstallSitemap
PRTG Data Hub PRTG Data Hub PRTG Data Hub