• Company
    • About Us
    • Case Studies
    • Press Center
    • Careers
    • Blog
    • Contact us
  • Contact us
  • Login
 
  • English
    • Deutsch
    • Español
    • Français
    • Italiano
    • Português
Paessler
                    - The Monitoring Experts
  • Products
    • Paessler PRTG
      Paessler PRTGMonitor your whole IT infrastructure
      • PRTG Network Monitor
      • PRTG Enterprise Monitor
      • PRTG Hosted Monitor
      • PRTG UVexplorer
      • PRTG extensionsExtensions for Paessler PRTGExtend your monitoring to a new level
    • Icon Features
      FeaturesExplore all monitoring features
      • Maps & dashboards
      • Alerts & notifications
      • Multiple user interfaces
      • Distributed monitoring
      • Customizable reporting
  • Solutions
    • By TeamFor your organization size
      • Small Business IT
      • Mid-Market IT
      • Enterprise IT
      • MSP Network Monitoring
    • Industries
      By IndustryFor your business sector
      • Industrial
      • Healthcare
      • Government
      • Education
      • Data Center
      • Finance
    • IT Topics
      By Use CaseFor every technical scenario
      • Network Monitoring
      • Server Monitoring
      • OT Monitoring
      • Distributed Monitoring
      • Network Topology Mapping
      • SNMP Monitoring
      • Bandwidth Monitoring
  • Pricing
  • Resources
    • Getting Started
      Getting StartedModules for self-paced learning
    • How-to Guides
      How-to GuidesGet the most out of PRTG
    • Videos & Webinars
      Videos & WebinarsLearn from Paessler experts
    • IT  Knowledge
      IT KnowledgeExpand your IT knowledge
    • PRTG Manual
      PRTG ManualFull documentation
    • Knowledge Base
      Knowledge BaseShare community knowledge
    • PRTG Sensor Hub
      PRTG Sensor HubGet sensors, scripts & templates
    • Trainings
      PRTG TrainingLearn how to work with PRTG
  • Partners
    • Icon Handshake
      Become a PartnerFor resellers and channel partners
    • Icon MSP
      Become an MSPDeliver monitoring as a managed service
    • icon partner
      Partner PortalLog in to your partner account
    • Deal Registration
      Deal RegistrationRegister your sales opportunities
    • icon search
      Find a PartnerFind partners selling Paessler products
    • icon technology
      Technology AlliancesSee Paessler technology partnerships
    • Partner HubTools for Your Success
  • Company
    • About Us
    • Case Studies
    • Press Center
    • Careers
    • Blog
    • Contact us
  • Contact us
  • Login
  • English
    • Deutsch
    • Español
    • Français
    • Italiano
    • Português
  • Get a quote
  • Free trial
  1. Home>
  2. Company>
  3. Case Studies>
  4. SE3

Reactive to preventive: how SE3 brings IT/OT monitoring to wastewater treatment plants with PRTG 

Challenge: Fragmented OT data across independent plant systems; no unified IT/OT visibility for operators

download PDF
Logo SE3

COMPANY
SE3

INDUSTRY
Consulting, Services and Energy & Utilities

COMPANY SIZE
SMB

COUNTRY
Mexico

SCALE
OT and IT, 36 treatment plants, 16 pumping stations

Icon Water

99.9999% service availability achieved across treatment plants and pumping stations

Icon Link

OT and IT fully converged in one dashboard: pumps, tanks, UPS, cameras, and network devices

Icon Check

Deployed across multiple brands and protocols with no hidden costs or compatibility issues

The problem

SE3 is a Mexican MSP specializing in industrial automation and digitization for the water and energy sectors. Its client JAPAY is the public authority responsible for potable water and sanitation across the city of Mérida and surrounding municipalities.

JAPAY operates 36 wastewater treatment plants and 16 pumping stations. Each plant runs its own independent technology platform, with different brands and systems creating fragmented data. Plant managers had to navigate multiple interfaces just to understand the current state of operations, making early detection of problems nearly impossible.

The wastewater environment is harsh on equipment. Without unified visibility, maintenance was reactive and unplanned visits by electricians were frequent and expensive.

What changed with PRTG

SE3 integrated PRTG with INSYS routers deployed at each plant. The routers translate industrial protocols into MQTT and transmit data via mobile network to a cloud broker, where PRTG then collects and displays everything in one place.

From a single dashboard, operators can now monitor engine speeds, valve status, water levels in tanks, pump activity, UPS systems, energy consumption, and surveillance cameras across all locations. OT and IT components appear together with no separate tools or interfaces.

Plant managers access live measurement values and alerts from any browser or mobile device. Critical thresholds trigger notifications before issues escalate.

SE3 also delivered this at significantly lower cost than expanding an existing SCADA system, without compatibility issues across the different brands already deployed in JAPAY's plants.

When we integrate PRTG from Paessler, we provide a solution that allows the visualization of all industrial and communication components in a single system.

Miguel Ángel López Ávila, General Manager
SE3 (Sistemas Eléctricos y Electrónicos Especializados)
PRTG Logo

PRTG gives water utility MSPs the IT/OT convergence they need to move from reactive maintenance to proactive plant management.

free TRIAL
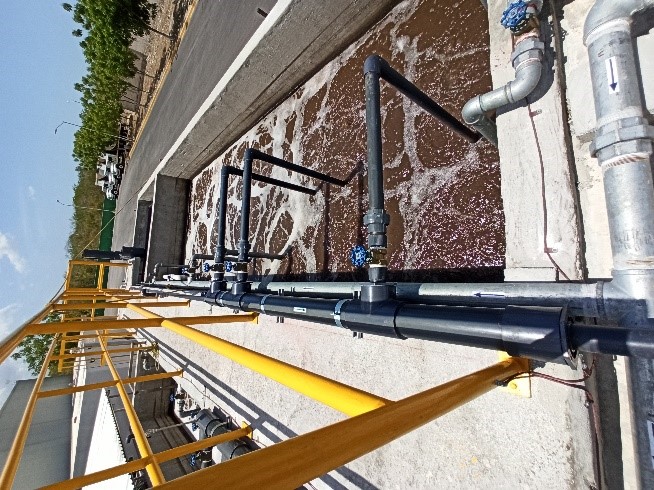
Wastewater treatment plant in Mexico
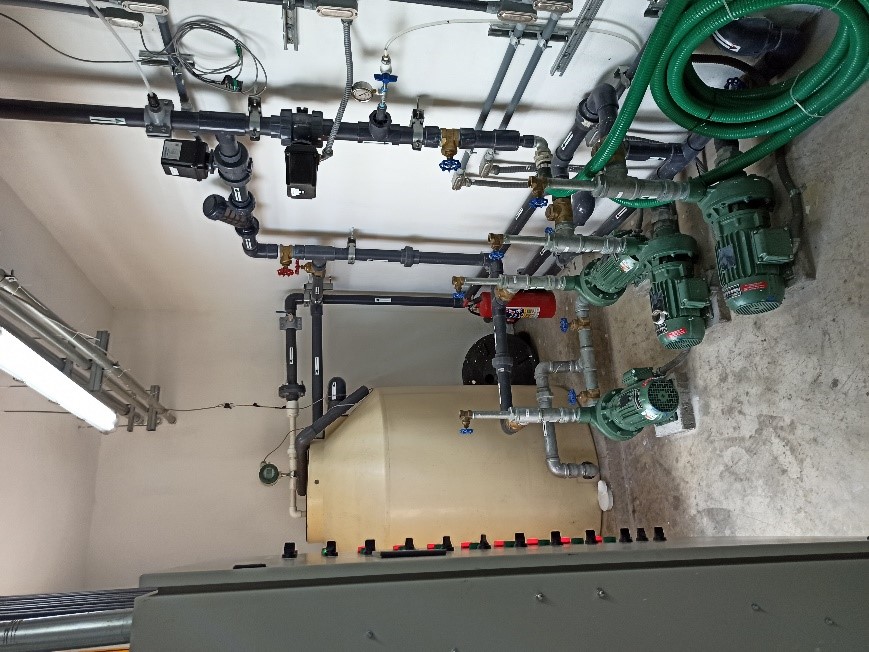
SE3 case study: Water pumping system

Discover more monitoring insights and stories

Solution illustration

Solutions for all your monitoring needs

  • OT Cybersecurity Strategy Monitoring
  • OPC UA Monitoring
  • HMI Monitoring
Content illustration

Powerful stories from the monitoring world

  • Customer success stories - Paessler
  • SE3 offers Paessler PRTG Network Monitor as a solution to monitor ...
  • Monitoring Distributed Control Systems with PRTG - Paessler Blog
Support illustration

Resources to master your monitoring challenges

  • How can I use the PRTG Application Programming Interface (API)?
  • How can I speed up PRTG—especially for large installations?
  • Quick Start Guide
Explore All Case Studies

Products

  • Paessler PRTG
    Paessler PRTGMonitor your whole IT infrastructure
    • PRTG Network Monitor
    • PRTG Enterprise Monitor
    • PRTG Hosted Monitor
    • PRTG UVexplorer
    • PRTG extensions
      Extensions for Paessler PRTGExtend your monitoring to a new level
  • Icon Features
    FeaturesExplore all monitoring features

Monitoring with PRTG

  • Network monitoring
  • Bandwidth monitoring
  • SNMP monitoring
  • Network mapping
  • Wi-Fi monitoring
  • Server monitoring
  • Network traffic analyzer
  • NetFlow monitoring
  • Syslog server

Useful Links

  • PRTG Manual
  • Knowledge Base
  • Customer Success Stories
  • About Paessler
  • Subscribe to newsletter
  • PRTG Support
  • PRTG Consulting
  • PRTG Feedback & Roadmap

Contact

Paessler GmbH
Thurn-und-Taxis-Str. 14, 
90411 Nuremberg 
Germany

[email protected]

+49 911 93775-0

  • Contact us
©2026 Paessler GmbHTerms & ConditionsPrivacy PolicyImprintReport VulnerabilityDownload & InstallSitemap
Pricing Pricing Pricing