
It is the stuff of an IT administrator’s nightmares. You think that you have a reliable backup solution in place, so making regular backups should be working fine – just to realize that an important backup failed and a lot of even more important data has been lost, be it your own company data or your customer’s data.
With PRTG, you have several options to monitor your backups and to be alerted if something went wrong with a backup so that you can react to a possible data loss. This might be even more important if you are an MSP (managed service provider) who has to manage hundreds of customers with different backup solutions for various purposes.
In this how-to, we want to show you which sensors you can use to monitor your backups. The choice of a sensor for your individual purpose mainly depends on your backup solution and how it handles backup files.
Get full visibility with real-time dashboards, alerts, and customizable sensors
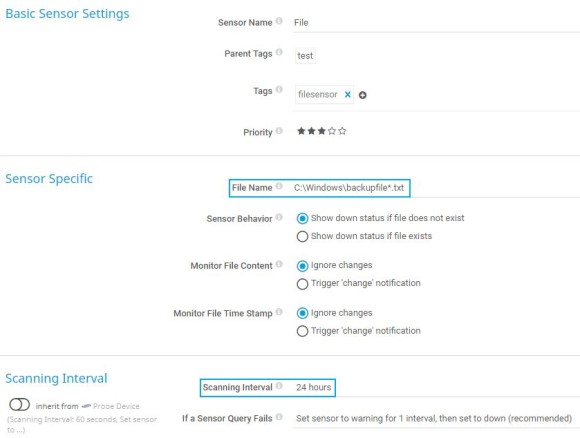
The sensor File is a good choice if your backup solution overwrites the same backup file each time a backup is made.
With this sensor, you can monitor, for example, the file’s time stamp to determine the time that passed since the file was modified the last time (in days, hours, and minutes, depending on the elapsed time).
1. Add a File sensor to a device of your choice.
2. In the sensor settings, go to the Sensor Specific section and enter a File Name:
Did you know that you can use wildcards in the file name, for example, that you can also enter C:\Windows\backupfile*.txt? This might be useful if the name of your monitored backup file includes a time stamp that changes on each new backup.
3. Set the Scanning Interval option to a value that fits the creation of your backups.
4. Leave all other settings as they are and click Create to add the sensor.
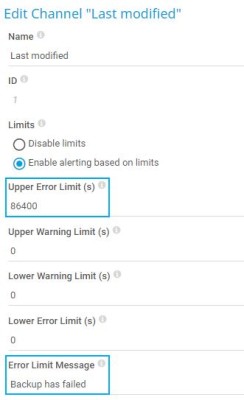
5. To monitor backup files, it is interesting to know when a file was last modified. Click the little cogwheel below the gauge of the Last modified channel to edit the channel settings
6. Under Limits, select Enable alerting based on limits and enter the value you require for an Upper Error Limit, for example, enter 86400 (s) if a backup file should not be older than 24 hours. You can optionally enter an Error Limit Message.
7. Click OK to save your settings.
8. Do not forget to set a notification trigger for this sensor so that PRTG can notify you when the sensor status changes.
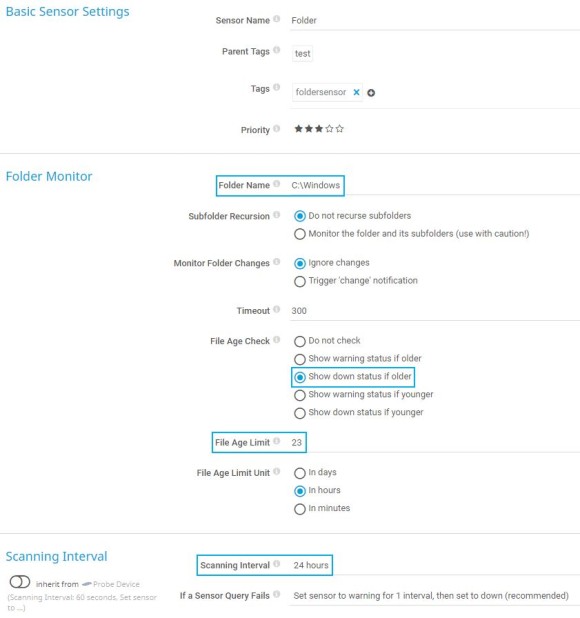
Use the sensor Folder if your backup solution creates a new backup file each time a backup is made and stores it in a specific folder. With this sensor, you can monitor, for example, the newest file and the oldest file in a folder.
1. Add a Folder sensor to a device of your choice.
2. In the sensor settings, go to the Folder Monitor section and enter a Folder Name:
3. To monitor a backup folder, it is interesting to know how old a file in the folder is. Under File Age Check, select Show down status if older.
4. Enter a File Age Limit that triggers the Down You can enter the limit in days, hours, or minutes, depending on the option that you select under File Age Limit Unit.
5. Set the Scanning Interval option to a value that fits the creation of your backups.
6. Leave all other settings as they are and click Create to add the sensor.
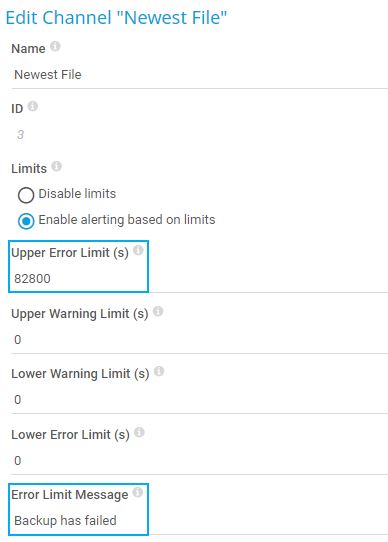
7. It is also possible to set an additional error limit for the age of the newest file in the backup folder. Click the small cogwheel below the gauge of the Newest File channel to edit the channel settings.
8. Under Limits, select Enable alerting based on limits and enter the value you require for an Upper Error Limit, for example, enter 86400 (s) if a backup file should not be older than 24 hours. You can optionally enter an Error Limit Message.
9. Click OK to save your settings.
10. Do not forget to set a notification trigger for this sensor so that PRTG can notify you when the sensor status changes.
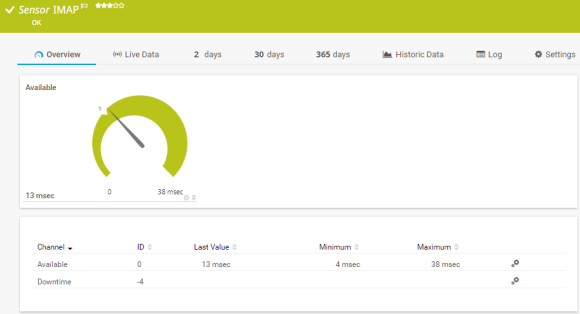
Most backup solutions send email notifications about the status of the last backup. Choose the sensor IMAP if you want to automatically check such email notifications for failed backups. The sensor uses specific filter options to check emails for keywords in the subject line and the body of an email, and it can notify you when a backup has gone wrong.
For more information on how to monitor your backups via email, see the Knowledge Base: How can I monitor my backup software to be sure backup succeeded last night?
Custom alerts and data visualization let you quickly identify and prevent all kinds of issues
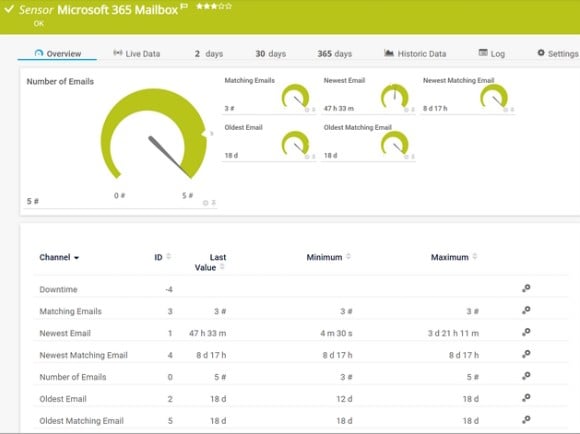
If you use Microsoft 365 and a corresponding mailbox to receive emails, the sensor Microsoft 365 Mailbox is a good choice to monitor email notifications sent by your backup solution. During sensor creation, you can select the specific folders that you want to monitor – PRTG creates one sensor per folder. You can then set specific filter options to make sure that you do not miss any failed backups.
1. Add a Microsoft 365 Mailbox sensor to a device with Microsoft 365 credentials.
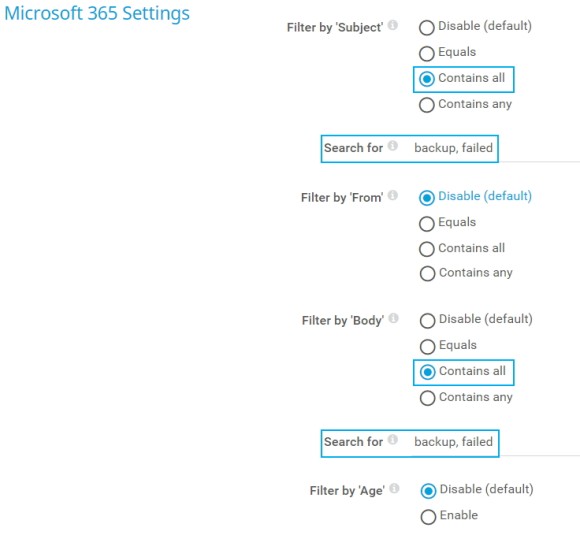
2. In the sensor settings, go to the Microsoft 365 Settings section to set the filters you need:
If you enable a filter option, the sensor creates three additional channels that show the number of matching emails, the age of the newest matching email, and the age of the oldest matching email.
3. Leave all other settings as they are and click Create to add the sensor.
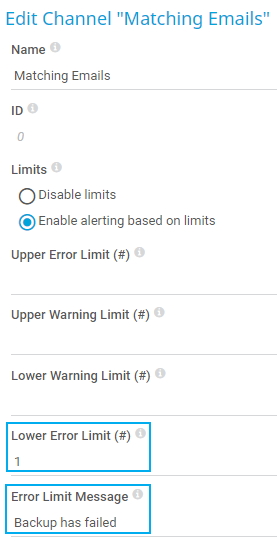
4. Set an error limit for the number of emails that match the defined strings (in our example, backup and failed). Click the little cogwheel below the gauge of the Matching Emails channel to edit the channel settings.
5. Click OK to save your settings.
6. Do not forget to set a notification trigger for this sensor so that PRTG can notify you when the sensor status changes.
Get full visibility with real-time dashboards, alerts, and customizable sensors
Most backup solutions write status messages about the status of the last backup in the Windows event log. With the sensor Event Log (Windows API) or the sensor WMI Event Log, you can apply specific filters to check such event log entries for a certain event source and a certain event message, for example, and to be notified if there is an entry that indicates a backup failure.
The sensors can have a high impact on the performance of your monitoring system. Use them with care!
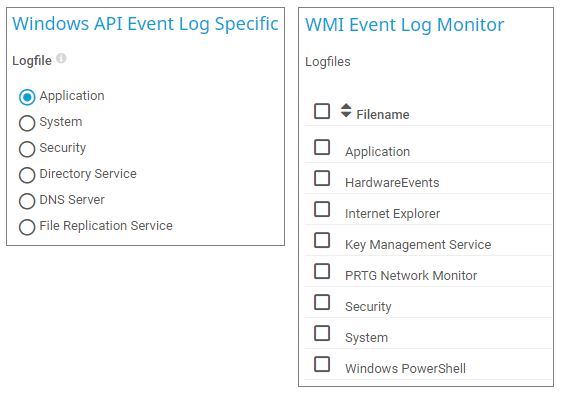
1. Add an Event Log (Windows API) sensor or a WMI Event Log sensor. Which sensor you choose depends on the logfile in which your backup solution saves the events. The Event Log (Windows API) sensor can monitor the logfiles Application, System, Security, Directory Service, DNS Server, and File Replication Service. The WMI Event Log sensor can monitor, for example, the logfiles Application, HardwareEvents, Key Management Service, Security, System, or Windows PowerShell.
2. In the sensor settings, go to the Windows API Event Log Specific section or the WMI Event Log Monitor section and select the logfile you want to monitor.
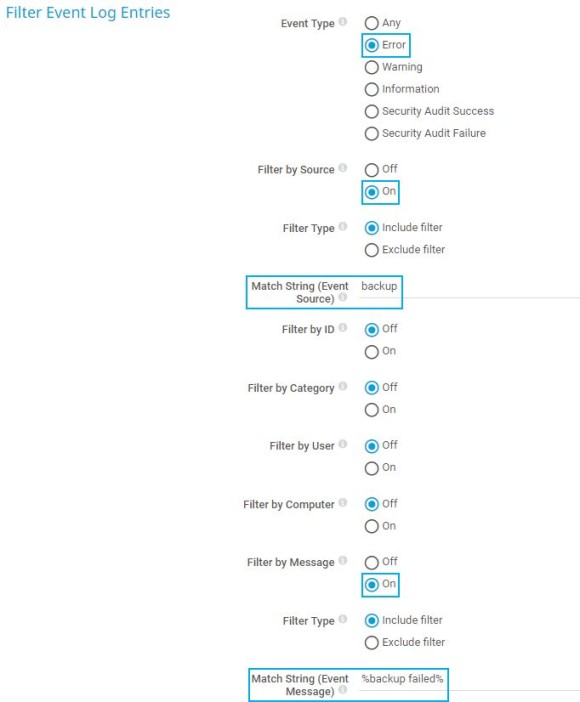
3. In section Filter Event Log Entries, set the Event Type option to Error. Enable the Filter by Source option and enter a string that the event source should match, for example, backup. Then enable the Filter by Message option and enter a string that the message should match. Which string you enter depends on the entry that your specific backup solution writes in the event log.
Did you know that if you do not want the string to match the whole event message, you need to use the percent sign (%) as wildcard for any or no character? For example, if you want the sensor to filter for the string backup failed, enter %backup failed%.
4. Set the Scanning Interval option to a value that fits the creation of your backups.
5. Leave all other settings as they are and click Create to add the sensor.
6. Click the little cogwheel below the gauge of the New Records channel to edit the channel settings
7. Under Limits, select Enable alerting based on limits and enter 0,0001 as an Upper Error Limit to set the sensor to a Down status as soon as there is a new event log message that matches all your filter criteria. You can optionally enter an Error Limit Message.
8. Click OK to save your settings.
9. Do not forget to set a notification trigger for the sensor so that PRTG can notify you when the sensor status changes.
For more information, see the Knowledge Base: My Event Log sensor ignores changes in the event log. What can I do?
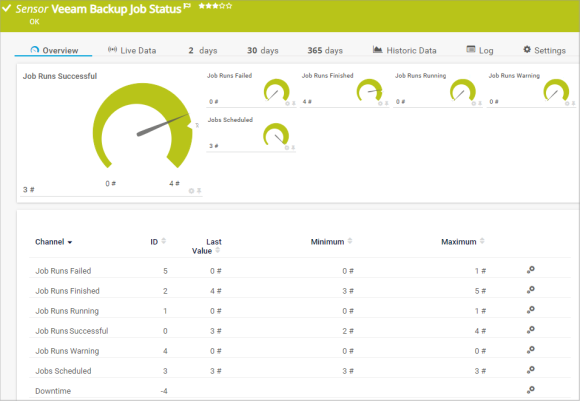
If you use Veeam Backup and Replication as your backup solution and have the Veeam Backup Enterprise Manager installed, you can use the new native sensor Veeam Backup Job Status to monitor all your backup job runs in the last 24 hours.
The sensor shows you the number of successful, failed, running, and finished job runs, job runs in a warning state, and the number of all scheduled backup jobs. The number of finished job runs includes all job runs in a warning state, as well as successful and failed job runs.
Make sure that you have the Veeam Backup Enterprise Manager installed on your system to use this sensor. You also need to provide credentials for Veeam in the settings of the parent device or group. Other than this, no further settings are required to start monitoring your Veeam backups.
Use the sensor EXE/Script Advanced if you want to run, for example, a custom PowerShell script to monitor your backups and show the returned values in multiple channels in PRTG.
For example, if you use Veeam Backup and Replication as your backup solution and do not have the Veeam Backup Enterprise Manager installed, you can find scripts for this approach in the following articles:
How We Saved 10 Terabytes of Disk Space Using Windows ReFS with Veeam (Including Script)
Monitoring Veeam Backup & Replication Without Veeam Enterprise Manager
Of course, this is not an exhaustive list. The choice of a sensor always depends on the individual backup solution you use, how it handles backup data, files, and entries, or if it has a documented API (application programming interface).
In any case, you should not forget to monitor the backup solution itself.
This way, you can go to sleep peacefully – no IT administrator’s nightmares included.

