Custom alerts and data visualization let you quickly identify and prevent service disruptions and other performance issues.
Web services are the backbone of modern business. Paessler PRTG's web service monitoring makes sure everything stays healthy, from HTTP status to response times. You'll catch issues before users do, optimize performance, and reduce troubleshooting time.
Diagnose network issues by continuously tracking the availability and performance of your web services. Show uptime, CPU usage, disk space, response time, load times, and other key metrics in real time. Visualize monitoring data in clear graphs and dashboards to identify problems more easily. Gain the overview you need to troubleshoot service disruptions and other performance issues.
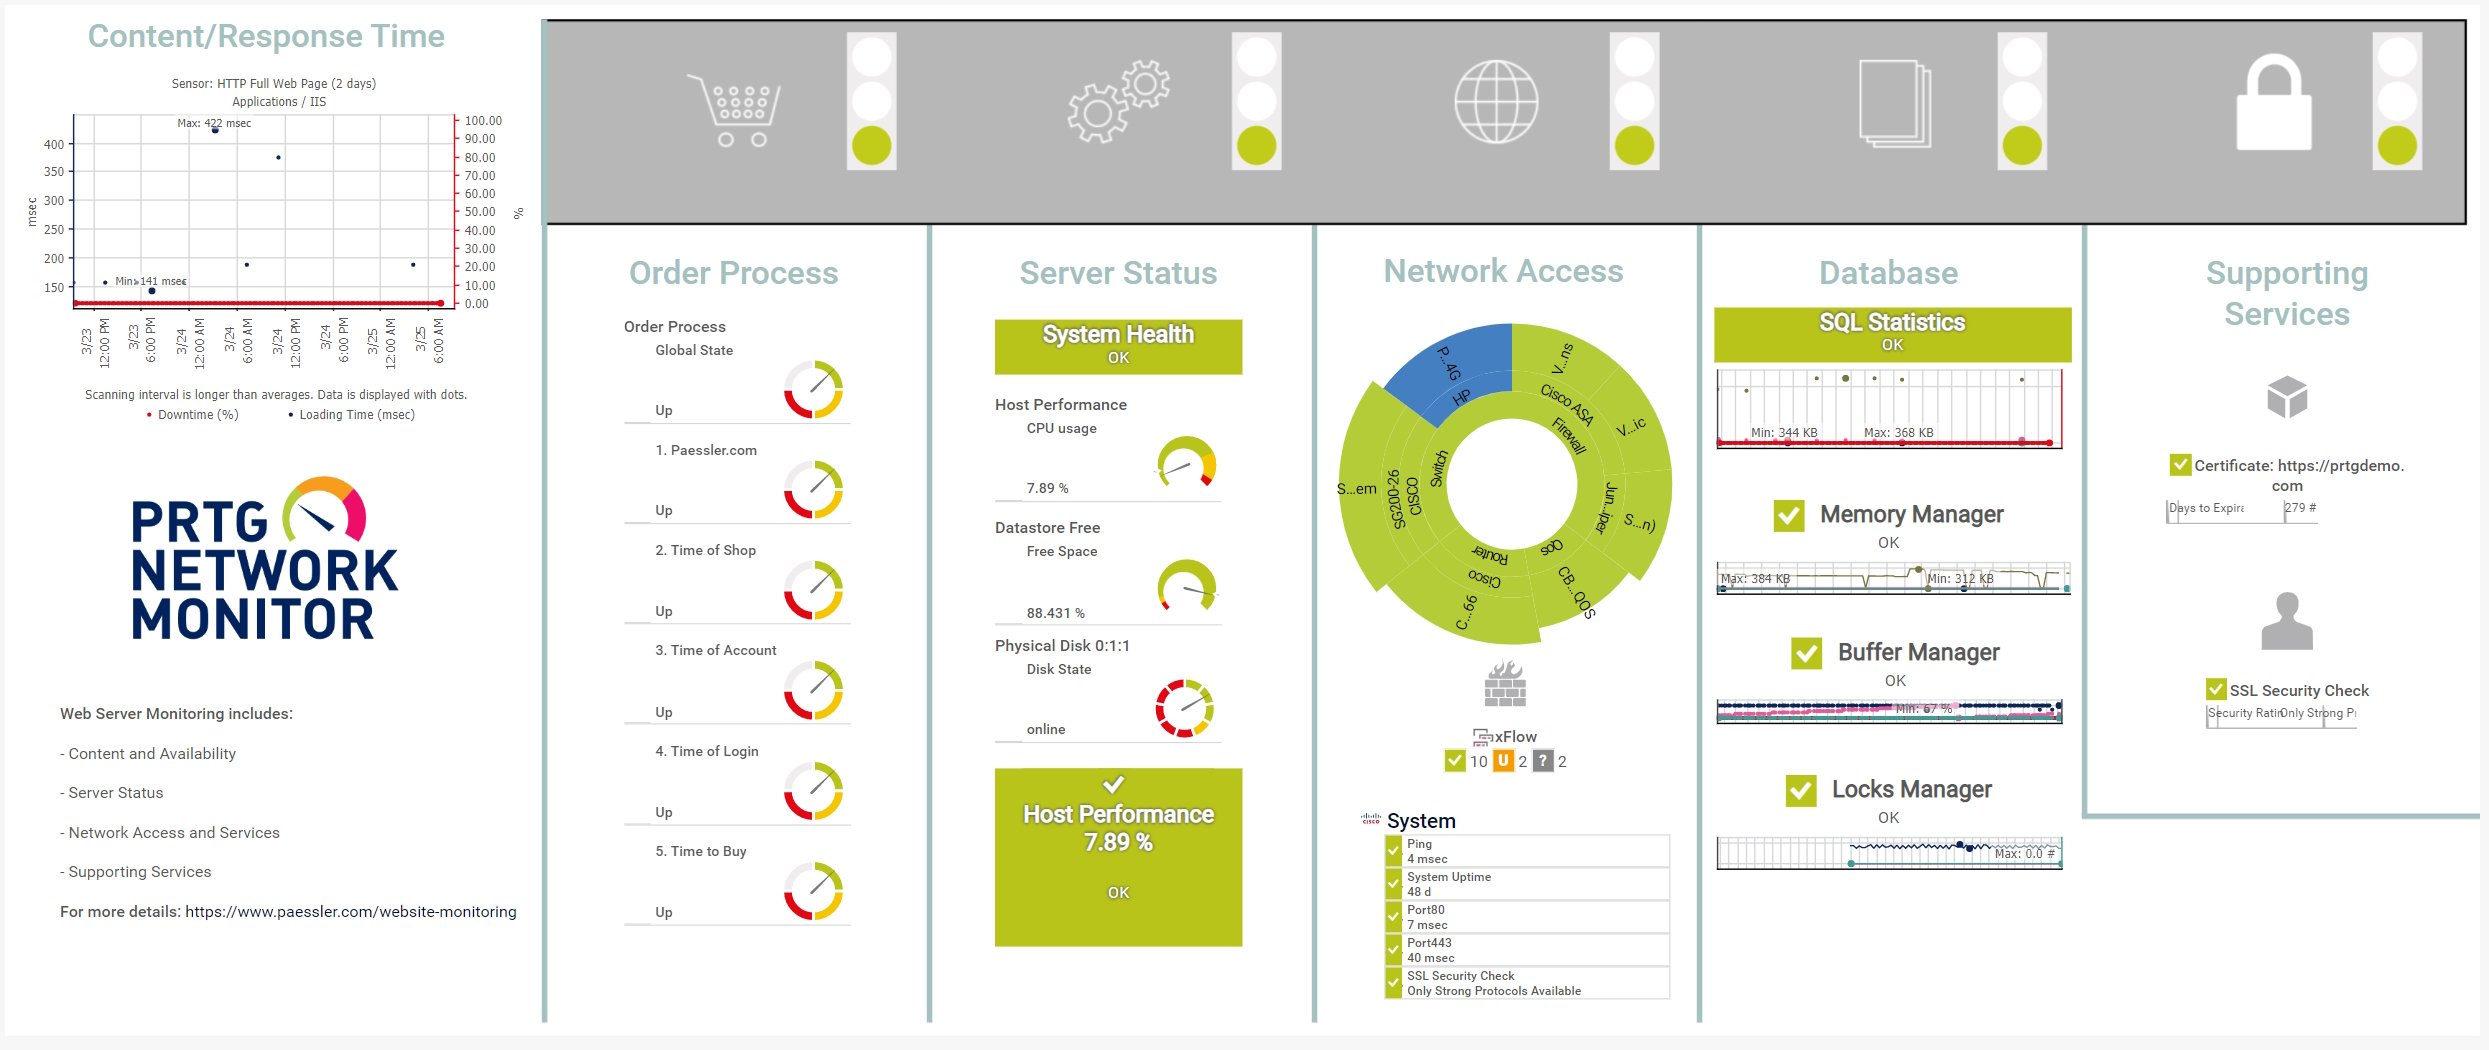
Comprehensive web server monitoring at a glance – from order process to supporting services.

Device tree view of the complete monitoring setup

Custom PRTG dashboard for keeping an eye on the entire IT infrastructure

Live traffic data graph in PRTG
“All-around winning
network monitor”
“The real beauty of PRTG is the endless possibilities it offers”
“PRTG Network Monitor
is very hard to beat”
PRTG gives you the clarity, control, and confidence to keep every API, website, and app running like a dream. Don't just watch it – control it.
If your web service, website, or application goes down, you'll know before your customers do. PRTG alerts you via SMS, email, push notification, and other methods.
Stay ahead of service interruptions, avoid complaints, and keep your business running smoothly. Customizable thresholds let you decide what issues require immediate action so you're not overwhelmed by alert fatigue.
Stop juggling multiple tools – PRTG brings them all together. Our software provides website monitoring, database monitoring, firewall monitoring, server monitoring, uptime monitoring, cloud monitoring, and more from a single, centralized dashboard.
See it all in one place, and manage your entire IT infrastructure like a pro. This consolidation reduces tool sprawl, cuts costs, and simplifies monitoring for your DevOps team.
PRTG plays nice with everyone. It supports monitoring a wide range of software, hardware, and service providers, including Microsoft and Linux, popular APM tools, and frontend technologies.
From cloud platforms to on-premise infrastructure, integration with hybrid IT environments is easy, whether you're working with Windows servers, gateways, or custom-built applications.
Skip the headaches of starting from scratch. PRTG web service monitoring comes with many pre-configured sensors that start monitoring in minutes.
Just set up, activate, and you're ready to track every aspect of your web services with minimal hassle. Reduce onboarding time with PRTG and let your team focus on critical development tasks.
PRTG comes with more than 250 native sensor types for monitoring your entire on-premises, cloud, and hybrid cloud environment out of the box. Check out some examples below!
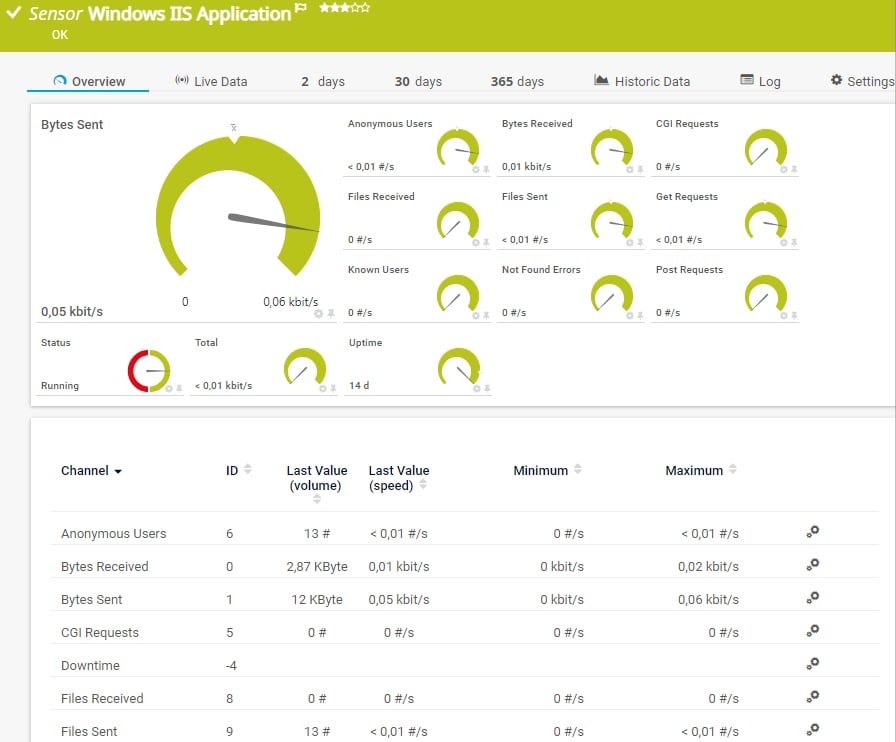
The Windows IIS Application sensor monitors a Microsoft Internet Information Services (IIS) server via Windows Management Instrumentation (WMI). It can also monitor applications that use IIS, such as Microsoft SharePoint or Microsoft Reporting Services (SSRS). It can show the following and more:
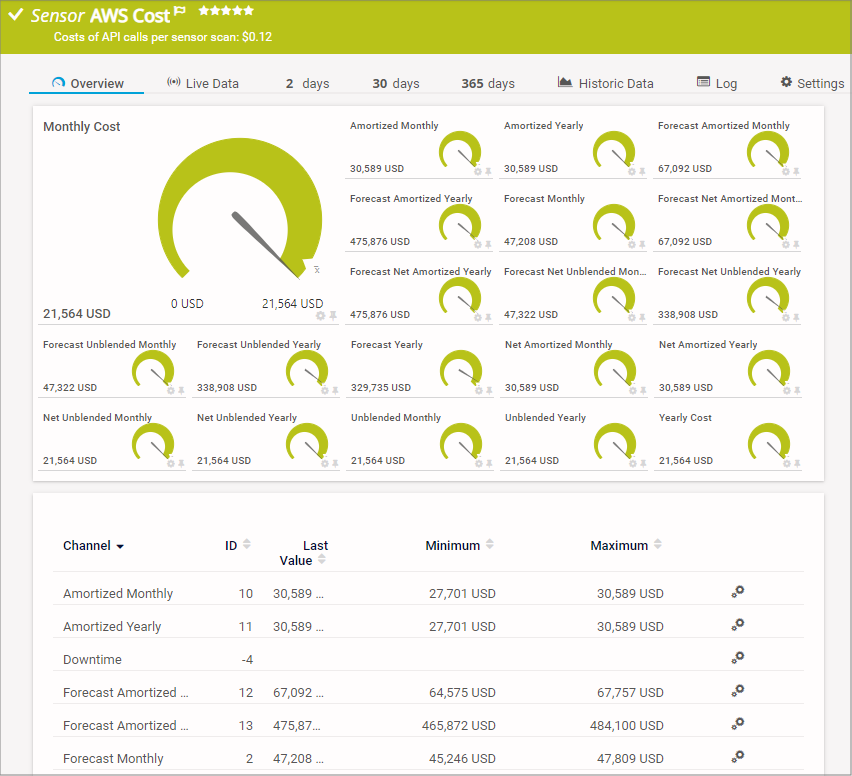
The AWS Cost sensor monitors the cost of an Amazon Web Services (AWS) account by reading its data from the AWS Cost Explorer API. It can show the following:
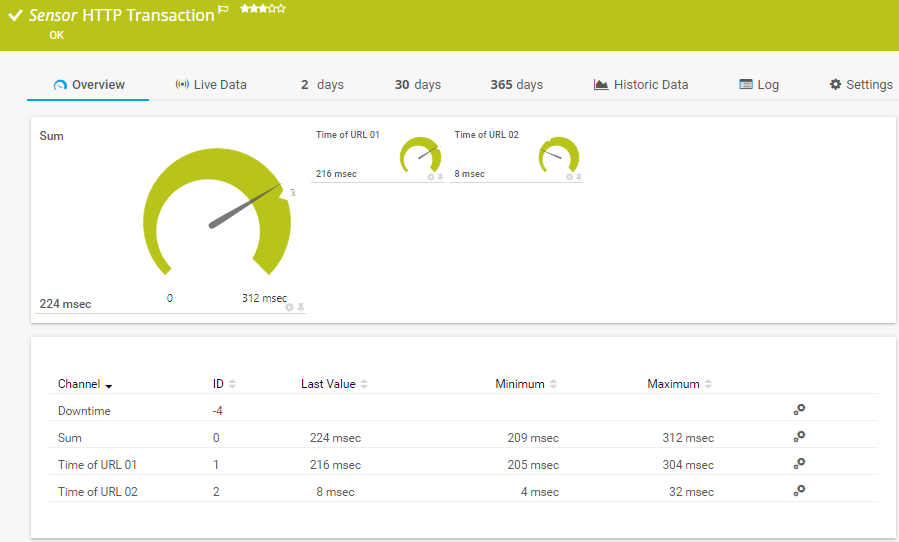
The HTTP Transaction sensor monitors an interactive website, such as a web shop, by performing a transaction using a set of HTTP URLs. The sensor monitors whether logins or shopping carts work properly. It can show the following:
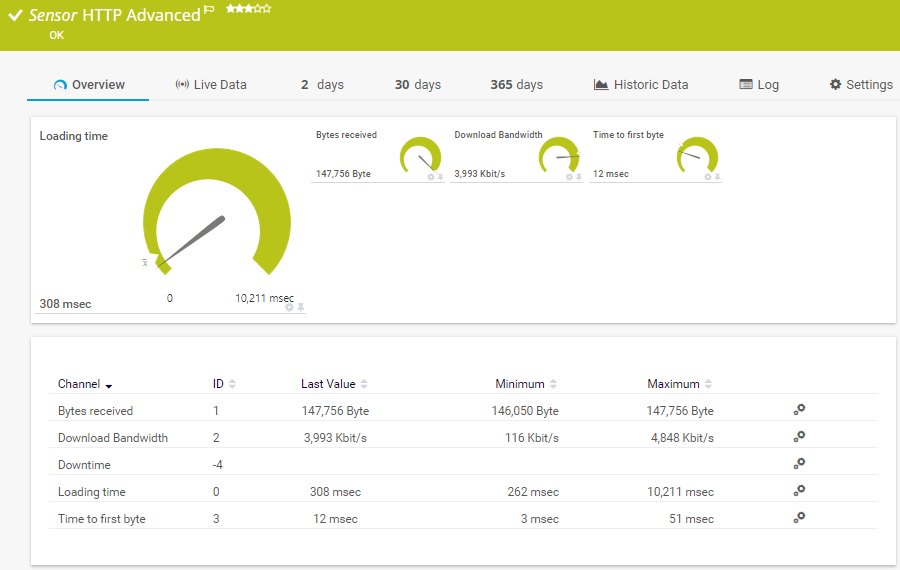
The HTTP Advanced sensor monitors the source code of a web page using HTTP. It supports authentication, content checks, and other advanced parameters. It can show the following:
See the PRTG Manual for a list of all available sensor types.

Real-time notifications mean faster troubleshooting so that you can act before more serious issues occur.
PRTG is set up in a matter of minutes and can be used on a wide variety of mobile devices.

Paessler is a certified partner in the Amazon Web Services ecosystem, which includes a growing community of software vendors who are building solutions on cloud computing.
What does this mean for you?
Partnering with innovative IT vendors, Paessler unleashes synergies to create
new and additional benefits for joined customers.
By integrating PRTG with Martello iQ, you can add a fast analytics layer to improve uptime, visualize your IT environment, and integrate all of your IT systems into a single pane of glass.
With ScriptRunner Paessler integrates a powerful event automation platform into PRTG Network Monitor.
UVexplorer integrates tightly with PRTG to bring fast and accurate network discovery, detailed device inventory, and automatic network mapping to the PRTG platform.
Custom alerts and data visualization let you quickly identify and prevent service disruptions and other performance issues.
Network Monitoring Software – Version 25.3.110.1313 (August 27, 2025)
Download for Windows and cloud-based version PRTG Hosted Monitor available
English, German, Spanish, French, Portuguese, Dutch, Russian, Japanese, and Simplified Chinese
Network devices, bandwidth, servers, applications, virtual environments, remote systems, IoT, and more
Choose the PRTG Network Monitor subscription that's best for you


Web service monitoring tracks the health, availability, and performance of web applications, websites, and APIs. PRTG's monitoring tool provides insights into response times, SSL/TLS certificate status, and HTTP errors, helping you identify and resolve problems before users notice. Get constant observability of all critical services and improve service continuity.
Because customers and end users expect fast, reliable websites and online services. Downtime can mean lost revenue and a bad user experience. PRTG gives you peace of mind, keeping your services online, optimized, and secure.
PRTG's SSL certificate sensors track the expiration dates of TLS/SSL certificates for websites and web services. You'll receive notifications well in advance so you can renew certificates before they expire. With proactive alerts, you'll avoid service interruptions and maintain user trust.
PRTG uses a variety of protocols, including HTTP and HTTPS, WMI, SSL, and custom REST API integrations. These technologies allow it to track web performance and capture data on uptime, response times, and errors. You get surprisingly seamless integration with your existing frameworks and web infrastructure.
In PRTG, “sensors” are the basic monitoring elements. One sensor usually monitors one measured value in your network, for example the traffic of a switch port, the CPU load of a server, or the free space on a disk drive. On average, you need about 5-10 sensors per device or one sensor per switch port.
Paessler conducted trials in over 600 IT departments worldwide to tune its network monitoring software closer to the needs of sysadmins. The result of the survey: over 95% of the participants would recommend PRTG – or already have.

Paessler PRTG is used by companies of all sizes. Sysadmins love PRTG because it makes their job a whole lot easier.
Bandwidth, servers, virtual environments, websites, VoIP services – PRTG keeps an eye on your entire network.
Everyone has different monitoring needs. That’s why we let you try PRTG for free.