- English
- Deutsch
- Español
- Français
- Italiano
- Português
Good Domain Name System (DNS) monitoring goes beyond checking whether a server responds. It covers resolution health, record integrity, response time trends, and enough infrastructure context to actually identify root causes. Paessler PRTG gives you all of that from a single platform, with the DNS v2 Sensor supporting A, AAAA, CNAME, TXT (incl. SPF/DKIM), PTR, SOA, SRV, and NS record types.
Beyond DNS records, PRTG natively monitors the infrastructure DNS depends on: DHCP servers via the DHCP Sensor, Active Directory domain controllers via the AD Replication Errors Sensor, routers and switches via SNMP, Windows infrastructure via WMI, and traffic flow data (NetFlow, sFlow, IPFIX, jFlow) from devices configured to export it. All of that feeds into the same dashboards and alerting system.

Continuous resolution checks give you confirmation that DNS is working across all monitored records. PRTG surfaces status changes the moment they happen, so your team has context and can act while the outage is still fresh.
PRTG polls defined DNS records at set intervals and changes Sensor status the moment resolution fails or response time crosses a threshold. Notifications go out via email, SMS, Teams, webhook, or other supported channels, so you can act before tickets start coming in.
Tracking A records and TXT records for unexpected changes keeps email delivery, internal services, and SPF validation intact. PRTG compares resolved results against a defined filter on every poll and alerts you immediately when something shifts, so your team has the signal early.
PRTG compares resolved results against a defined filter on every poll. If a record count shifts or a record resolves to an unexpected IP address or value, Sensor status changes and a notification goes out. PRTG tells you that something changed. To find out who changed it, your DNS server logs or SIEM have the audit trail.
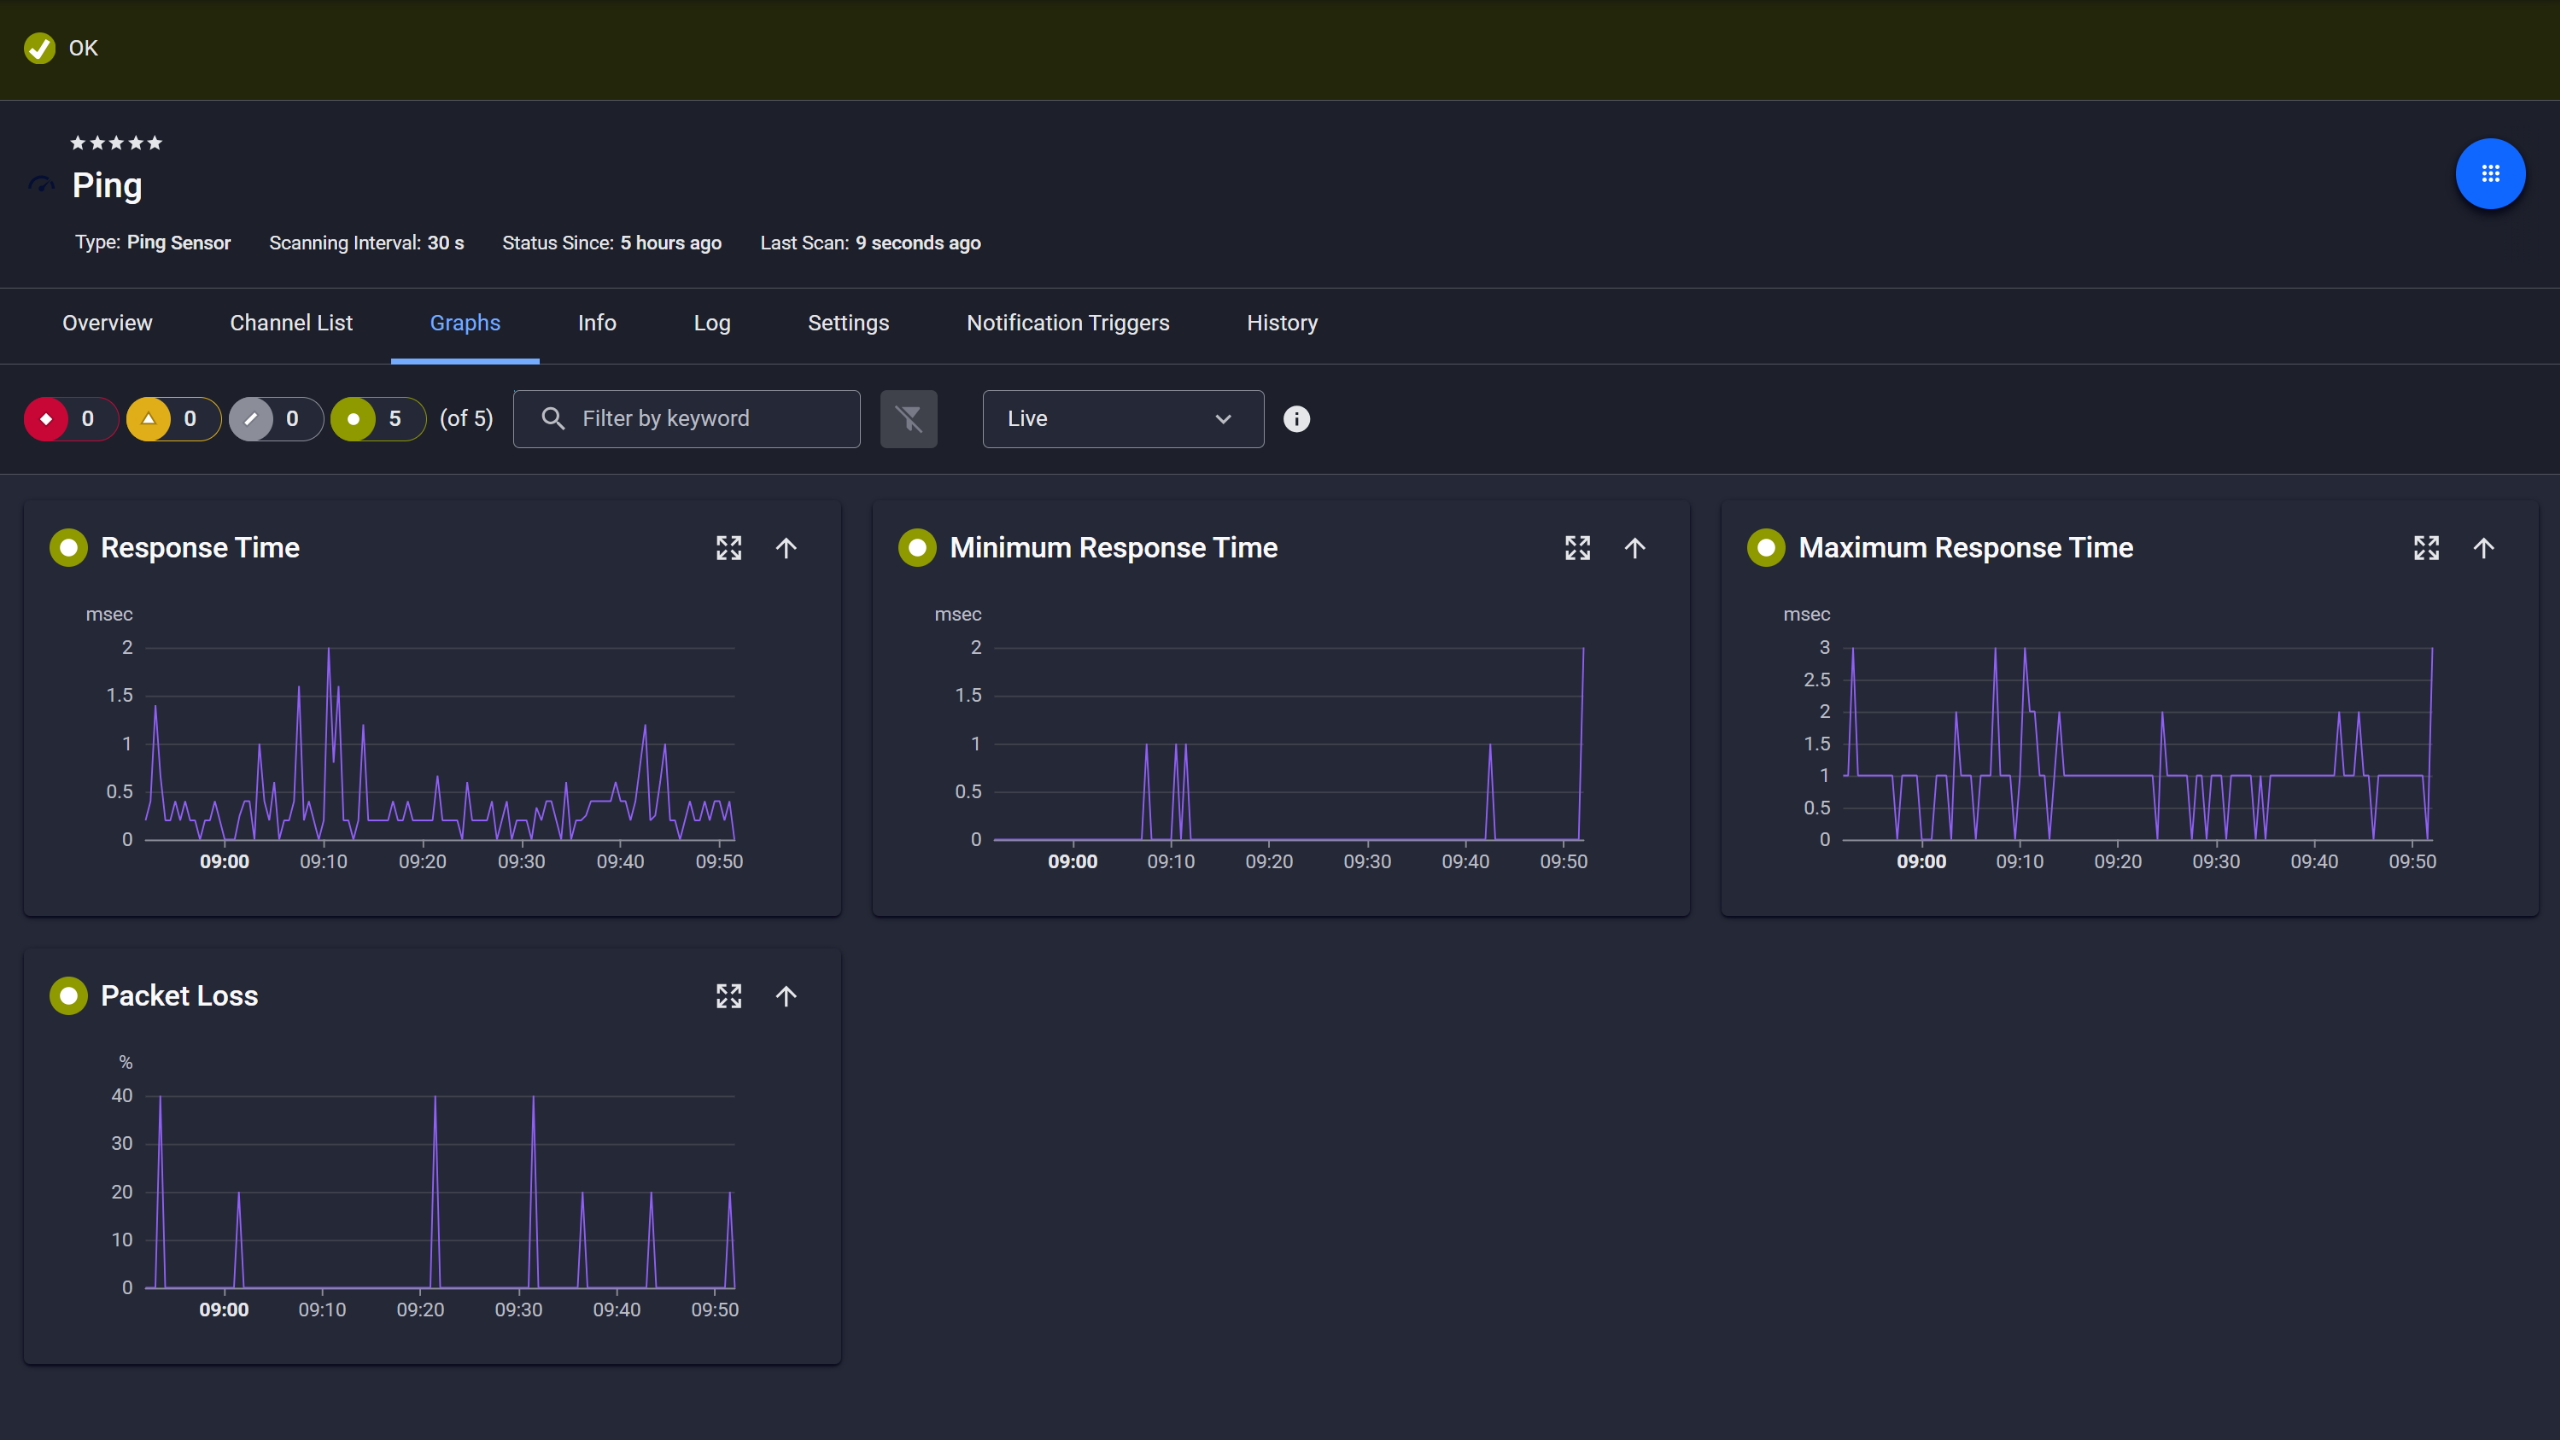
Ping response and packet loss

Live graphs, real-time performance data
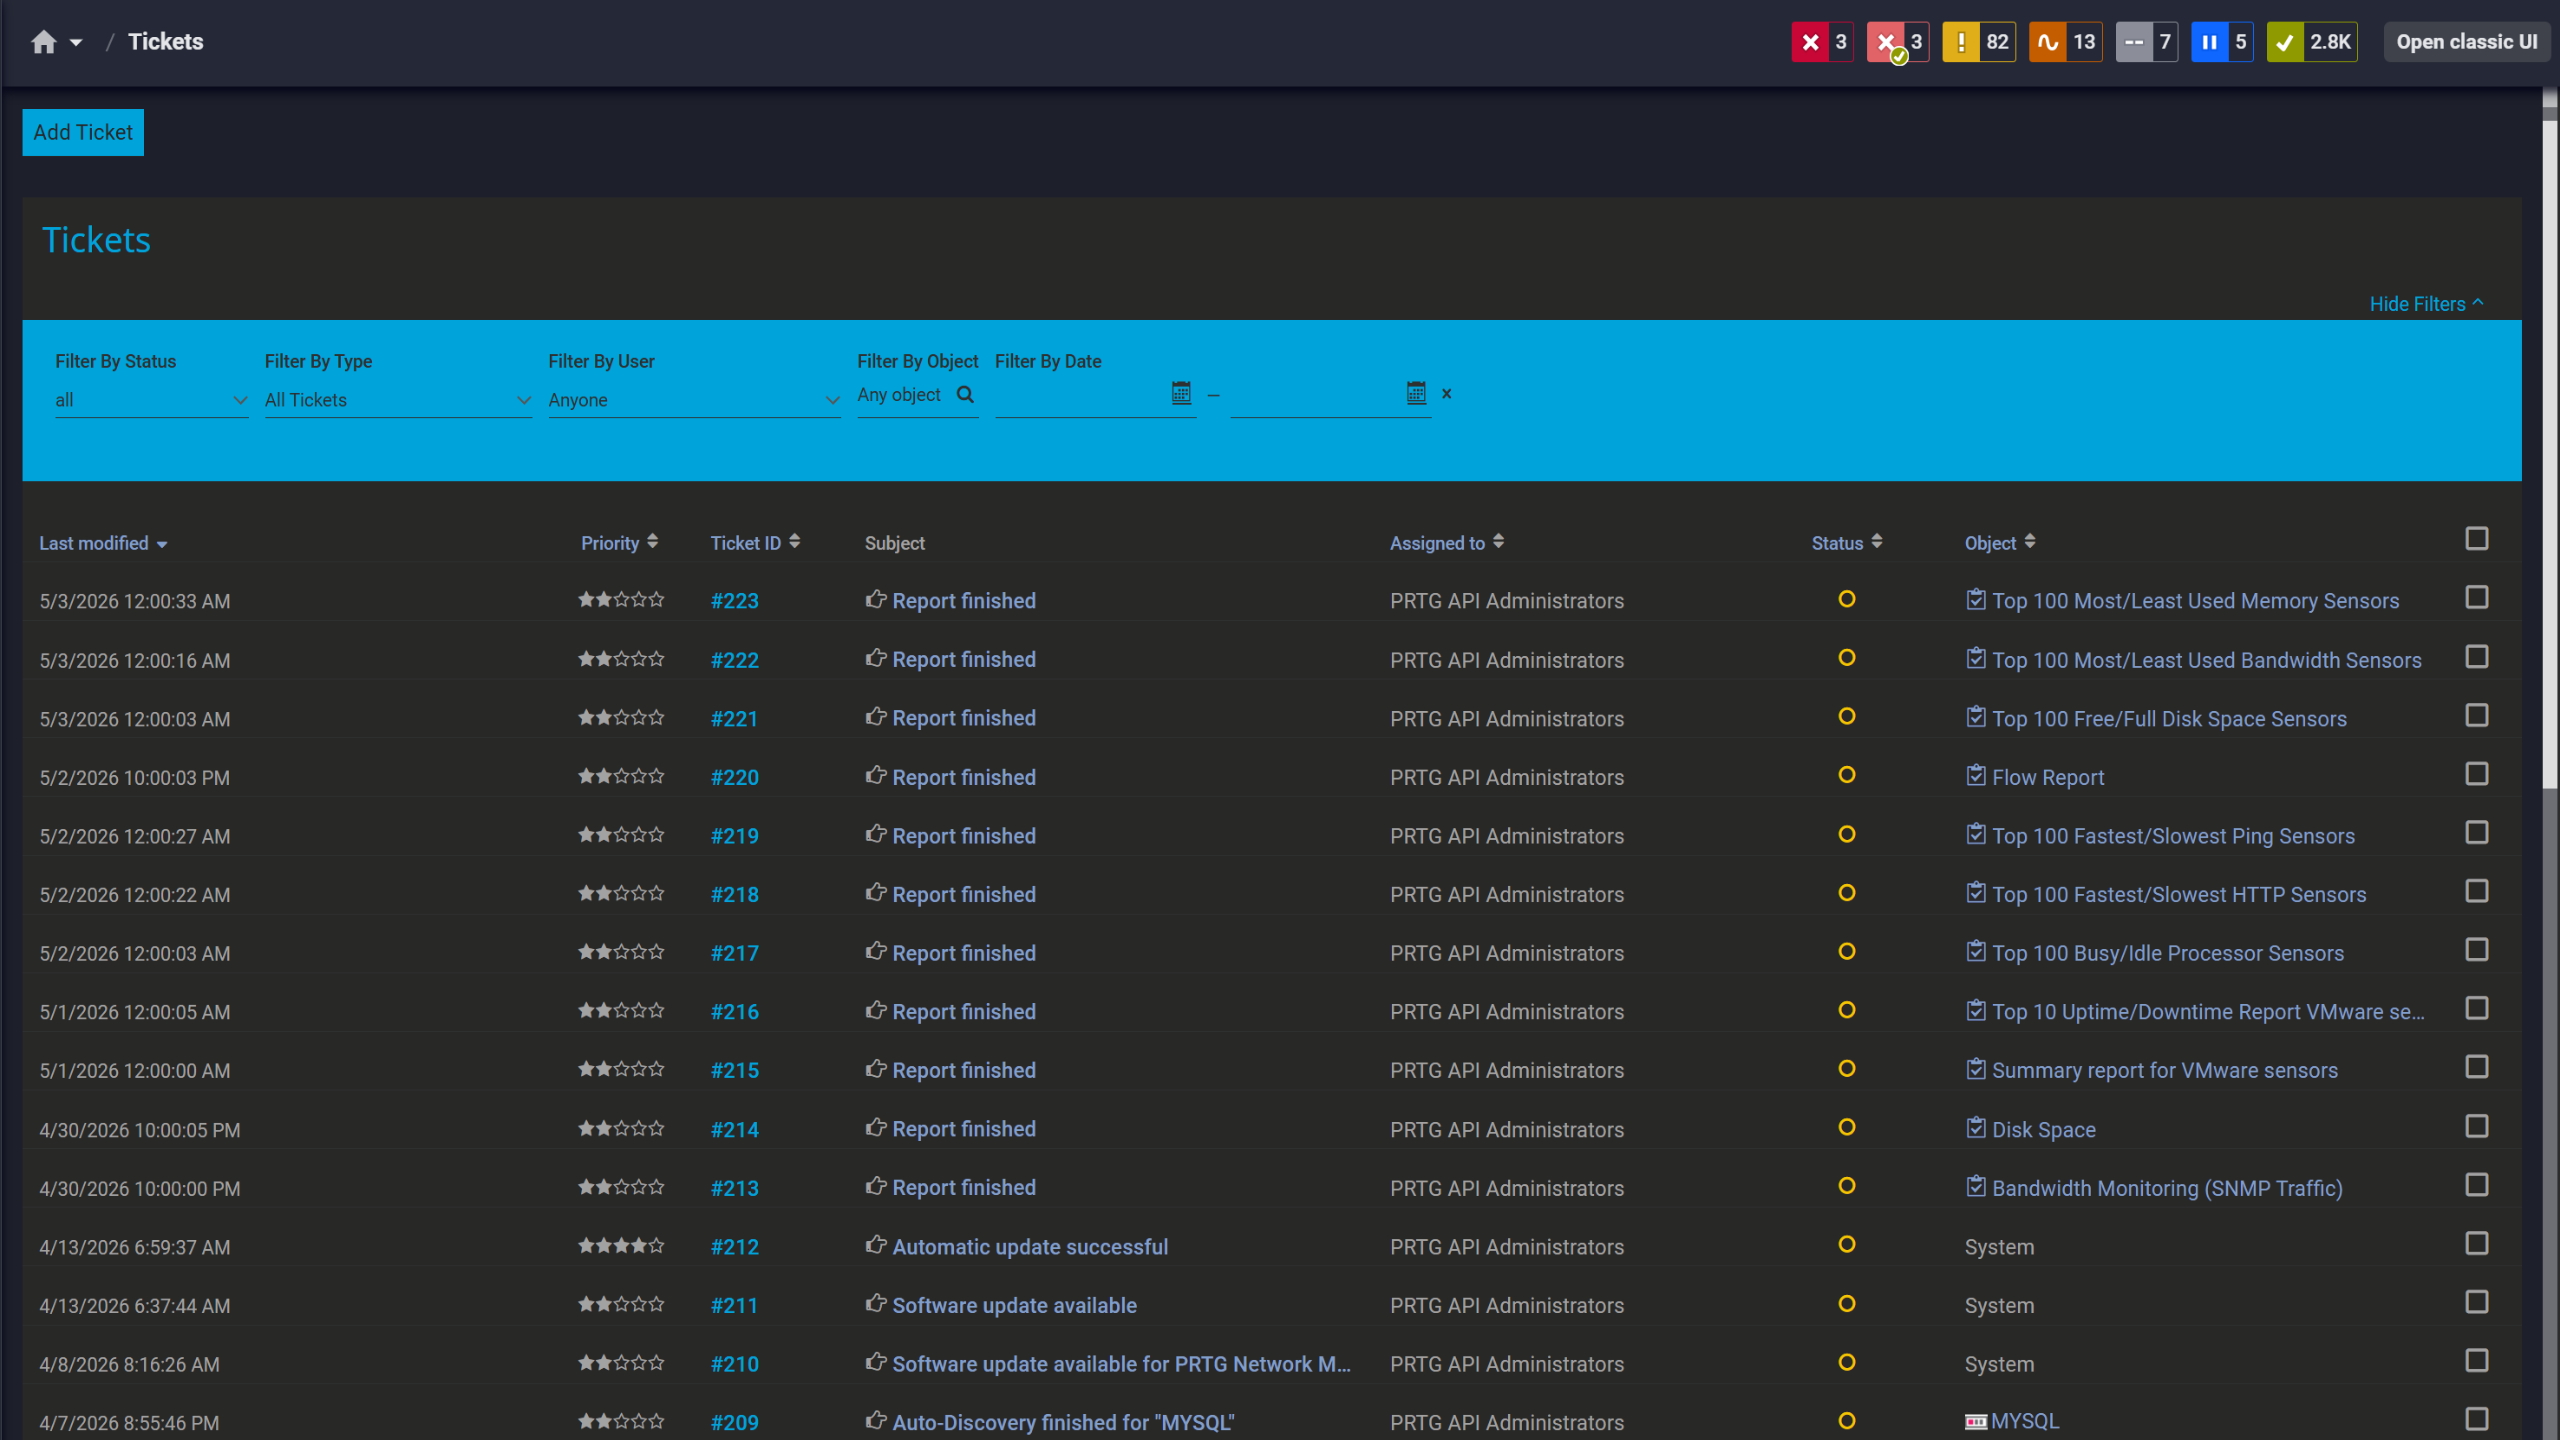
Tickets keep your team aligned
DNS response time trends tell you more than any single measurement. A resolver that answered in milliseconds months ago and now takes noticeably longer shows a pattern worth investigating. With historical data, you have a concrete baseline to compare against and a clear view of when the shift started.
PRTG stores response time history per Sensor, giving you a real foundation for performance troubleshooting. Set warning and error thresholds, get notified when response times cross them. Trend graphs across weeks or months give you a concrete baseline for capacity planning conversations. Actual metrics instead of guesswork.
Start monitoring your infrastructure in minutes. No professional services, no complex configuration, no risk.
Organizations with multiple locations typically run a local DNS resolver at each site. PRTG gives central IT direct visibility into every location's resolver health, so each site's DNS status is confirmed from one dashboard rather than pieced together from local reports.
PRTG deploys lightweight remote probes at each site, all reporting back to a central instance. DNS service health per location shows up in one dashboard, with per-site drill-down available. Notifications are assignable per user or user group and per monitoring scope, so the right people get alerted for the right location. No need to route everything through a central team.

Scheduled reports, always on time
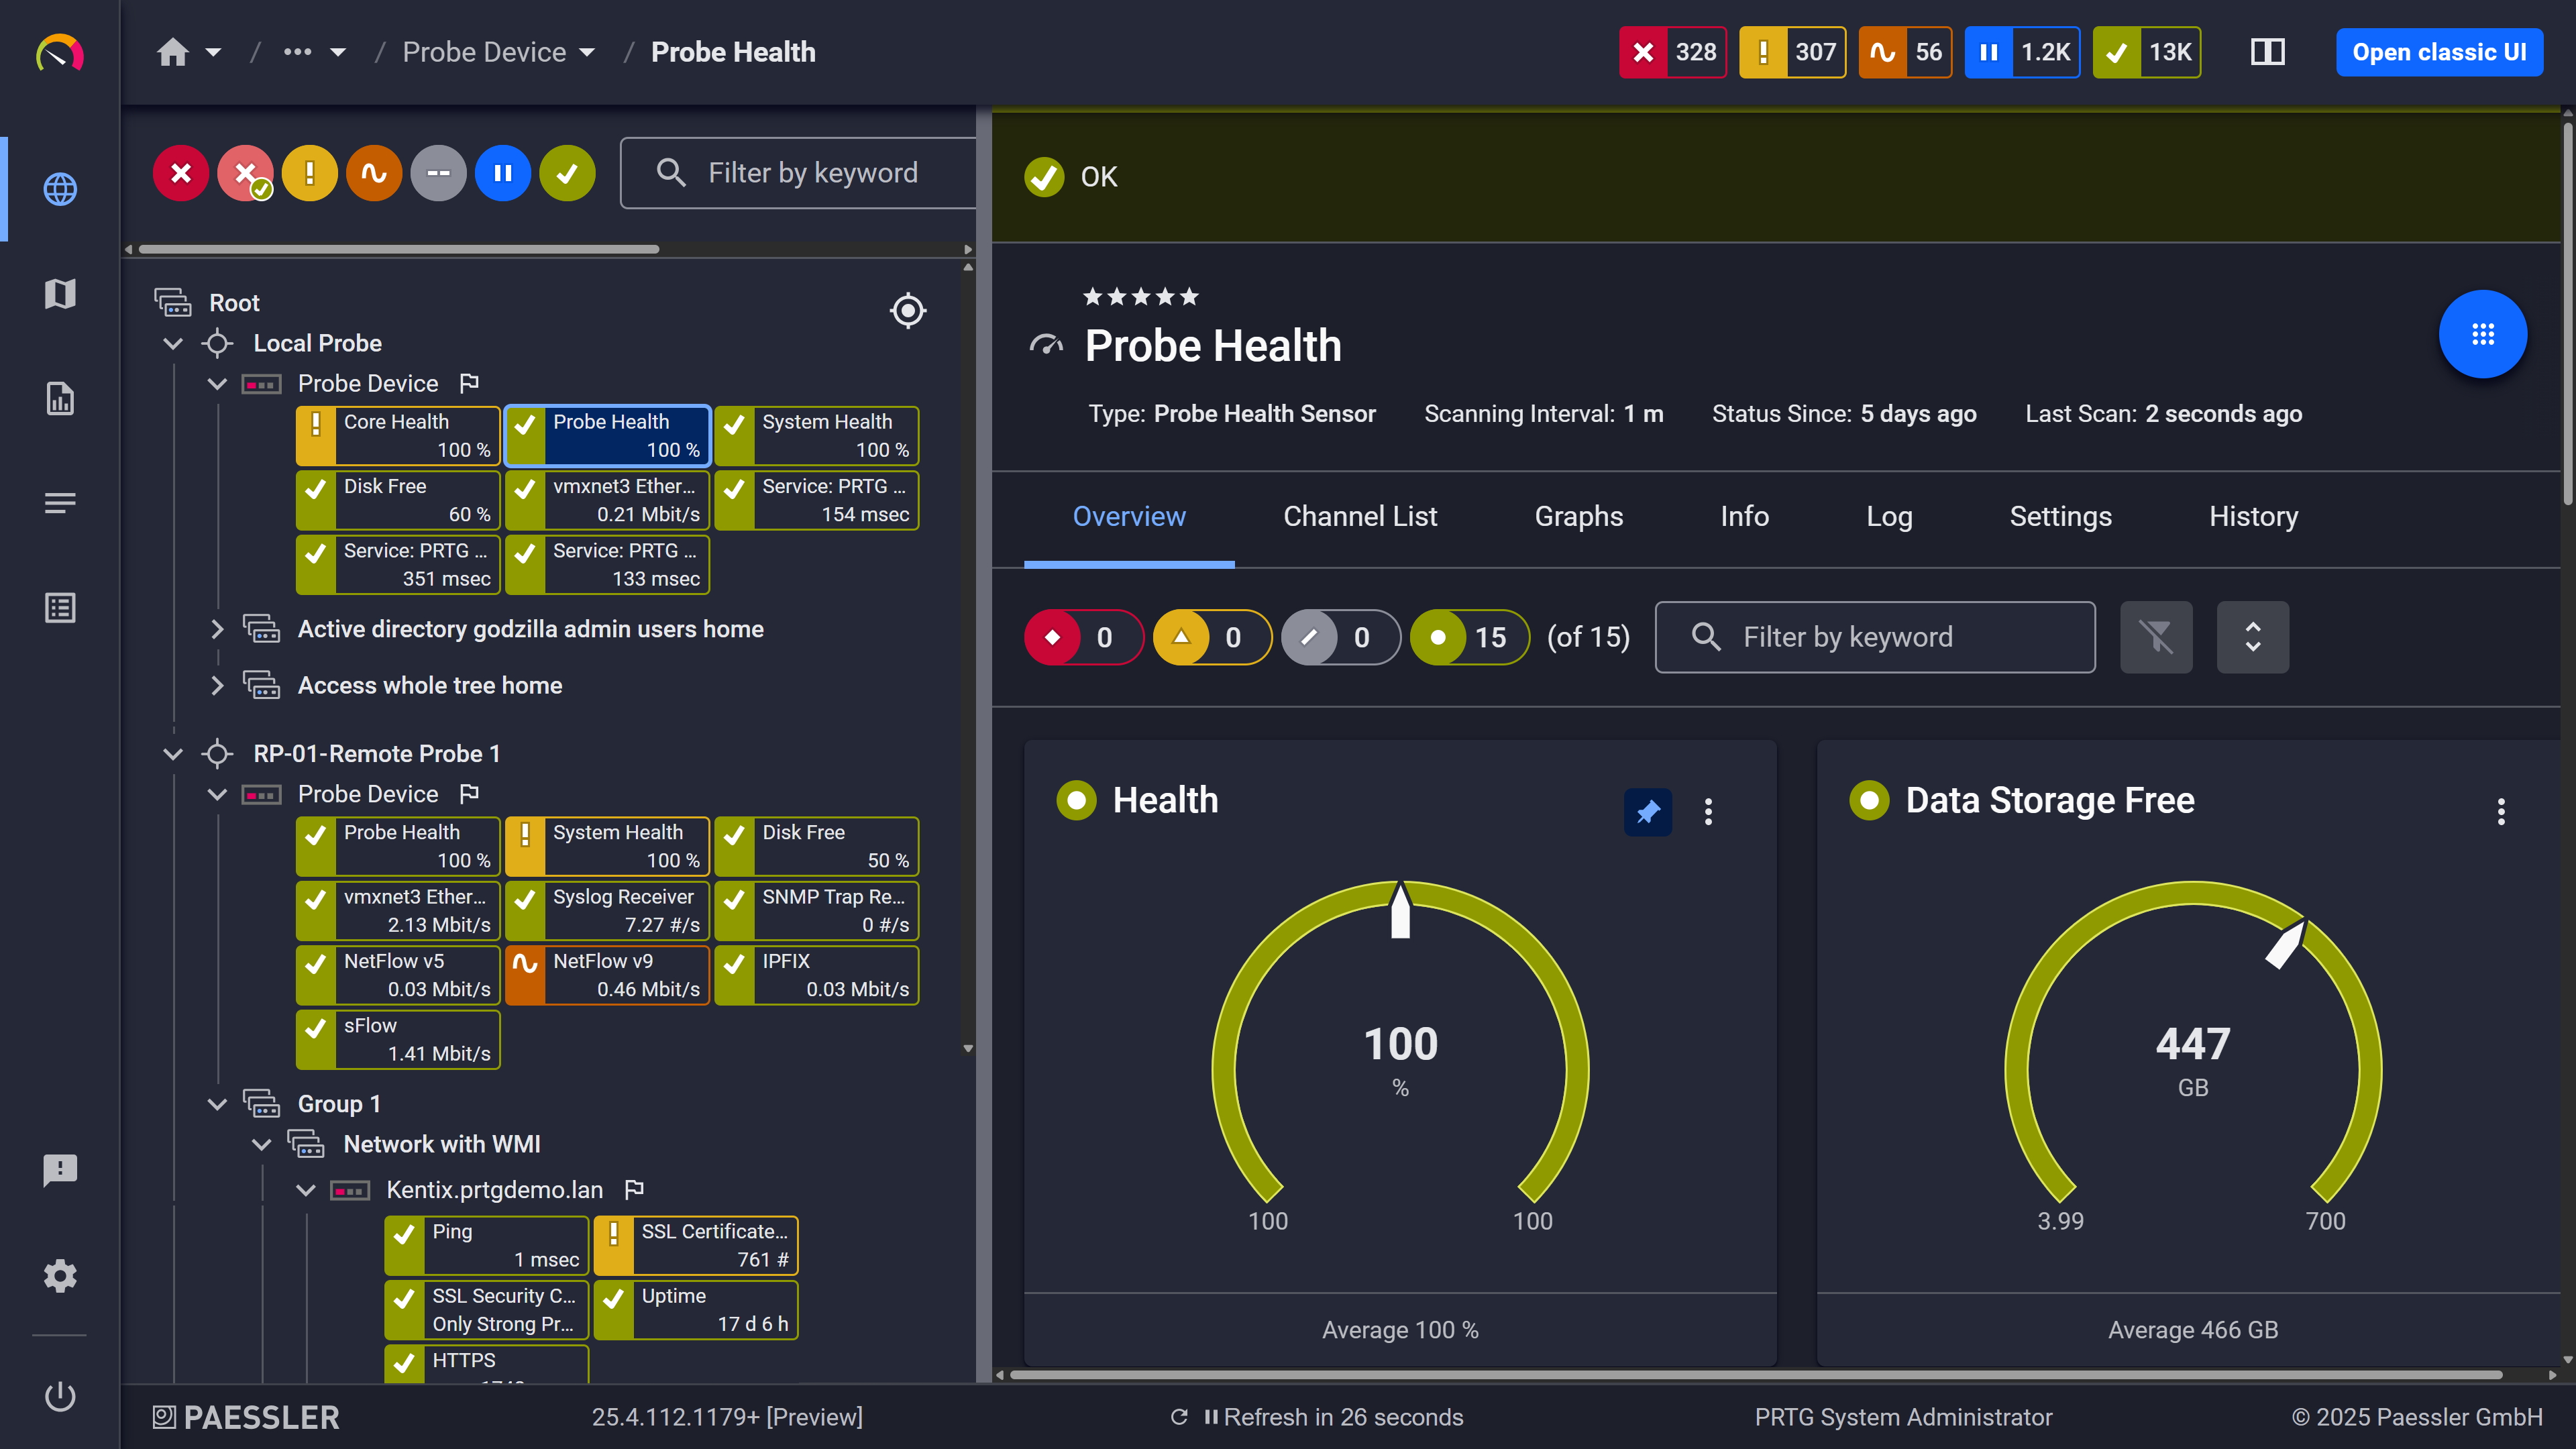
Probe health at a glance

Full device list, instant overview
Here's how PRTG monitors DNS — the methods, Sensor types, and protocols it uses.
Note: This is an overview of the how, not a setup guide.
What you need to know | Without PRTG Without PRTG | With PRTG With PRTG |
|---|---|---|
Resolution failure | Without PRTG Reported by users | With PRTG Alerted at next polling cycle |
Record change | Without PRTG Found during troubleshooting | With PRTG Flagged via filter comparison |
Response time trend | Without PRTG No historical data | With PRTG Stored, graphed, threshold-alertable |
Multi-site DNS health | Without PRTG Requires local checks at each site | With PRTG Single dashboard via remote probes |
Possible network cause | Without PRTG Separate tools, no shared context | With PRTG DNS + network data in one platform |
Choose the PRTG Network Monitor subscription that's best for you.
| License Name | License description | Price | License Details | Get started | Pricing Details | |
|---|---|---|---|---|---|---|
| PRTG 500 | $200 | per month paid annually | Buy nowBuy now | Enough to monitor multiple aspects of 50 devices | ||
| PRTG 1000 | $358 | per month paid annually | Buy nowBuy now | Enough to monitor multiple aspects of 100 devices | ||
| PRTG 2500 | $742 | per month paid annually | Buy nowBuy now | Enough to monitor multiple aspects of 250 devices | ||
| PRTG 5000 | $1,300 | per month paid annually | Buy nowBuy now | Enough to monitor multiple aspects of 500 devices | ||
| PRTG 10000 | $1,642 | per month paid annually | Buy nowBuy now | Enough to monitor multiple aspects of 1000 devices |

DNS monitoring tracks whether DNS records resolve correctly, how fast they resolve, and whether the results match what they're supposed to return. Depending on the tool and configuration, it can also track record count changes, response time trends over time, and server availability. The point is ongoing visibility into DNS health, not a manual check that only runs when something is already broken.
PRTG's DNS v2 Sensor supports A, AAAA, CNAME, TXT (including SPF and DKIM), PTR, SOA, SRV, and NS record types. As a general DNS concept: TTL controls how long a DNS cache holds a record before the resolver queries again. It's part of DNS record configuration on your nameservers, not something the DNS v2 Sensor measures directly.
Yes. Each DNS v2 Sensor targets a specific DNS server, so you configure it to query internal resolvers for private zones or external resolvers for public-facing records. This also works for monitoring records managed by external DNS providers. You can run the same domain through multiple resolvers to check for inconsistencies between nameservers. That's useful for catching propagation issues or misconfigured on-premises DNS servers.
When DNS issues surface, the first question is usually whether the problem is in resolution itself, in record configuration, or somewhere upstream in the network. PRTG keeps response time history and status logs per Sensor, so you can see exactly when a response time started climbing or when resolution began failing, and correlate that against network data on the same platform. That context considerably speeds up troubleshooting.
Partially. PRTG can confirm that a DNSKEY record exists and resolves. It does not validate DNSSEC chain integrity, verify cryptographic signatures, or check trust anchor chains. If full DNSSEC validation is a hard requirement, that needs a dedicated DNSSEC-aware resolver or validation tool. PRTG's role here is confirming record presence and resolution. Not signature verification.
DNS rarely fails in isolation. Latency spikes often trace back to upstream congestion, packet loss, or routing changes. Because PRTG monitors DNS alongside routers, switches, and traffic flows (NetFlow, sFlow, IPFIX, jFlow) in one platform, you can check whether network-level disruptions explain a DNS issue without switching tools. Flow data also shows traffic volume spikes that may put DNS infrastructure under abnormal load.
A Sensor is the basic monitoring unit in PRTG. Each one monitors a single, specific thing: a DNS record, a service, a network interface, a response time. Sensors report status, collect metrics, and send notifications when thresholds are crossed. PRTG covers DNS as part of a broader monitoring solution, with network, servers, and applications alongside it. PRTG also provides an API for custom Sensor development and integrations with external tools when your environment calls for it.
Network Monitoring Software – Version 26.1.116.1532 (February 9th, 2026)
Download for Windows and cloud-based version PRTG Hosted Monitor available
English, German, Spanish, French, Portuguese, Dutch, Russian, Japanese, and Simplified Chinese
Network devices, bandwidth, servers, applications, virtual environments, remote systems, IoT, and more
Choose the PRTG Network Monitor subscription that's best for you


