
years in
network monitoring
IT professionals work
with Paessler
MSPs run client
monitoring on PRTG
regions: North America,
EMEA, APAC, LATAM
Joining the Paessler MSP Program gives you a commercial model built around your growth.
The more you monitor for clients, the more the economics work in your favor. Your Paessler account team confirms the specific numbers, sensor volume, term, and discount tier, based on your existing customer base and where you want to take it.
When you partner with Paessler, you bring your customers and managed services expertise, and we'll help with the rest. Our MSP team takes the time to understand your business and growth ambitions, then works with you to define the right sensor volume, contract term, and certification path for your needs, because growth isn't one-size-fits-all. Wherever you are in your MSP journey, we're committed to helping you scale, expand your services, and grow with confidence.
What you get in return: A tiered discount structure that scales with your sensor volume, so your margins improve as your monitoring practice grows. On top of that: dedicated sales resources, quarterly business reviews to align on growth, marketing development funds (MDF), and an official listing on Paessler's MSP page to help new customers find you. Your Paessler account team will walk you through exactly where you land once they know your client base.
MSPs offering PRTG as a managed service commonly see 30–50% margins on that recurring monitoring layer, turning monitoring into billable insight instead of overhead.
...but the real question is whether you can service them profitably. More endpoints per client, tighter SLAs, and constant price pressure are squeezing margins even as revenue grows, and every extra monitoring dashboard you bolt on adds licensing cost and engineer context-switching instead of relief. MSP network monitoring should absorb that pressure instead of adding to it.
Managed service provider monitoring needs to hold up against dozens of client networks, shared infrastructure, and constant onboarding. PRTG is built for exactly that: multi-tenant by design, agentless to deploy, and able to scale through auto-discovery instead of manual setup. Here's what to look for in MSP monitoring tools, and how PRTG delivers it across network devices, servers, and cloud workloads for every client you run.
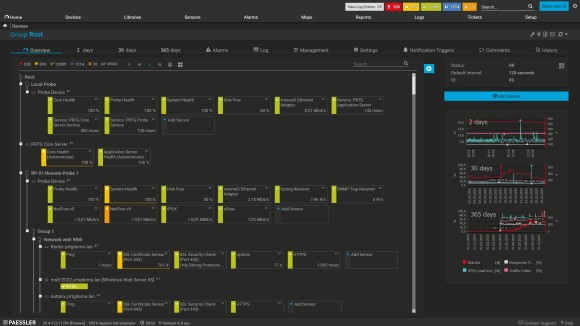
PRTG's multi-tenant architecture gives each client their own scoped view of devices, sensors, dashboards, and reports inside one shared platform. You set access rights per client group, so each customer sees only their own environment, while you keep a single, unified view across your whole portfolio from one login. As your client base grows, that same access-rights model scales with it: new clients get their own scoped group, without you rebuilding the structure underneath them. For larger or more segmented client bases, Paessler PRTG MSP Edition supports separate databases per instance, giving you a further layer of isolation between clients as your portfolio scales.
Client-facing, white-labeled dashboards and SLA reports turn your monitoring data into the evidence that justifies renewals, without manual report-building before a client call.
New client sites go live through auto-discovery and remote probes. PRTG scans the network, proposes devices and sensors automatically, and connects distributed sites back to your central instance without a site visit. Less time onboarding and configuring means more time delivering services, winning customers, and growing recurring revenue.
Role-based access control lets you decide exactly what each client, and each of your own technicians, can see or change, so clients only ever view their own monitoring data. Combined with encrypted communication between probes and your central server, this gives you a clear answer when a client's security team asks how visibility is restricted between tenants. For clients who need separation beyond shared-instance access control, Paessler PRTG MSP Edition also supports running them on fully separate instances.

Flexible, sensor-based licensing means your monitoring cost grows in step with your client base rather than in unpredictable jumps, so you can price services against a clear, forecastable cost basis.
PRTG is integration-ready with RMM, PSA, SIEM, and ITSM platforms, so monitoring doesn't become another disconnected tool in your stack. PRTG connects through an open API, and ServiceNow and HaloPSA/HaloITSM each publish their own PRTG connector. For broader ITSM and asset-management reach, Paessler PRTG UVexplorer adds integrations with Asset Panda, Hudu, IT Glue, Jira, Lucidchart, and Patch Manager.

F.T.P., an Italian MSP, centrally monitors 40 clients through PRTG Enterprise Monitor in a Monitoring-as-a-Service model, and has sharply cut downed-server support calls by catching misconfigurations before they reach clients.

Flexible, threshold-based alerting and automation catch issues before clients notice, reducing the noise your engineers have to triage, and protecting the SLAs you've promised.
Submit the registration form and a member of our partner team will confirm your fit against the program requirements and walk you through next steps
Watch the on-demand demo to understand how PRTG supports multi customer environments, automation, alerting, and reporting for MSPs.
PRTG doesn't publish Paessler-built RMM connectors directly, but it integrates via API, and platforms like ServiceNow and HaloPSA/HaloITSM maintain their own PRTG connectors. Paessler PRTG UVexplorer extends this further with direct integrations into Asset Panda, Hudu, IT Glue, Jira, Lucidchart, and Patch Manager.
PRTG gives each client a scoped view of their own devices, sensors, and reports inside one shared platform, controlled through per-client access rights. That gives you one pane of glass across your whole portfolio, without your clients seeing each other's data.
Yes. A free trial lets you test multi-tenant monitoring, auto-discovery, and reporting against a real client environment before you talk to the team about joining the MSP Program.
Most MSPs are fully onboarded within one to two weeks. The main factor is how quickly your team books in training. Move on that early, and you can be live in as little as a week.
Yes. NFR (Not For Resale) licenses let you run PRTG in real client environments to validate your service offering before you sell it, including live auto-discovery scans that double as a demo during early sales conversations.