• Company
    • About Us
    • Case Studies
    • Press Center
    • Careers
    • Blog
    • Contact us
  • Contact us
  • Login
 
  • English
    • Deutsch
    • Español
    • Français
    • Italiano
    • Português
Paessler
                    - The Monitoring Experts
  • Products
    • Paessler PRTG
      Paessler PRTGMonitor your whole IT infrastructure
      • PRTG Network Monitor
      • PRTG Enterprise Monitor
      • PRTG Hosted Monitor
      • PRTG UVexplorer
      • PRTG extensionsExtensions for Paessler PRTGExtend your monitoring to a new level
    • Icon Features
      FeaturesExplore all monitoring features
      • Maps & dashboards
      • Alerts & notifications
      • Multiple user interfaces
      • Distributed monitoring
      • Customizable reporting
  • Solutions
    • By TeamFor your organization size
      • Small Business IT
      • Mid-Market IT
      • Enterprise IT
      • MSP Network Monitoring
    • Industries
      By IndustryFor your business sector
      • Industrial
      • Healthcare
      • Government
      • Education
      • Data Center
      • Finance
    • IT Topics
      By Use CaseFor every technical scenario
      • Network Monitoring
      • Server Monitoring
      • OT Monitoring
      • Distributed Monitoring
      • Network Topology Mapping
      • SNMP Monitoring
      • Bandwidth Monitoring
  • Pricing
  • Resources
    • Getting Started
      Getting StartedModules for self-paced learning
    • How-to Guides
      How-to GuidesGet the most out of PRTG
    • Videos & Webinars
      Videos & WebinarsLearn from Paessler experts
    • IT  Knowledge
      IT KnowledgeExpand your IT knowledge
    • PRTG Manual
      PRTG ManualFull documentation
    • Knowledge Base
      Knowledge BaseShare community knowledge
    • PRTG Sensor Hub
      PRTG Sensor HubGet sensors, scripts & templates
    • Trainings
      PRTG TrainingLearn how to work with PRTG
  • Partners
    • Icon Handshake
      Become a PartnerFor resellers and channel partners
    • Icon MSP
      Become an MSPDeliver monitoring as a managed service
    • icon partner
      Partner PortalLog in to your partner account
    • Deal Registration
      Deal RegistrationRegister your sales opportunities
    • icon search
      Find a PartnerFind partners selling Paessler products
    • icon technology
      Technology AlliancesSee Paessler technology partnerships
    • Partner HubTools for Your Success
  • Company
    • About Us
    • Case Studies
    • Press Center
    • Careers
    • Blog
    • Contact us
  • Contact us
  • Login
  • English
    • Deutsch
    • Español
    • Français
    • Italiano
    • Português
  • Get a quote
  • Free trial

Unified Hardware Scanner 

Monitor server, network, and infrastructure hardware health across Dell, HPE, Cisco, and hundreds of device types from a single dashboard

Free download
PRODUCT OVERVIEW

How Do You Monitor Hardware Health Across a Mixed-Vendor Environment?  

Most environments run a mix of Dell servers, HPE ProLiant systems, Cisco switches, APC UPS units, and storage from various vendors. Pulling hardware health data out of all of them typically means logging into multiple vendor consoles, each with its own format, access method, and blind spots. The result is fragmented visibility that only shows part of the picture at any given time.  

Paessler PRTG consolidates this using SNMP, WMI, SSH, and WBEM to reach hardware across the stack and create vendor-specific sensors automatically during discovery. It tracks temperature, fan speed, power supply status, and hardware components from Dell PowerEdge servers, HPE ProLiant systems, Cisco UCS hardware, APC UPS devices, NetApp, Synology, Buffalo TeraStation, HP LaserJet printers, VMware ESXi hosts, Linux and macOS systems, Windows servers, and hundreds of additional device types via SNMP. The preconfigured sensor library handles most environments out of the box, including custom device types where vendor-specific sensors are not available.

Download PRTG Trial

What you will find on this page

  • Full Hardware Visibility
  • How PRTG Monitors Hardware
  • Manual Diagnostics vs. PRTG
  • FAQs

PRTG is compatible with all major vendors, products, and systems

compatible with all major vendors, products, and systems

Full Hardware Visibility, From Discovery to Alert

Keep Your Hardware Running to Avoid Unplanned Downtime 

Hardware health changes gradually. Fans slow down, power supplies degrade, temperatures creep up a degree at a time. PRTG's system scanner gives you continuous visibility into component health across servers, network devices (e.g. router, switch, ...), and infrastructure using SNMP, WMI, and SSH. You get live system status on fans, power supplies, temperature sensors, and storage enclosure health. Set custom alert thresholds and catch degrading hardware early enough to act on it. 

  • Monitor temperature, fan speed, power supply status, and hardware components across vendor hardware
  • Get alerts when hardware metrics exceed your operational tolerances
  • Track historical trends to spot components degrading over time
  • Replace failing hardware during planned maintenance windows, not emergency ones
  • Monitor enclosure health on Dell EMC Unity systems and memory controllers for HPE ProLiant servers

Unified Hardware Visibility Across Multiple Vendors 

Most multi-vendor environments end up running four or five monitoring tools in parallel. Dell has its own console, APC has another, Cisco something else. The problem isn't just the switching, it's that none of them share context.  

PRTG builds vendor-specific sensors that understand each manufacturer's hardware, not generic SNMP polling with a label on it. Auto-discovery handles the identification: Dell PowerEdge servers get Dell system health sensors, HPE ProLiant hardware gets HPE-specific ones. Worth noting, the whole process takes minutes, not an afternoon of manual mapping. One dashboard at the end of it.  

  • Vendor-specific sensors for Dell, HPE, Cisco, APC, NetApp, Synology, and hundreds of additional device types
  • Auto-discovery maps detected manufacturers to the right sensors automatically
  • Single dashboard, no vendor console switching
  • SNMP, WMI, SSH, and WBEM protocol support across Windows, Linux, and VMware environments
PRTG web interface showing device tree and full device list with sensor status badges

Full device list, instant overview

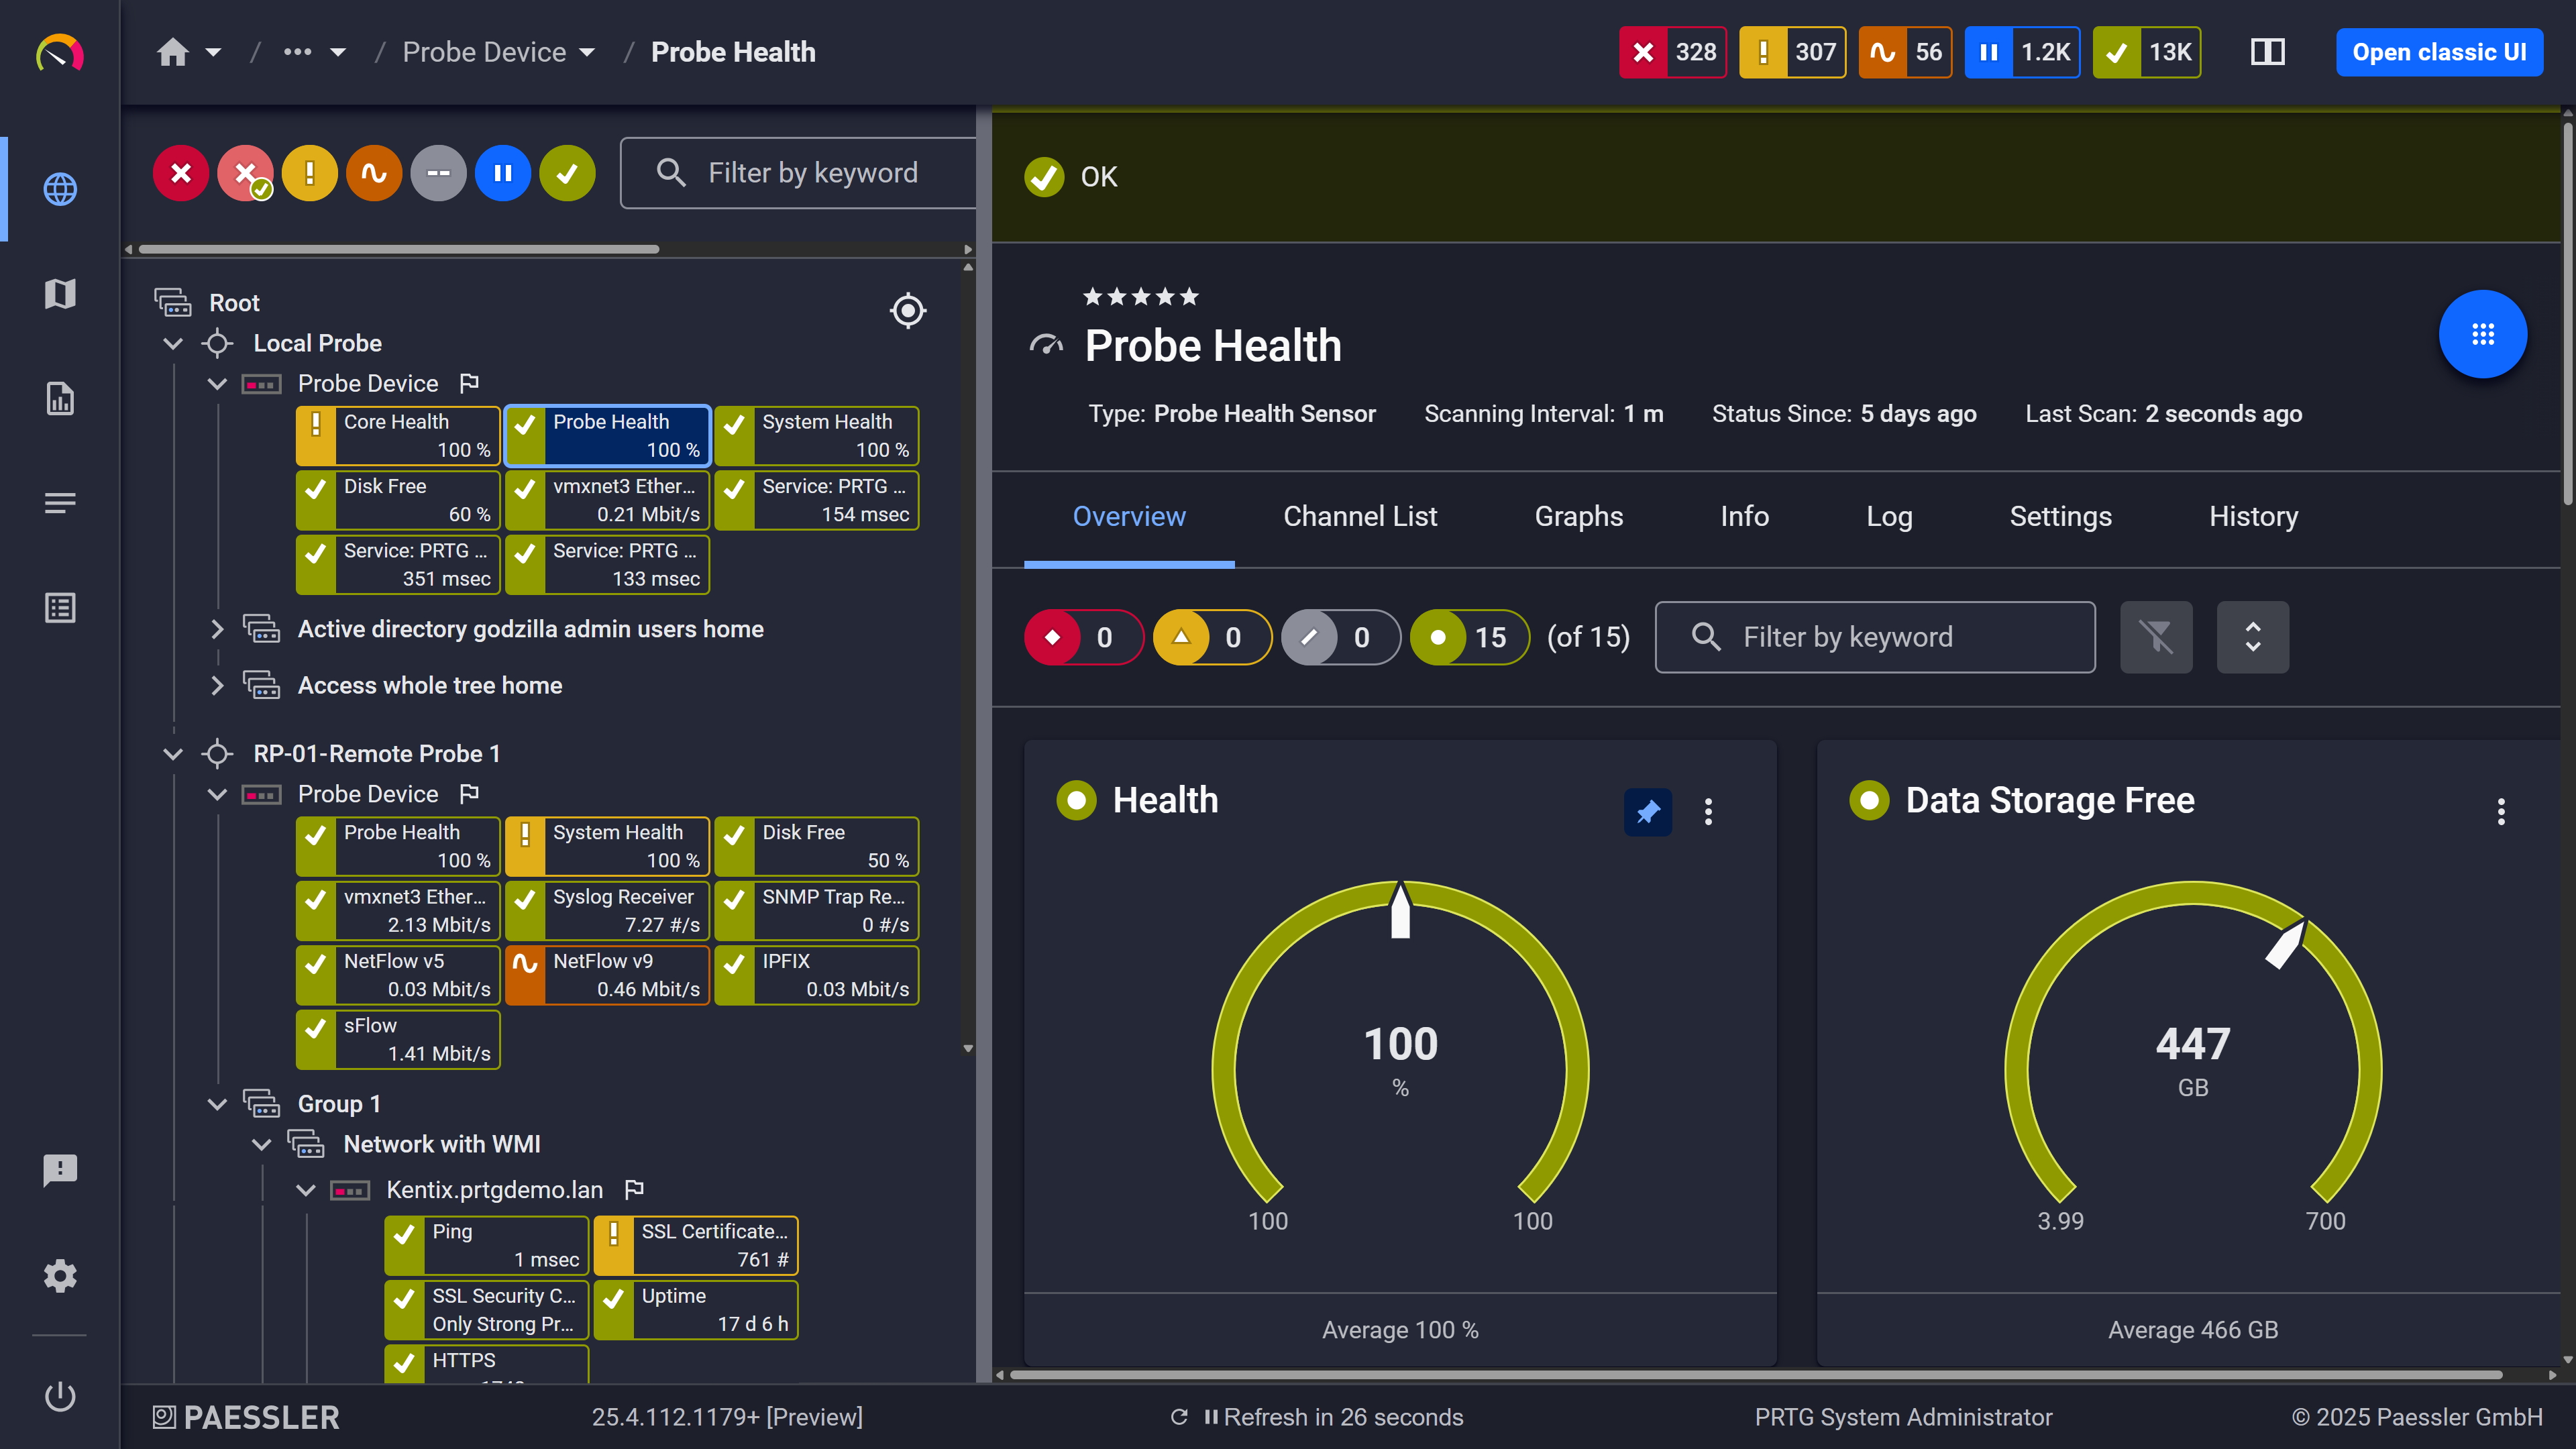
PRTG web interface showing Probe Health sensor with health and storage gauge widgets

Probe health at a glance

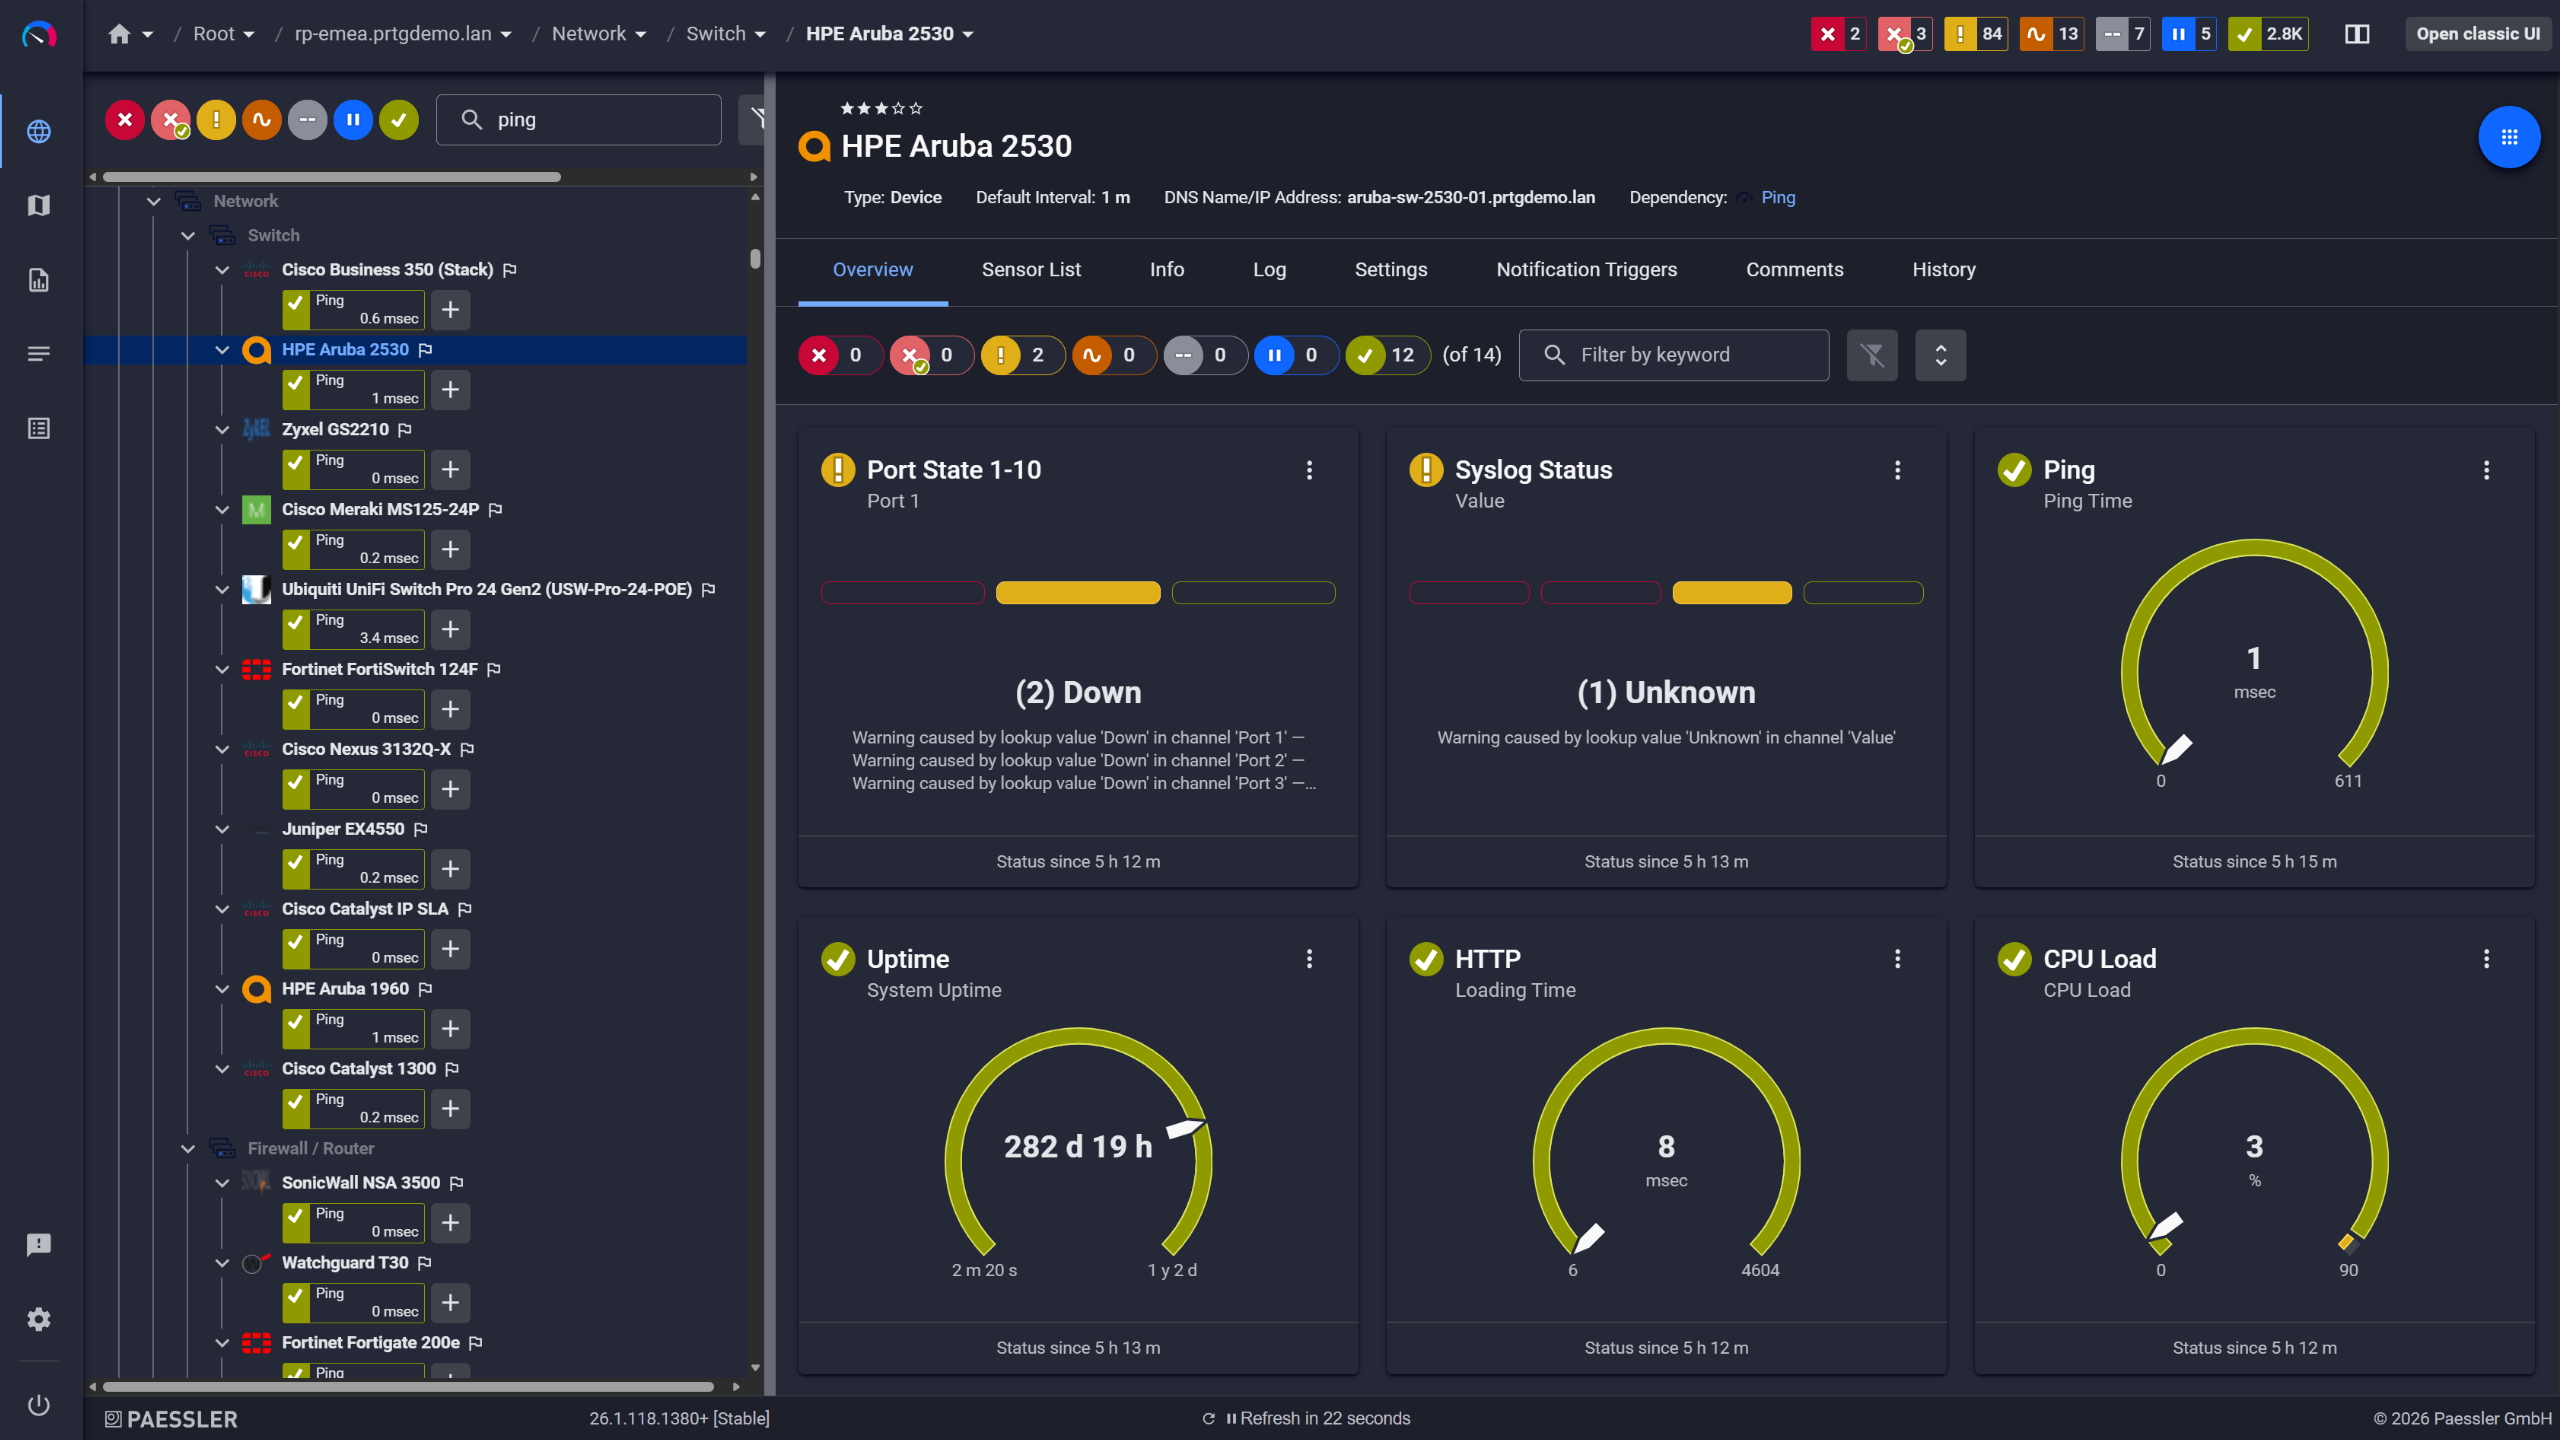
PRTG device overview for an HPE Aruba 2530 switch with port state, ping, and CPU sensors

Network switches monitored across vendors

Minutes to Monitor, Not Days of Manual Configuration 

Configuring sensors manually for every server, switch, and UPS in a mid-sized environment takes time most IT teams don't have. PRTG's auto-discovery handles the identification and setup automatically. Standard device templates already know what to pull from Dell PowerEdge servers, HPE ProLiant systems, and Cisco UCS hardware. You're not building sensor configs from scratch for each device type. Installation to system monitoring in minutes, not days.  

  • Auto-discovery creates hardware sensors for detected devices without manual setup  
  • Preconfigured templates for Dell, HPE, Cisco, APC, and other major vendors  
  • Default, detailed, or template-based discovery depending on your network size  
  • Sensors know what hardware components to monitor out of the box  
  • Get monitoring running, then fine-tune thresholds once you have real data to work from 

See Why IT Professionals Trust PRTG

Start monitoring your infrastructure in minutes. No professional services, no complex configuration, no risk.

Free download
PRODUCT OVERVIEW

Hardware System Information for Troubleshooting and Inventory 

Troubleshooting performance issues without reliable hardware inventory is guesswork. PRTG's system information feature pulls hardware details automatically via WMI and SNMP: BIOS serial numbers, MAC addresses, IP addresses, installed hardware components, operating system versions. All of it refreshes every 24 hours without touching the devices. Also covers the audit and capacity planning side of things, so you're not maintaining a separate inventory sheet that's usually out of date anyway.  
  • Automatic hardware inventory via WMI (Windows) and SNMP (network devices)
  • BIOS serial numbers, MAC addresses, IP addresses, and system specs in one interface
  • Installed hardware components, software versions, and running processes
  • Data refreshes automatically every 24 hours
  • Covers warranty tracking, compliance reporting, and capacity planning without a separate tool
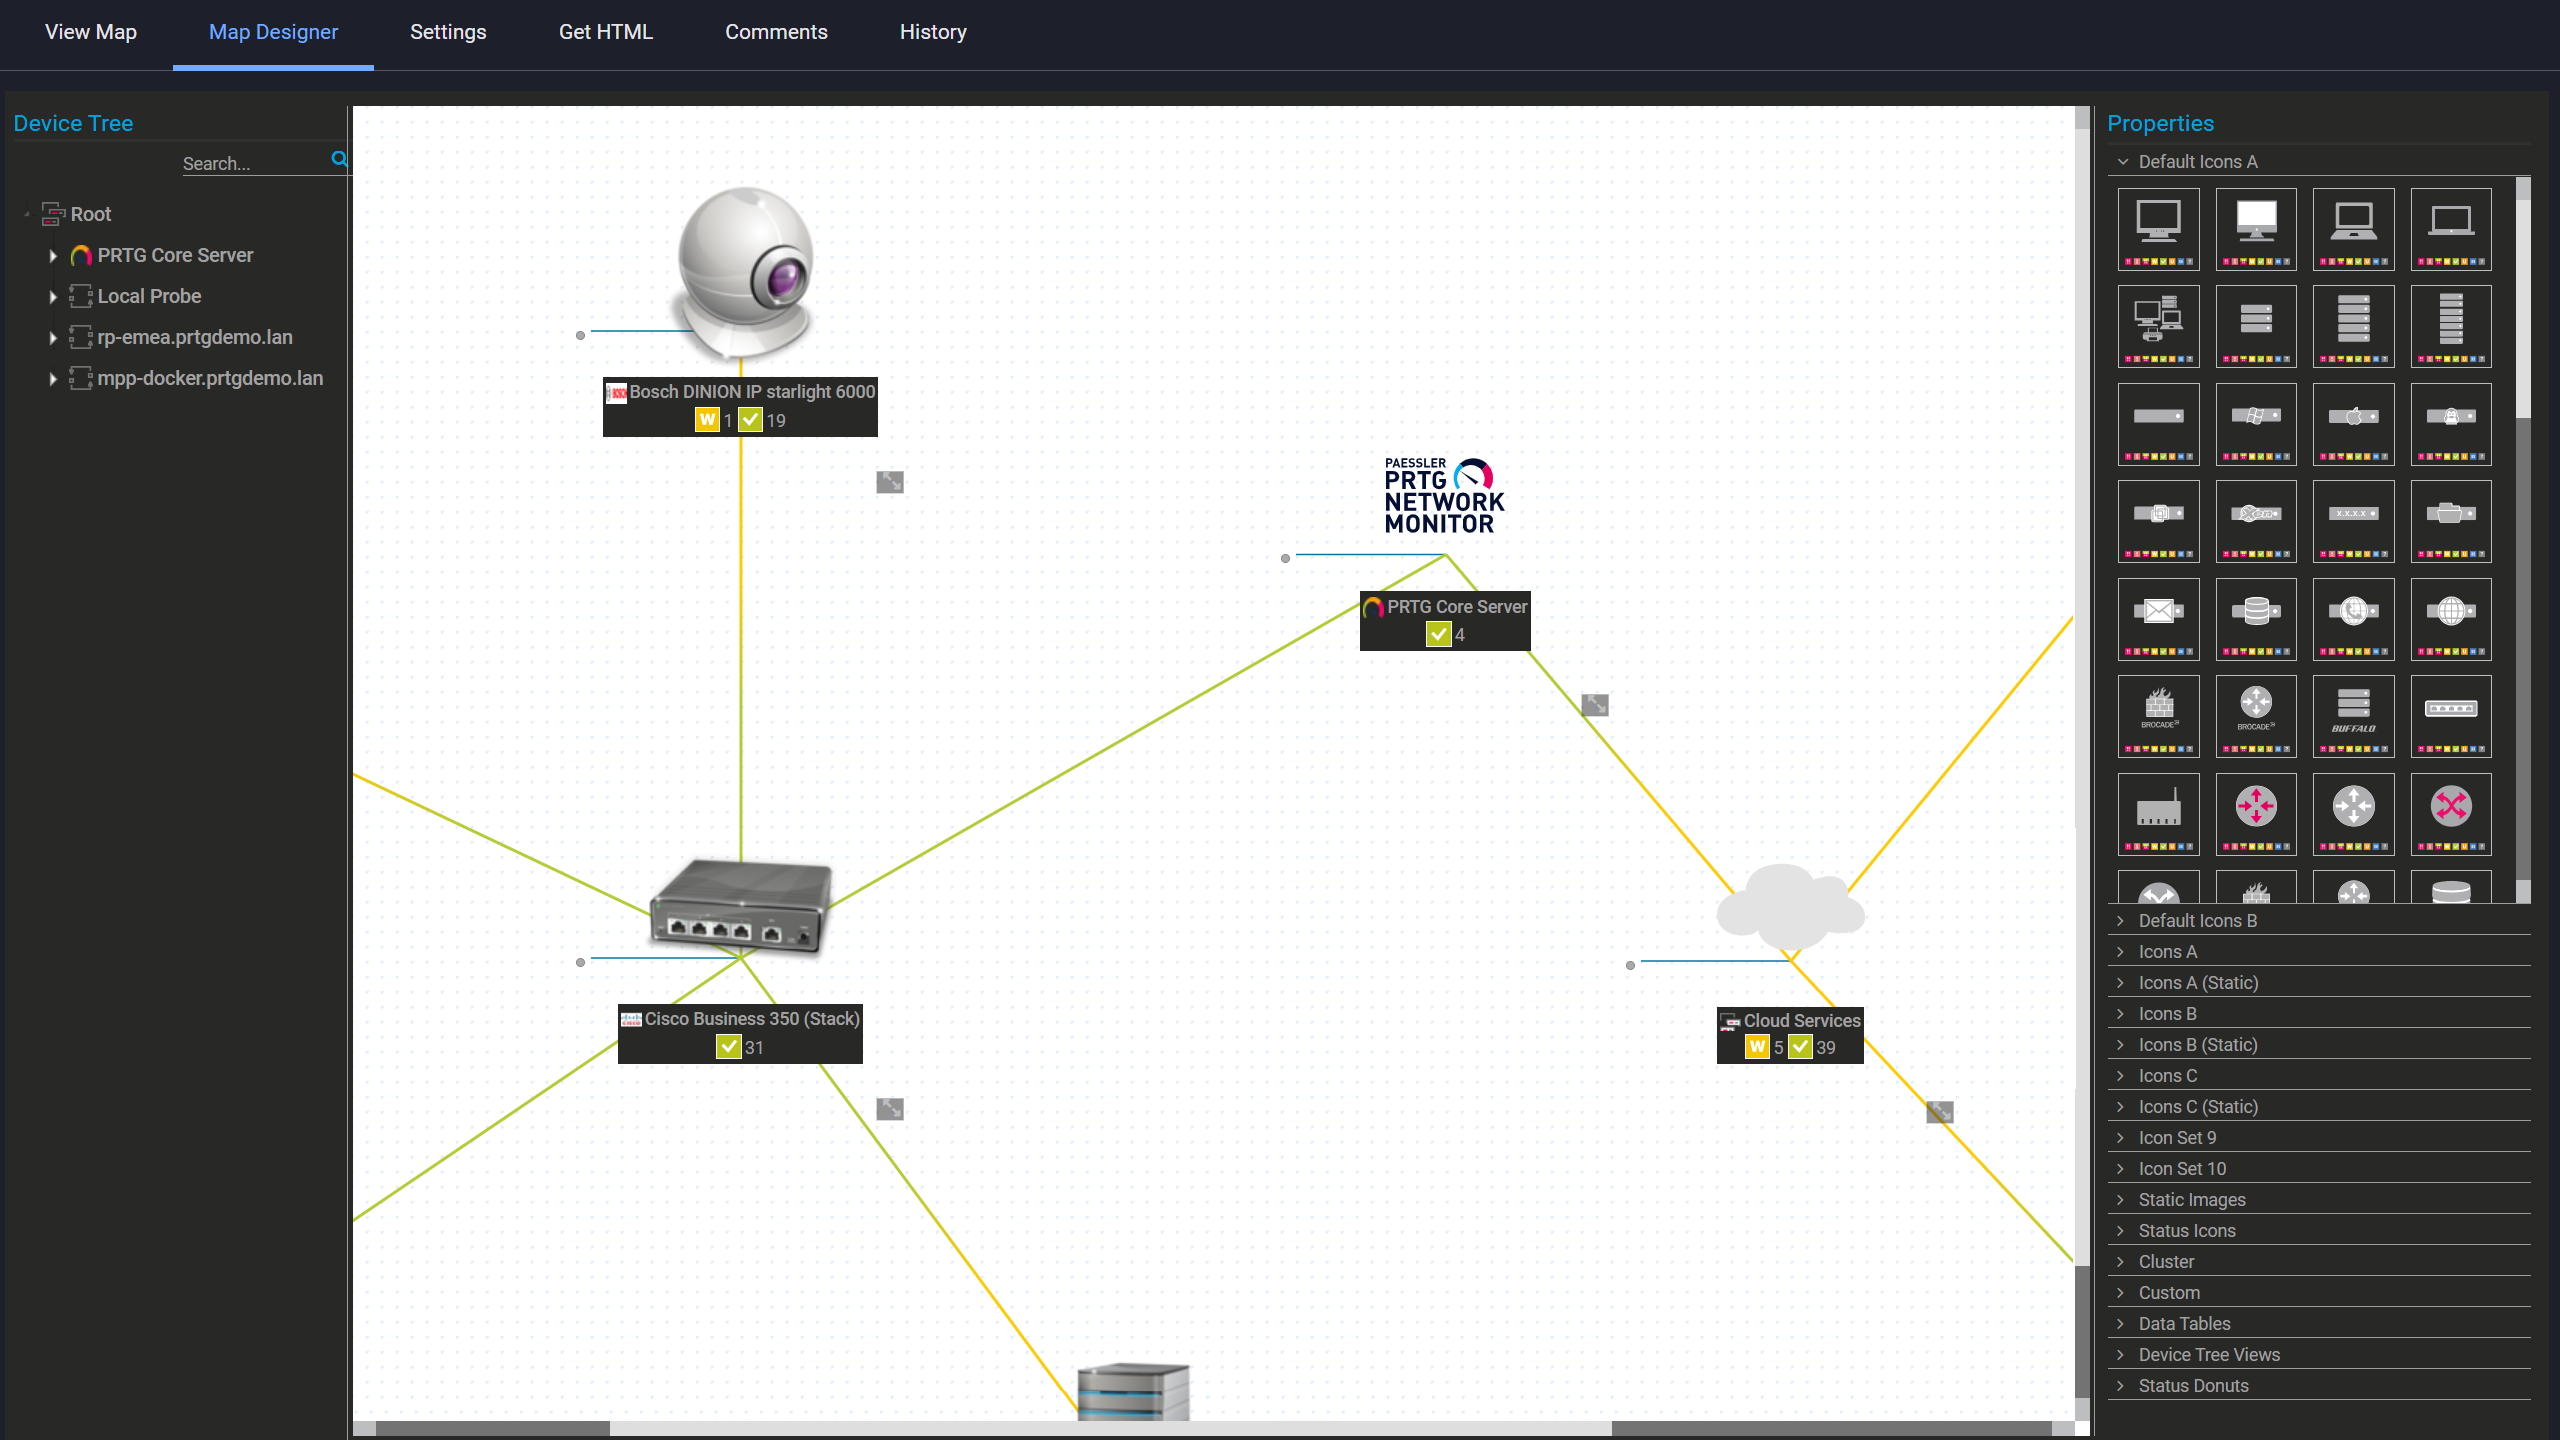
PRTG Map Designer showing a custom network map with live device status and vendor icons

Custom maps with live status

PRTG reports list showing scheduled monitoring reports with run times and sensor counts

Scheduled reports, always on time

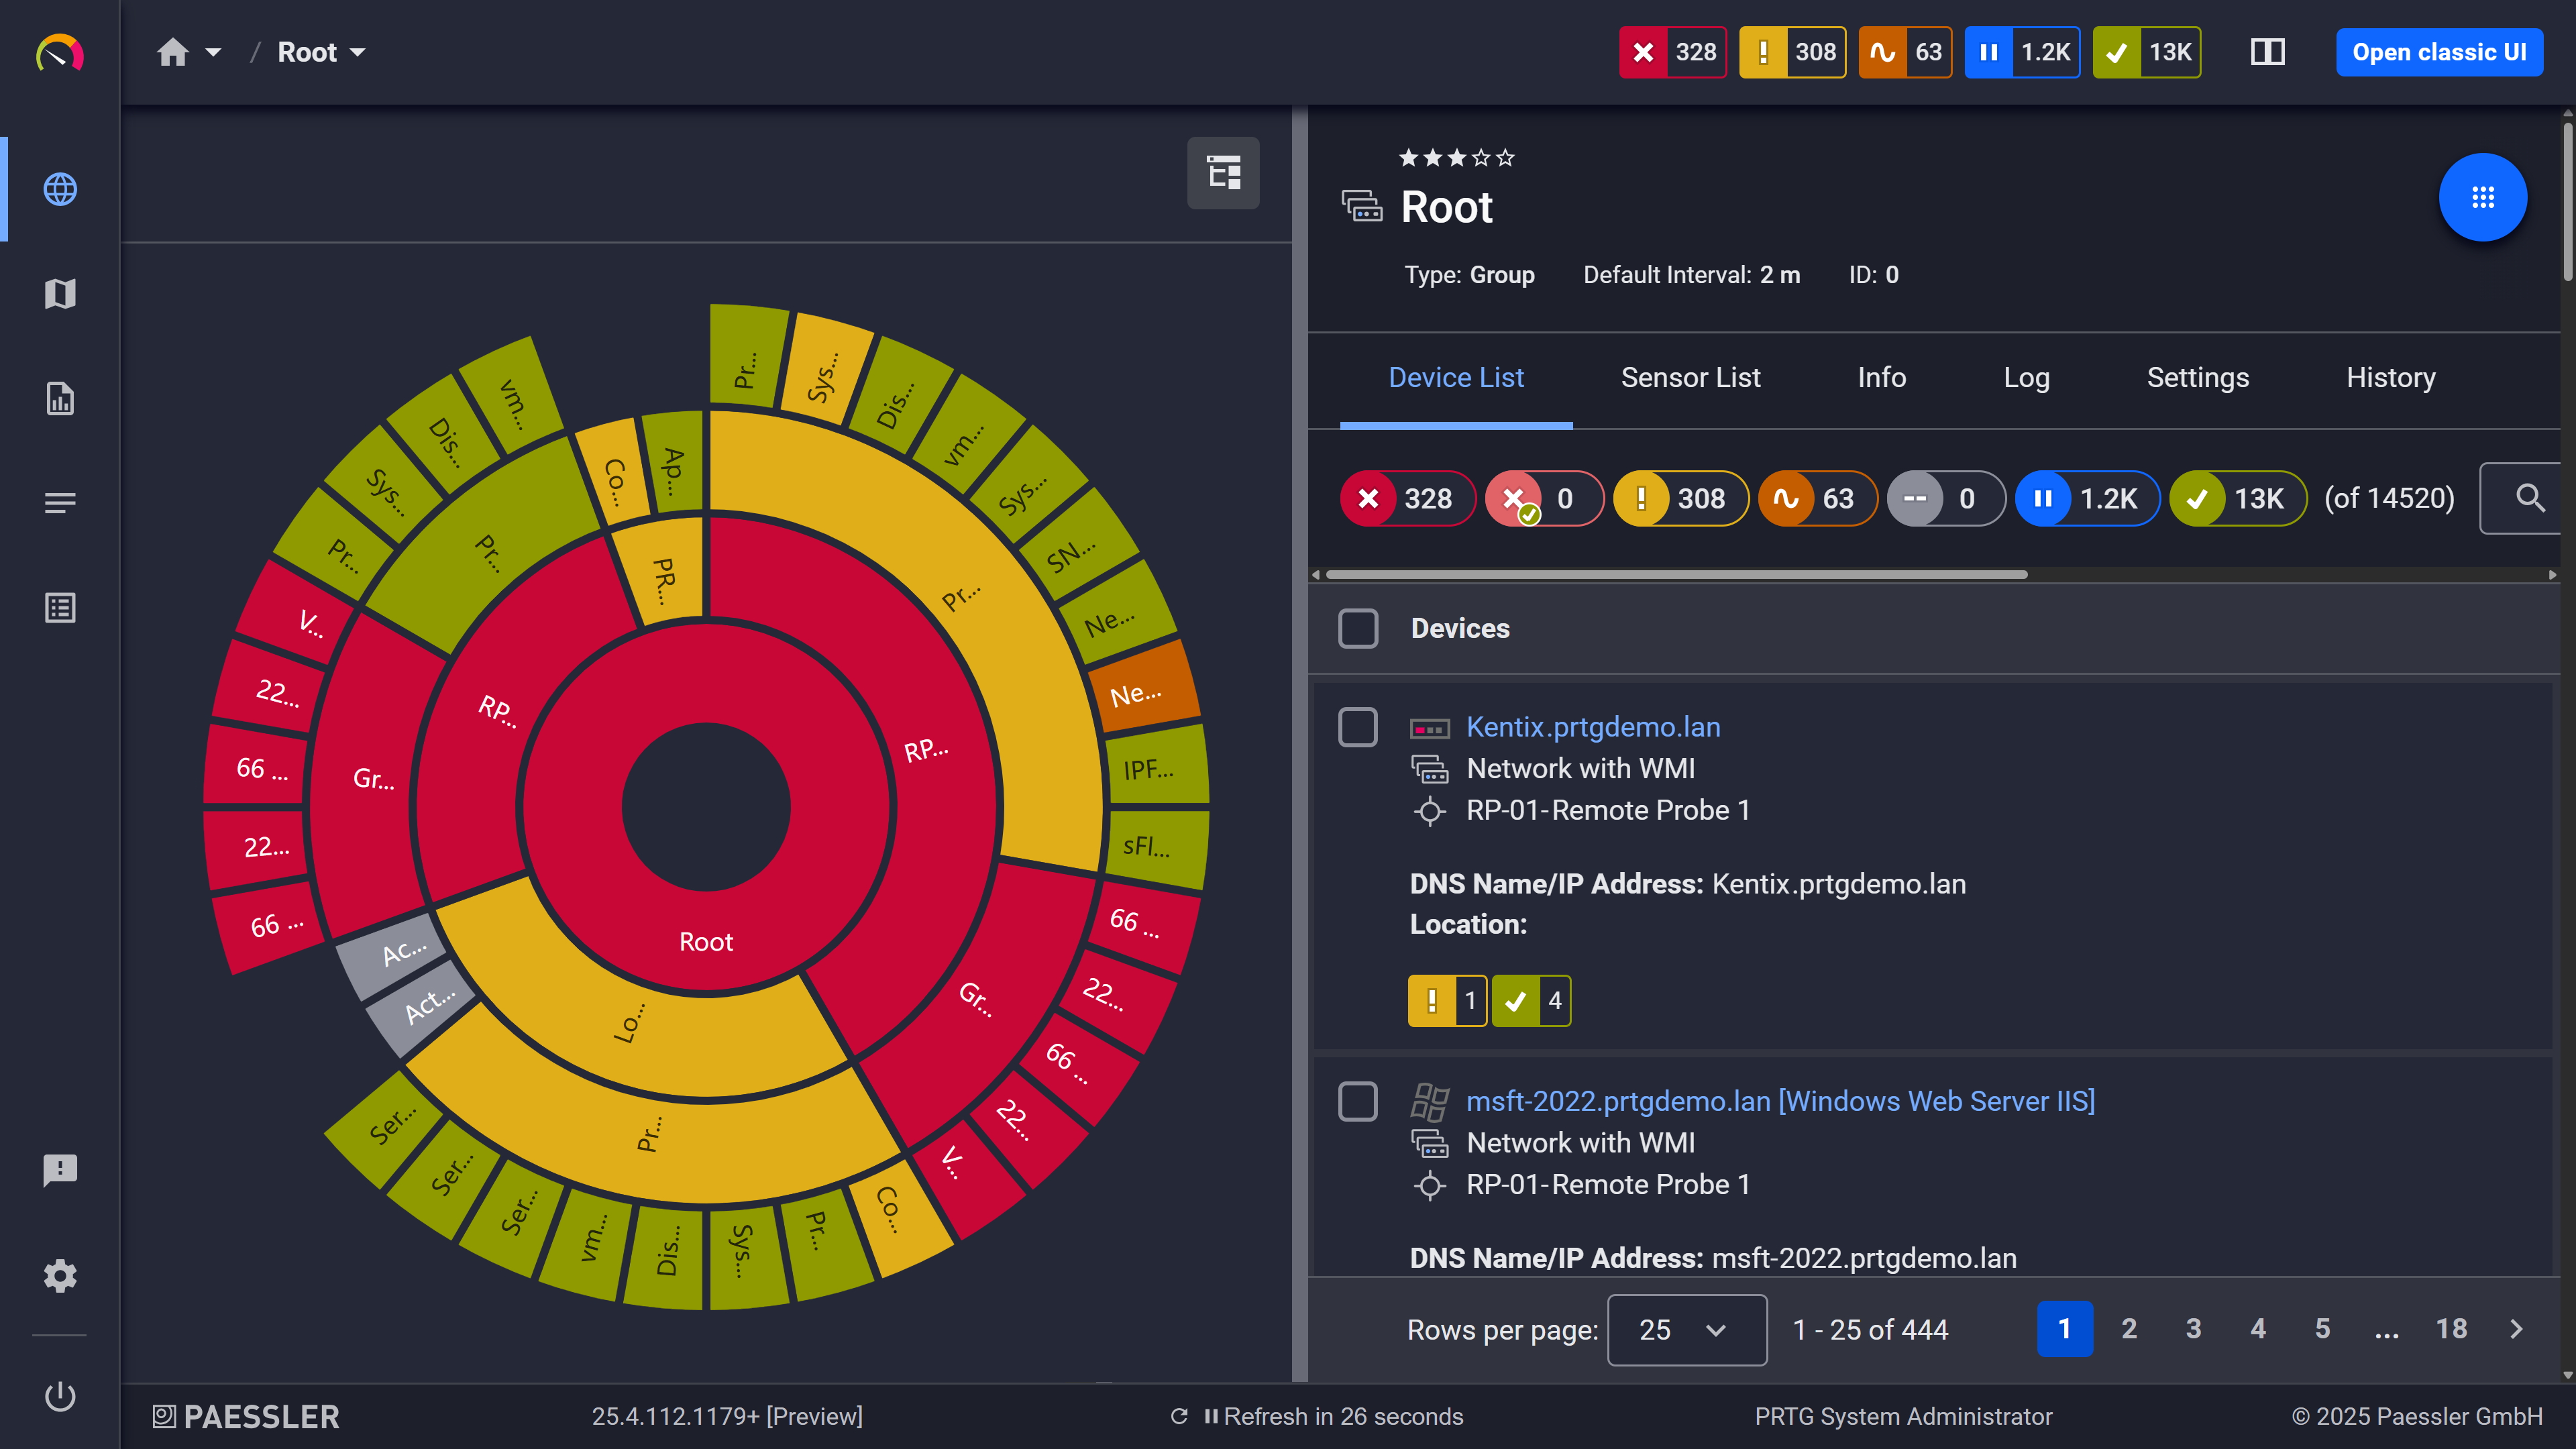
PRTG sunburst chart visualizing the full network hierarchy with color-coded sensor status

Your entire network, visualized instantly

Customizable Alerts That Focus on What Matters 

Generic SNMP traps flood your inbox with noise while critical hardware failures get lost in the clutter. PRTG lets you set threshold-based alerts customized to your environment. Define what "warning" and "critical" mean for CPU temperature, fan speed, or power supply status based on your operational tolerances. Alerts go to email, SMS, push notifications, and external services via HTTP action notifications.  

  • Threshold-based alerting triggers when hardware metrics exceed your defined limits
  • Customize warning and critical thresholds for each hardware sensor
  • Multi-channel notifications: email, SMS, push notifications, and external integrations via HTTP actions
  • Escalation workflows ensure critical hardware alerts reach the right people
  • Reduce alert fatigue by focusing on actionable hardware status changes

How PRTG Monitors Hardware   

PRTG uses multiple protocols to collect hardware health data depending on what the device supports and what access is available. The method matters because different protocols expose different data. Here's how each one works in practice.  

SNMP Hardware Monitoring 

SNMP is the primary method for network devices and most server hardware. PRTG queries vendor MIBs directly, so Dell PowerEdge sensors pull chassis status and BIOS health, HPE ProLiant sensors track memory controllers and system health, APC sensors cover UPS battery status, load, and runtime. Fan status, power supply condition, temperature readings, component states, error counts. The data comes from the manufacturer's own MIB definitions, not generic OID polling.  

WMI Hardware Monitoring 

For Windows servers and workstations, PRTG uses WMI to reach hardware information the OS exposes. That includes system data like BIOS serial numbers, IP addresses, MAC addresses, and Windows version, plus hardware inventory and software. The System Information feature pulls all of this automatically and populates specs, installed software, running services, and active processes without any manual queries.  

SSH Hardware Monitoring

Linux, Solaris, and macOS hardware gets monitored via SSH. PRTG runs system commands over the connection to retrieve disk space, memory usage, CPU load, system health metrics, and storage array data. Works for physical servers and appliances that surface hardware data through standard command-line utilities.  

WBEM Hardware Monitoring

VMware ESXi hosts need a different approach since you're after the physical hardware underneath the hypervisor. PRTG's VMware Host Hardware (WBEM) retrieves pyhsical host metrics such as temperature, fan speed, power supply status, and component health via VMware’s CIM/WBEM interface (if enabled). So you're not just monitoring the VMs, you can see what the physical layer is doing.  

Auto-Discovery and Preconfigured Sensors

Auto-discovery scans the network, identifies device types, and deploys the right sensors automatically. Device templates for Dell, HPE, Cisco, APC, and other vendors define which sensors get created and what they monitor. Three modes: default discovery works for most environments, detailed discovery gives broader sensor coverage, template-based discovery gives you full control over what gets deployed. After the initial run you can add sensors manually or adjust templates to match your specific hardware. 

free downLoad

PRTG Hardware Scanning vs. Manual Hardware Diagnostics 

FEATURE

Manual Hardware Diagnostics

Manual Hardware Diagnostics

PRTG Hardware Scanner

PRTG Hardware Scanner

Time to gather hardware status across 50 devices 

Manual Hardware Diagnostics
not included

Hours. Log into each device individually using vendor tools like iDRAC, iLO, or UPS software 

PRTG Hardware Scanner
included

Minutes: all hardware status on one dashboard with real-time updates 

Multi-vendor hardware monitoring 

Manual Hardware Diagnostics
not included

Multiple tools required: Dell OpenManage, HPE OneView, APC PowerChute, Cisco tools, and so on. None of them share data 

PRTG Hardware Scanner
included

One platform for Dell, HPE, Cisco, APC, and hundreds of additional device types via SNMP, WMI, and SSH 

Historical hardware trends 

Manual Hardware Diagnostics
not included

Manual: export logs per device, compile into spreadsheets, build graphs yourself 

PRTG Hardware Scanner
included

Automatic: PRTG stores historical data and displays trend graphs, including degradation over time 

Proactive hardware alerts 

Manual Hardware Diagnostics
not included

Reactive. You find out when users report something broken, or during a manual check 

PRTG Hardware Scanner
included

Threshold-based alerts fire when temperature, fan speed, or component status drifts past your defined limits 

Setup and configuration 

Manual Hardware Diagnostics
not included

Days: vendor-specific agents, separate configuration per device 

PRTG Hardware Scanner
included

Minutes: auto-discovery deploys preconfigured sensors, vendor templates handle the rest 

free downLoad

“From a server perspective, we're monitoring all of the key components of our service such as CPU usage, RAM disk space, the Windows services that it's running, and network connectivity of that server. In terms of networks, we’re monitoring all of our switches, firewalls, and access points. It’s really useful to be able to easily pull performance metrics from the PRTG dashboard.”

Ollie Kerslake, Infrastructure Lead
Riverford Organic Farmers

“The tool has given us greater control over all types of devices connected to the network (switches, IP telephony, security cameras, IoT, WiFi) that previously remained opaque when dealing with service incidents. This has improved our ability to diagnose and resolve problems, which has translated into greater efficiency and a better user experience in both internal and public services.”

Jordi Tolosà Bel, New Technologies Technician
Vinaroz City Council

“Our objective was to be able to monitor the health of our most critical servers containing data and applications, but also the flows and bandwidth between headquarters, our 50 servers in the cloud and the 15 servers at our production sites. For us, it is essential to have a proactive approach to understand where the weaknesses of the IT system are to be able to improve them.”

Marc Boullier, CIO
Carambar & Co

Paessler PRTG Network Monitor licenses & pricing

Choose the PRTG Network Monitor subscription that's best for you.

License NameLicense descriptionPriceLicense DetailsGet startedPricing Details
PRTG 500$200per month paid annuallyBuy nowBuy now

Enough to monitor multiple aspects of 50 devices

PRTG 1000$358per month paid annuallyBuy nowBuy now

Enough to monitor multiple aspects of 100 devices

PRTG 2500$742per month paid annuallyBuy nowBuy now

Enough to monitor multiple aspects of 250 devices

PRTG 5000$1,300per month paid annuallyBuy nowBuy now

Enough to monitor multiple aspects of 500 devices

PRTG 10000$1,642per month paid annuallyBuy nowBuy now

Enough to monitor multiple aspects of 1000 devices

Over 100,000 Customers Worldwide Love Paessler  

customer success stories

 [H2] XXX: Frequently Asked Questions


What types of hardware can PRTG monitor?

The short answer is most things in a standard enterprise environment. Server hardware: Dell PowerEdge, HPE ProLiant, Cisco UCS. Network devices, storage systems (Dell EMC, NetApp, Synology), APC UPS units, HP LaserJet printers, VMware ESXi hosts, Windows and Linux systems. Anything outside the preconfigured vendor list gets covered via SNMP, WMI, SSH, or WBEM. Custom development isn't something you'd typically need.  

Does PRTG require agent installation on monitored hardware?

Nothing gets installed on the monitored device. PRTG connects using protocols the hardware already runs: WMI on Windows servers, SNMP on network devices and most servers, SSH on Linux, WBEM on VMware ESXi. That includes appliances where OS access is restricted or unavailable.  

What hardware components does PRTG track (CPU, GPU, motherboard, SSDs, etc.)?

That depends partly on the vendor. PRTG collects temperature, fan speed, power supply status, RAID controller health, memory controllers, enclosure health, and component-level status via SNMP or WMI. What actually shows up is determined by what each manufacturer exposes through their MIBs or WMI classes. Dell PowerEdge gives you chassis status, BIOS health, system management data. HPE ProLiant covers memory controllers and system health. Some vendors are more forthcoming than others. 

Does PRTG provide real-time hardware monitoring with graphs and dashboards?

Polling runs every 60 seconds by default, adjustable per sensor. Hardware metrics come through as graphs, gauges, or status indicators on dashboards you configure yourself. Historical data stays stored, useful for spotting degradation patterns before they turn into failures. Also accessible via web browsers on desktops, laptops, tablets, and mobile. 

What hardware information does PRTG collect (BIOS, motherboard, warranty details, system specs)?

PRTG's System Information feature collects BIOS serial numbers, IP addresses, MAC addresses, operating system versions, installed hardware components, software, and running processes via WMI or SNMP. Refreshes every 24 hours automatically. Worth being direct here: warranty expiration dates are not collected and PRTG doesn't do asset lifecycle management. The focus is hardware health and system status.  

Can PRTG monitor network bandwidth and hardware performance together?

PRTG can monitor both network bandwidth and hardware perfromance in the same platform, yes. NetFlow, sFlow, jFlow, IPFIX, and SNMP traffic sensors handle bandwidth alongside hardware health sensors on the same devices. Bandwidth utilization, Top Talkers, Top Connections, and Top Protocols in the same dashboard view as temperature readings and component status. That combination is useful when you're correlating a performance complaint with what the physical hardware was doing at the time. 

Paessler PRTG

Paessler PRTG

Network Monitoring Software – Version 26.1.116.1532 (February 9th, 2026)

Hosting icon

Hosting

Download for Windows and cloud-based version PRTG Hosted Monitor available

Languages icon

Languages

English, German, Spanish, French, Portuguese, Dutch, Russian, Japanese, and Simplified Chinese

test

Monitor everything

Network devices, bandwidth, servers, applications, virtual environments, remote systems, IoT, and more

test

Pricing

Choose the PRTG Network Monitor subscription that's best for you

Discover more monitoring insights and stories

Content illustration

Powerful stories from the monitoring world

  • Top sensors in PRTG to monitor your Dell, HPE and IBM server ...
  • How to see all IP addresses on network: A guide for IT professionals
  • The Ultimate PRTG Performance Guide: Optimize Sensors, CPU ...
Support illustration

Resources to master your monitoring challenges

  • PRTG Apps for Mobile Network Monitoring
  • Quick Start Guide
  • How can I use the PRTG Application Programming Interface (API)?
Solution illustration

Solutions for all your monitoring needs

  • Hardware Scanning
  • Monitoring Hardware
  • Port Scanner
PRTG Logo

Start Monitoring with PRTG and see how it can make your network more reliable and your job easier.

Free download
PRODUCT OVERVIEW

Products

  • Paessler PRTG
    Paessler PRTGMonitor your whole IT infrastructure
    • PRTG Network Monitor
    • PRTG Enterprise Monitor
    • PRTG Hosted Monitor
    • PRTG UVexplorer
    • PRTG extensions
      Extensions for Paessler PRTGExtend your monitoring to a new level
  • Icon Features
    FeaturesExplore all monitoring features

Monitoring with PRTG

  • Network monitoring
  • Bandwidth monitoring
  • SNMP monitoring
  • Network mapping
  • Wi-Fi monitoring
  • Server monitoring
  • Network traffic analyzer
  • NetFlow monitoring
  • Syslog server

Useful Links

  • PRTG Manual
  • Knowledge Base
  • Customer Success Stories
  • About Paessler
  • Subscribe to newsletter
  • PRTG Support
  • PRTG Consulting
  • PRTG Feedback & Roadmap

Contact

Paessler GmbH
Thurn-und-Taxis-Str. 14, 
90411 Nuremberg 
Germany

[email protected]

+49 911 93775-0

  • Contact us
©2026 Paessler GmbHTerms & ConditionsPrivacy PolicyImprintReport VulnerabilityDownload & InstallSitemap
How to buy How to buy How to buy