- English
- Deutsch
- Español
- Français
- Italiano
- Português
SAP landscapes are complex. Databases, application servers, background jobs, cloud connectors, and integration flows all need continuous oversight, and a failure in any layer can cascade into business process disruptions fast. Traditional SAP monitoring approaches require agents installed on every server, adding deployment overhead and ongoing maintenance before you see any value.
Paessler PRTG takes an agentless approach through 50 preconfigured Scansor sensors that connect via RFC. They track SAP Basis components, background jobs, workloads, databases, and cloud integrations in real time, with visualization dashboards and historical data for capacity planning and compliance reporting.
Supported SAP environments and databases: SAP HANA, S/4HANA, SAP NetWeaver, SAP Solution Manager, SAP Cloud Connector, Oracle, DB2, Microsoft SQL Server, Sybase, MaxDB, SAP ABAP systems, SAP Basis, tRFC/qRFC queues, IDoc processing, SAP PI/PO integration flows, web services

Your SAP HANA database approaches it’s memory limits. Application servers max out dialog work processes. End users see slow response times, then complete access failures. PRTG monitors critical database and application server metrics: memory consumption, CPU load, service status, backup completion, replication health, and work process utilization. Automated threshold alerts notify your team as soon as problems start, so you can act before performance problems impact user experience and turn into outages.
Failed SAP jobs break critical ERP workflows. Data imports don't run. Financial closes get delayed. Inventory updates stop. Your SAP Basis team spends hours diagnosing job failures and restarting processes under pressure. PRTG's SAP Job sensor tracks every background job's status, runtime, and dependencies. Job failures trigger notifications with context, so your team can fix issues during scheduled maintenance windows instead of dropping everything for production emergencies.
Exchange server, fully under control
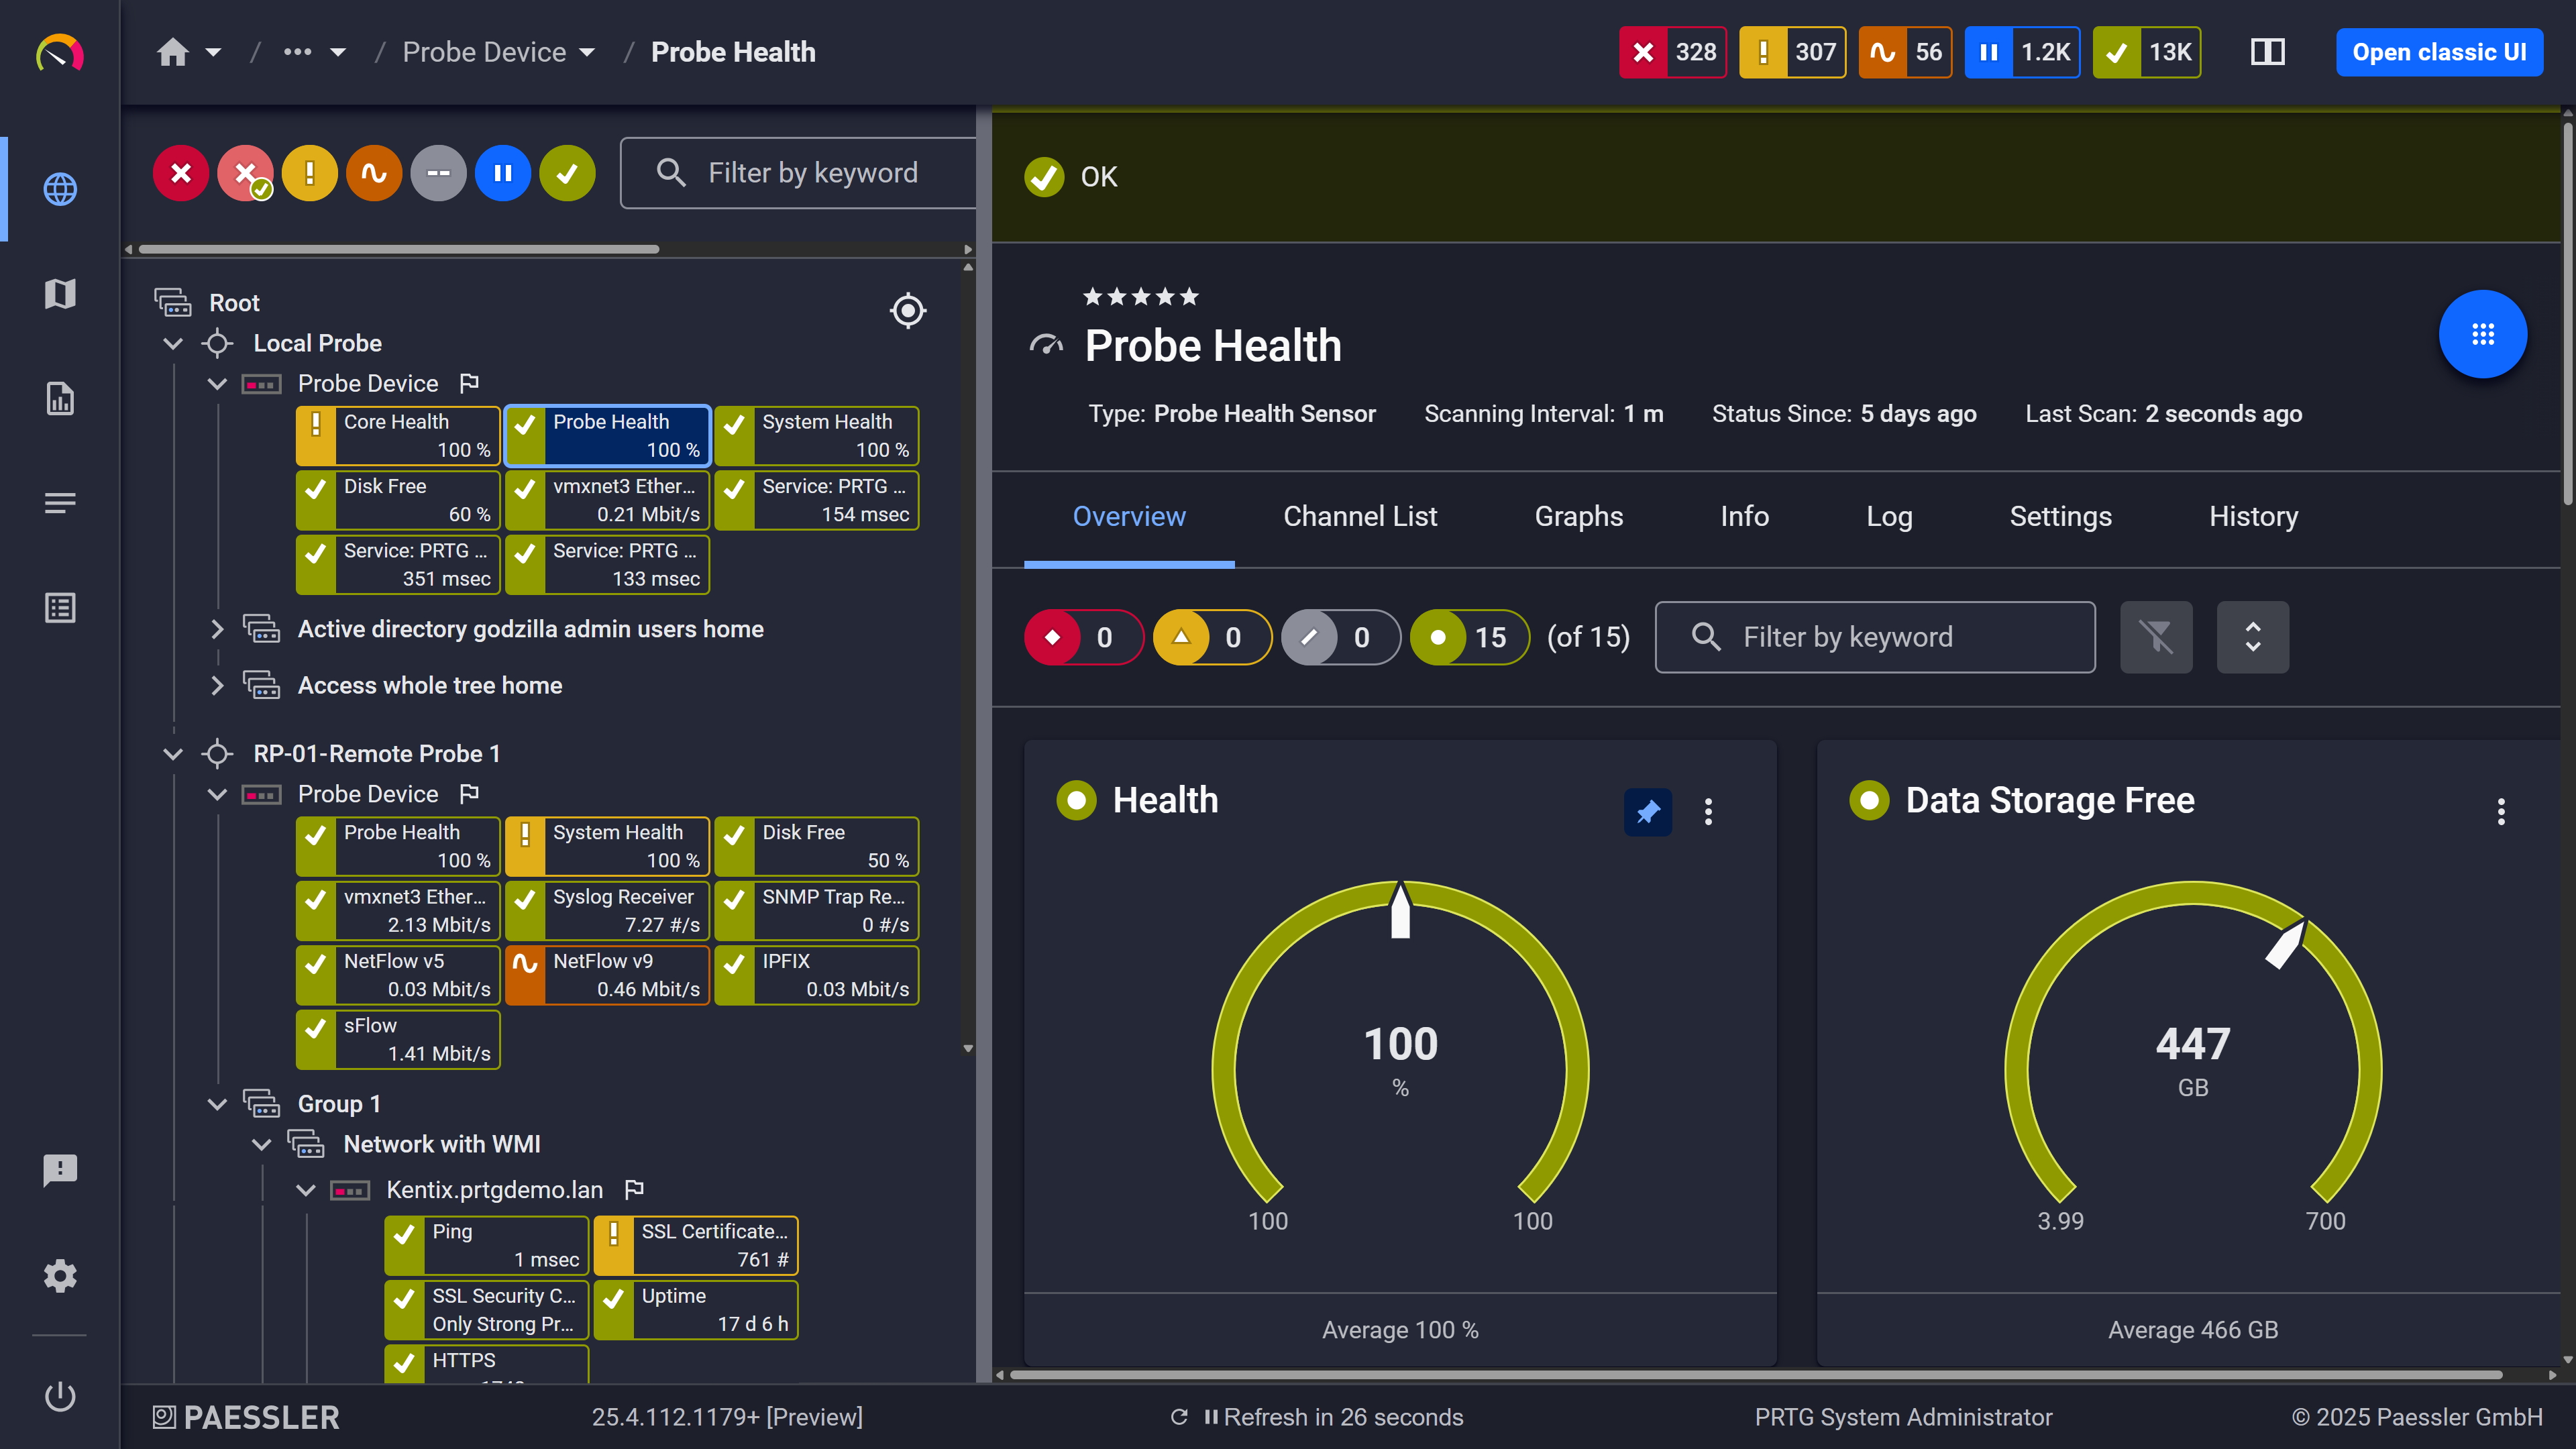
Probe health at a glance

Live graphs, real-time performance data
Some SAP problems build quietly until they cause system-wide freezes. System locks accumulate and create deadlocks. Spool systems fill up and halt all printing. IDoc queues back up and break integrations with suppliers or customers. PRTG's SAP System sensor tracks lock utilization, spool capacity, update queues, and IDoc processing flow. When these metrics hit dangerous levels, your team gets advance warning to clear queues, release locks, or expand spool capacity before costly operational freezes occur.
Start monitoring your infrastructure in minutes. No professional services, no complex configuration, no risk.
Your SAP environment spans on-premises data centers, SAP Cloud Connector integrations, and hybrid architectures. Monitoring these layers separately creates blind spots where failures hide. PRTG consolidates SAP NetWeaver systems, Cloud Connector status, integration flow exceptions, non-SAP infrastructure, energy usage, and on-premises components into a single view. Your team stops switching between tools and gets complete observability across distributed SAP deployments.

Scheduled reports, always on time
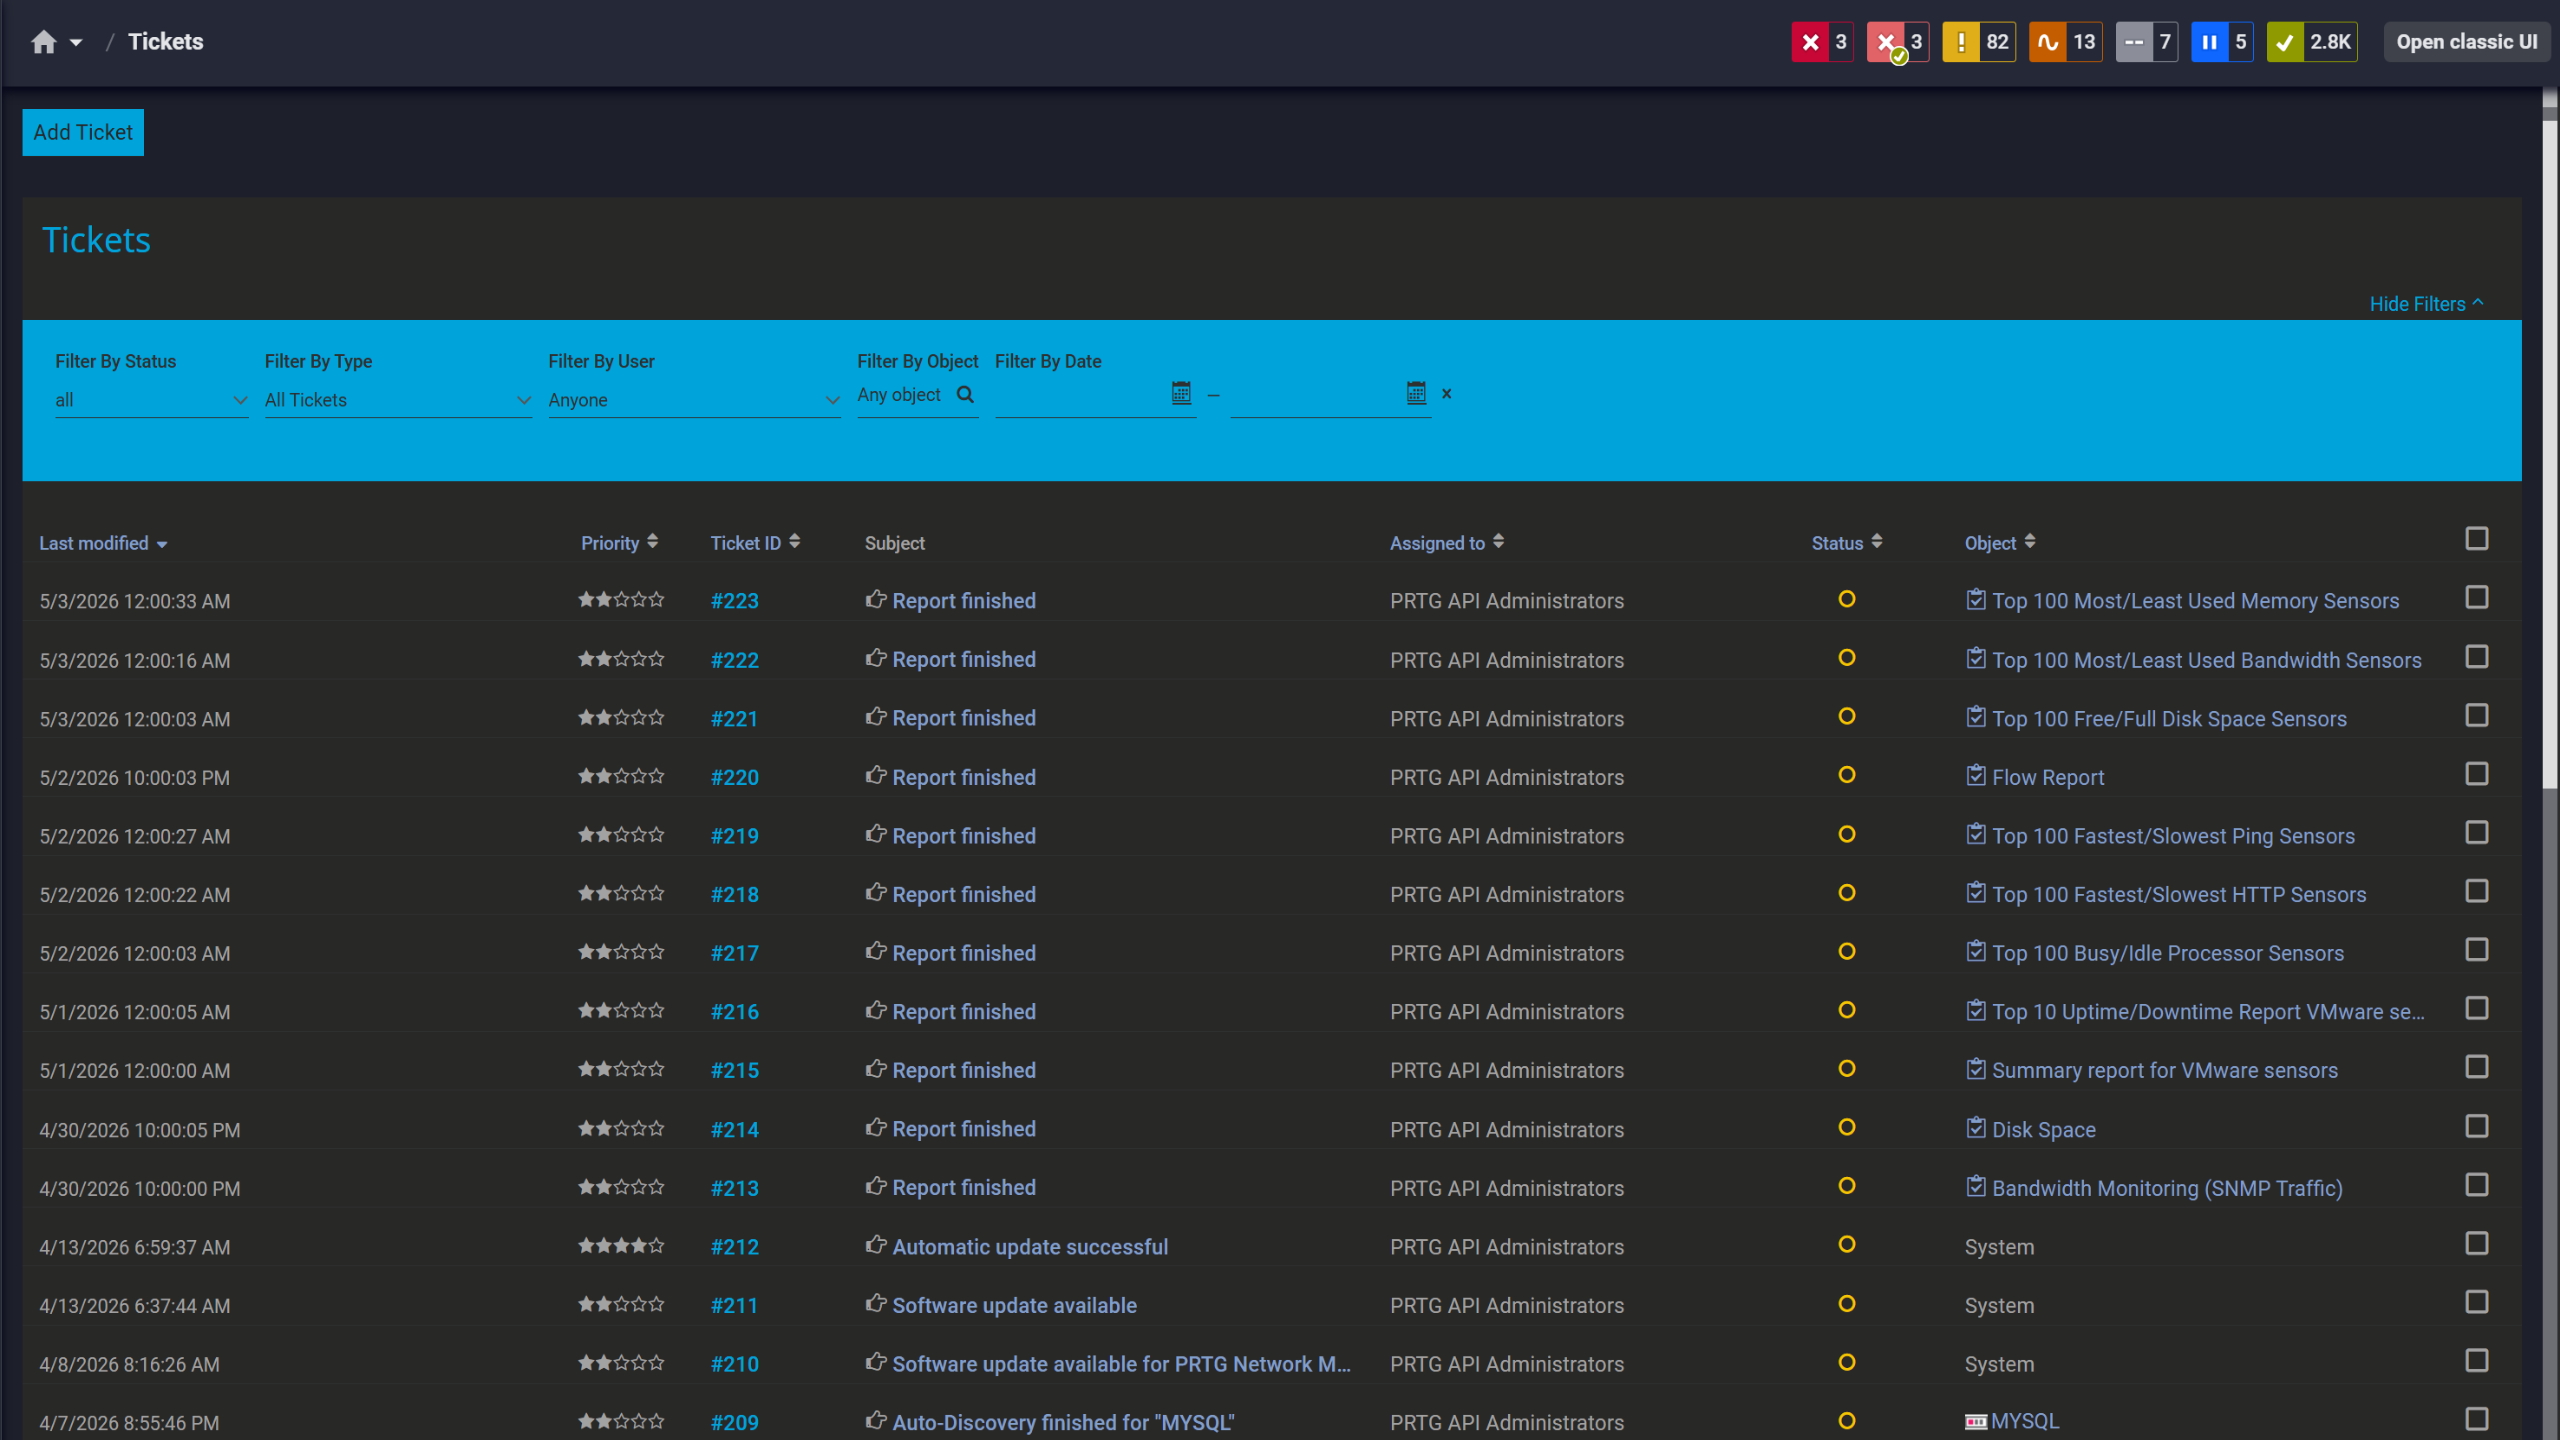
Tickets keep your team aligned

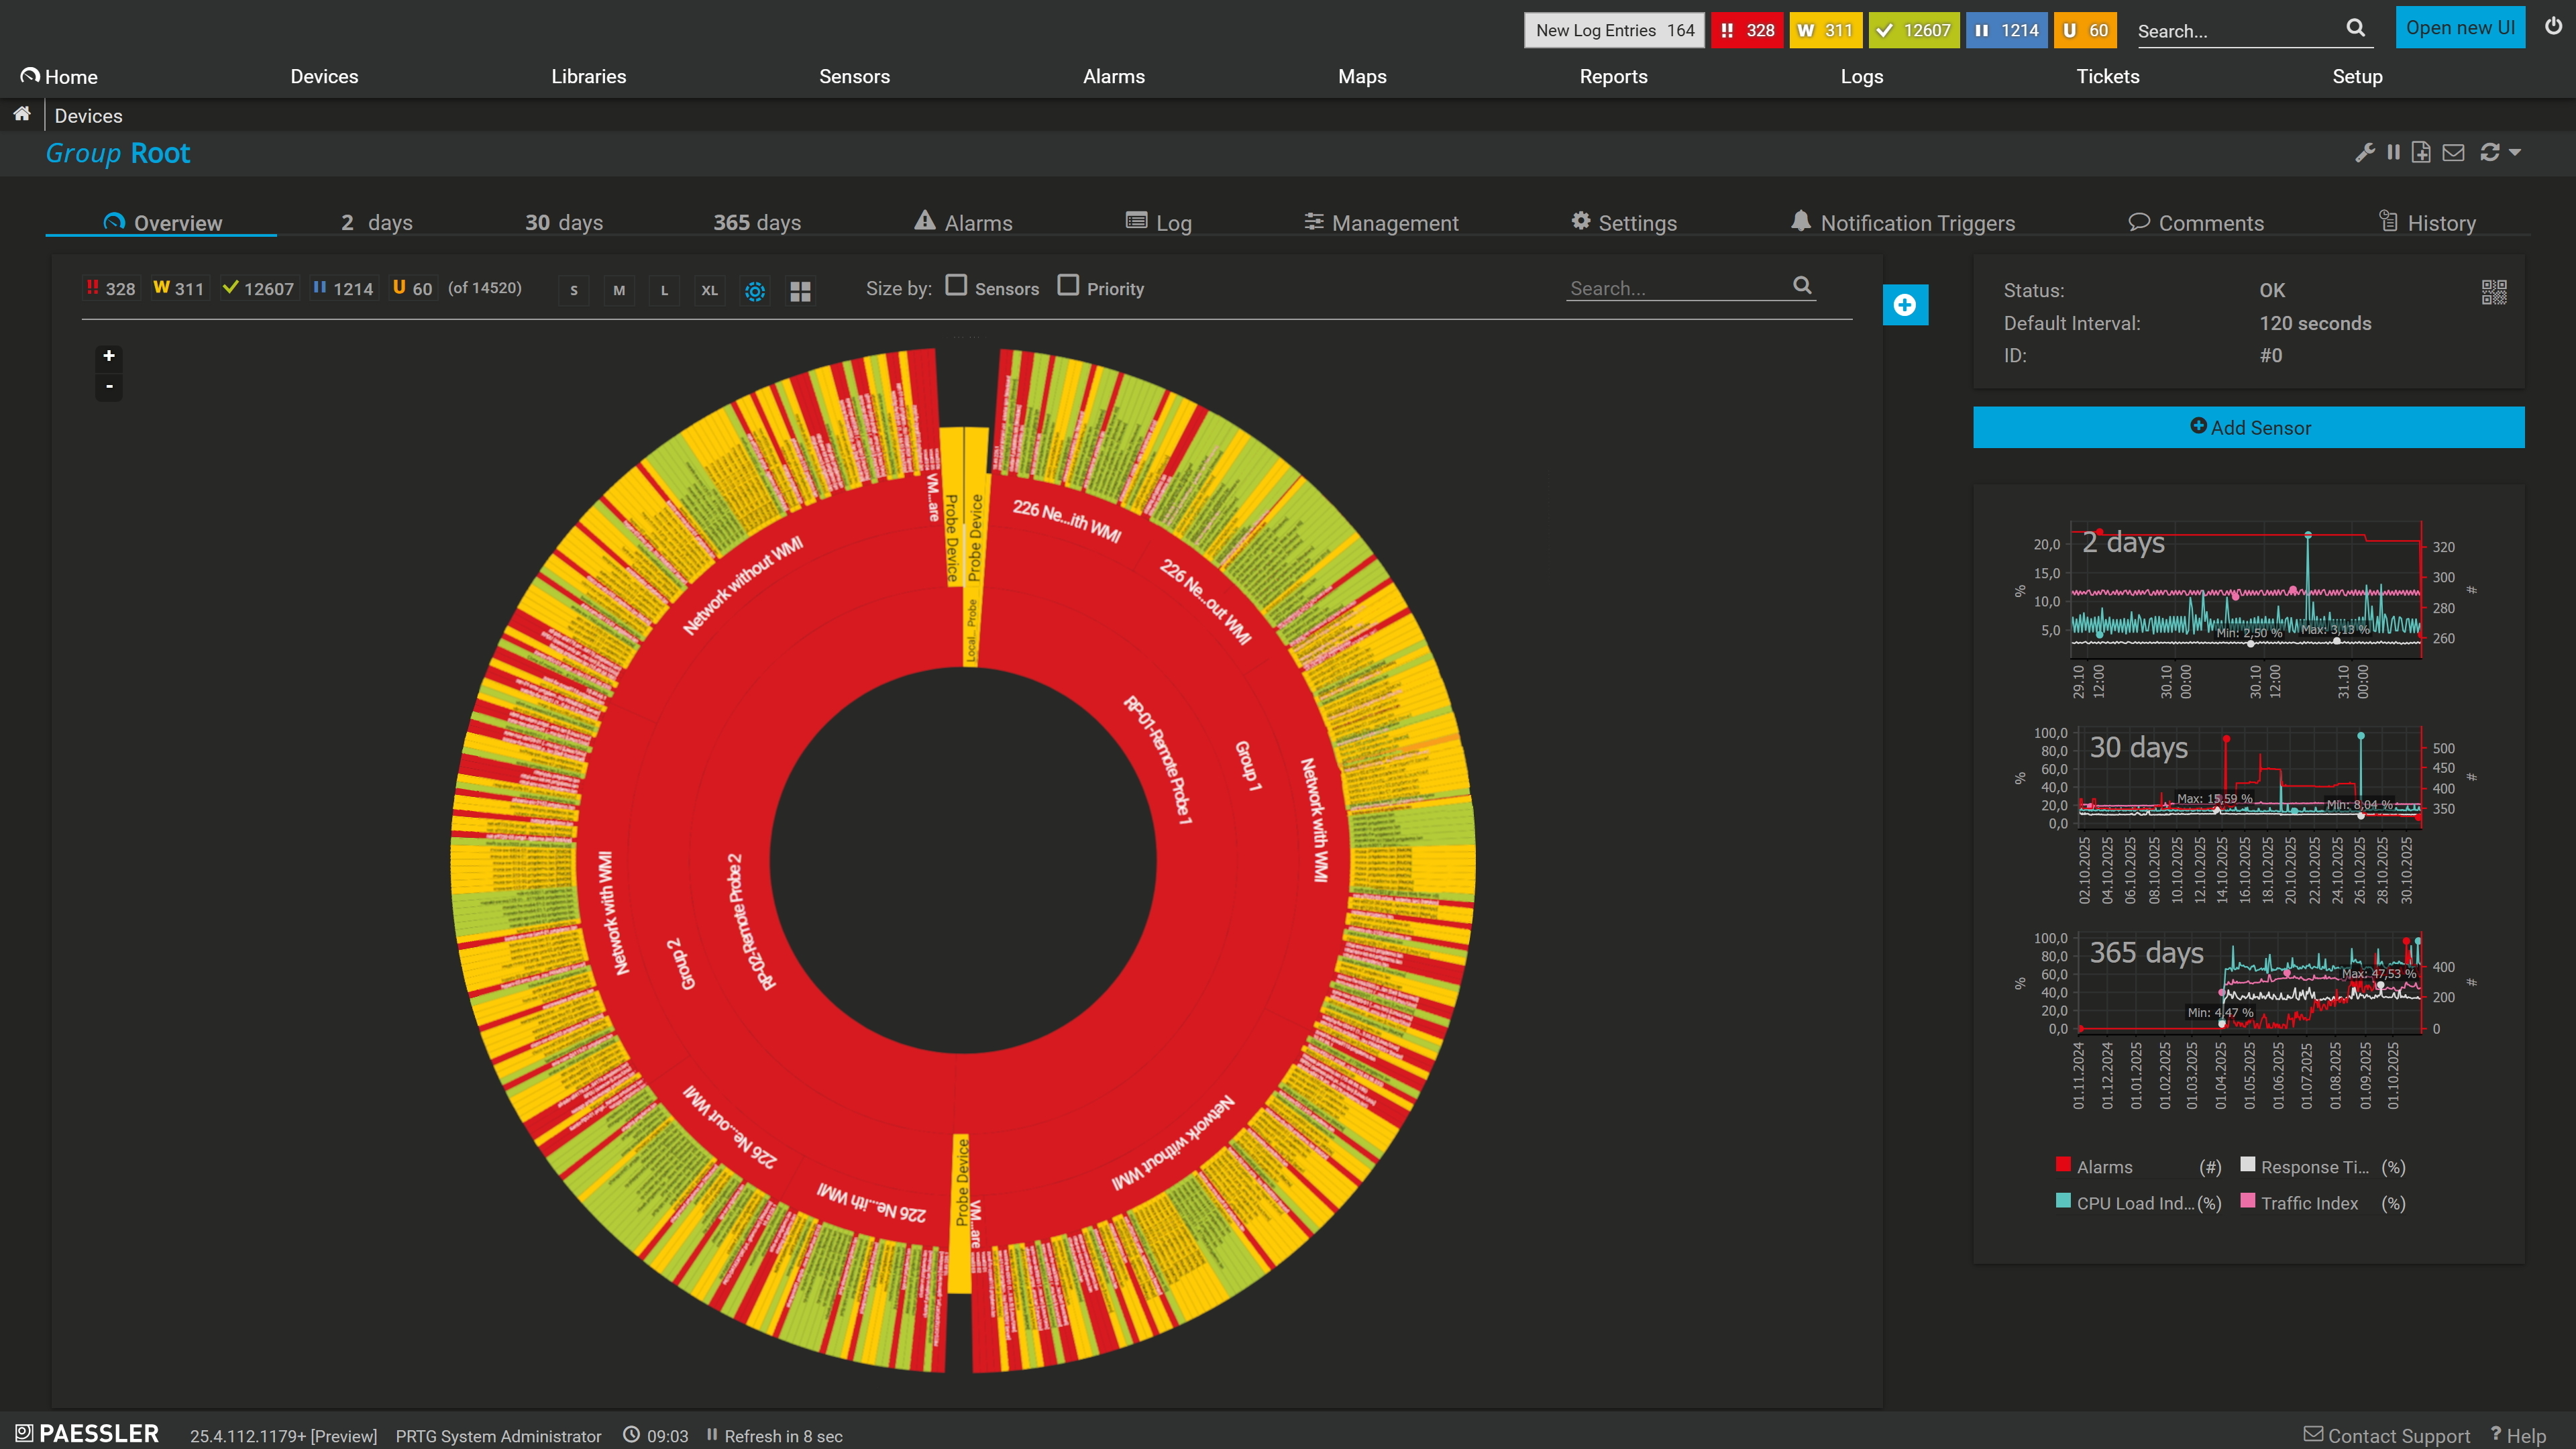
Full device list, instant overview
Traditional SAP monitoring requires agents installed on every application server. That means deployment projects, resource consumption, ongoing agent maintenance, and delays before you see any value. PRTG's Scansor SAP sensors use agentless RFC connections to pull metrics directly from SAP. Paste sensor files into your PRTG directory, create a monitoring user with appropriate permissions, and start monitoring. No agents. No lengthy projects. No extra load on production systems.
PRTG monitors SAP through a partnership with Scansor, providing observability across SAP Basis, databases, cloud integrations, security metrics, and business processes. These SAP monitoring tools connect to SAP via RFC and retrieve metrics in real time, providing comprehensive infrastructure and application server monitoring for your SAP environment. Here's what PRTG monitors in your SAP landscape.
FEATURE | Without PRTG Without PRTG | With PRTG With PRTG |
|---|---|---|
Monitor SAP HANA database performance and memory usage | Without PRTG Log into each HANA instance, run SQL queries for memory and CPU metrics, check backup logs separately, export data to spreadsheets for multi-instance tracking | With PRTG Automated sensor connects via RFC, tracks memory, CPU, backup status, and replication health across all instances, centralized visualization dashboard with threshold alerts |
Track SAP background job failures and delays | Without PRTG Log into SAP GUI, run SM37 transaction for each system, manually filter failed jobs, check job logs individually, correlate job chains across systems | With PRTG SAP Job sensor monitors all jobs with automation, instant alerts on failures or delays, job chain dependencies tracked, historical monitoring data available |
Check SAP system locks and work process utilization | Without PRTG Run SM12 for system locks and SM50 for work processes on each application server, manually correlate data across servers, export to track trends over time | With PRTG SAP System sensor monitors locks and work processes across all servers, real-time utilization dashboards, threshold alerts prevent deadlocks |
Monitor SAP Cloud Connector and hybrid integration flows | Without PRTG Open Cloud Connector admin UI separately, review integration flow logs in SAP Cloud Platform, manually correlate errors between on-premises and cloud systems | With PRTG Automated sensors track Cloud Connector status and integration flow health, unified view of hybrid landscape, API connectivity monitoring included |
Verify SAP database backups across your landscape | Without PRTG Check backup logs on each database server (HANA, Oracle, DB2), verify completion status manually, maintain separate tracking spreadsheet for compliance reporting | With PRTG Backup status monitored automatically for all databases, instant alerts on failures, historical backup records with configurable retention for compliance and SLA reporting |
Choose the PRTG Network Monitor subscription that's best for you.
| License Name | License description | Price | License Details | Get started | Pricing Details | |
|---|---|---|---|---|---|---|
| PRTG 500 | $200 | per month paid annually | Buy nowBuy now | Enough to monitor multiple aspects of 50 devices | ||
| PRTG 1000 | $358 | per month paid annually | Buy nowBuy now | Enough to monitor multiple aspects of 100 devices | ||
| PRTG 2500 | $742 | per month paid annually | Buy nowBuy now | Enough to monitor multiple aspects of 250 devices | ||
| PRTG 5000 | $1,300 | per month paid annually | Buy nowBuy now | Enough to monitor multiple aspects of 500 devices | ||
| PRTG 10000 | $1,642 | per month paid annually | Buy nowBuy now | Enough to monitor multiple aspects of 1000 devices |

Yes. PRTG provides performance monitoring for SAP HANA, Oracle, DB2, Microsoft SQL Server, Sybase, and MaxDB databases used in SAP landscapes. The sensor tracks memory usage, CPU load, disk space, service status, backup completion, and replication health. Multiple database instances can be monitored from a single PRTG installation.
PRTG's Scansor sensors use RFC (Remote Function Call) to connect to SAP. You create a dedicated monitoring user in SAP with required permissions, configure RFC connection settings in PRTG, and the sensors query SAP Basis, databases, jobs, and workflows. This approach eliminates the need to install agents on application servers.
Yes. The SAP Job sensor monitors status, runtime, and dependencies for individual background jobs. Failed, aborted, or delayed jobs are logged. Job chains are tracked to identify where workflows break. Custom thresholds trigger alerts when jobs exceed expected runtime or fail, enabling fast troubleshooting before business processes are impacted.
Yes. PRTG complements SAP Solution Manager and other SAP monitoring tools by providing infrastructure and database monitoring that Solution Manager doesn't cover in depth. While Solution Manager focuses on SAP application layer monitoring, PRTG tracks the underlying infrastructure, databases, network connectivity, and hybrid cloud components. Many organizations use both tools together for comprehensive SAP visibility.
Scansor provides 50 out-of-the-box SAP sensors covering SAP Basis, databases (HANA, Oracle, DB2, SQL Server), background jobs, cloud solutions (Cloud Connector, integration flows), security metrics (certificates, user permissions, syslog errors), and specialized components like ABAP version information, job logs, application logs, faulty PI messages, and tRFC/qRFC queues.
PRTG requires a dedicated monitoring user in SAP with read-only permissions to query system metrics, job status, database information, and Basis components. The specific role and authorization profile are provided with the Scansor SAP sensor package. No write permissions or configuration changes to your SAP system are required. The monitoring user accesses data via RFC without modifying SAP operations.
Network Monitoring Software – Version 26.1.116.1532 (February 9th, 2026)
Download for Windows and cloud-based version PRTG Hosted Monitor available
English, German, Spanish, French, Portuguese, Dutch, Russian, Japanese, and Simplified Chinese
Network devices, bandwidth, servers, applications, virtual environments, remote systems, IoT, and more
Choose the PRTG Network Monitor subscription that's best for you


