• Company
    • About Us
    • Press Center
    • Careers
    • Blog
    • IT Knowledge
    • Contact us
  • Contact us
  • Login
 
  • English
    • Deutsch
    • Español
    • Français
    • Italiano
    • Português
Paessler
                    - The Monitoring Experts
  • Products
    • Paessler PRTG
      Paessler PRTGMonitor your whole IT infrastructure
      • PRTG Network Monitor
      • PRTG Enterprise Monitor
      • PRTG Hosted Monitor
      • PRTG UVexplorer
      • PRTG extensionsExtensions for Paessler PRTGExtend your monitoring to a new level
    • Icon Features
      FeaturesExplore all monitoring features
      • Maps & dashboards
      • Alerts & notifications
      • Multiple user interfaces
      • Distributed monitoring
      • Customizable reporting
  • Solutions
    • By TeamFor your organization size
      • Small Business IT
      • Mid-Market IT
      • Enterprise IT
      • MSP Network Monitoring
    • Industries
      By IndustryFor your business sector
      • Industrial
      • Healthcare
      • Energy
      • Government
      • Education
      • Data Center
      • Finance
    • IT Topics
      By Use CaseFor every technical scenario
      • Network Monitoring
      • Server Monitoring
      • OT Monitoring
      • Distributed Monitoring
      • Network Topology Mapping
      • SNMP Monitoring
      • Bandwidth Monitoring
  • Pricing
  • Resources
    • Getting Started
      Getting StartedModules for self-paced learning
    • How-to Guides
      How-to GuidesGet the most out of PRTG
    • Videos & Webinars
      Videos & WebinarsLearn from Paessler experts
    • Case StudiesProven results across industries
    • PRTG Manual
      PRTG ManualFull documentation
    • Knowledge Base
      Knowledge BaseShare community knowledge
    • PRTG Sensor Hub
      PRTG Sensor HubGet sensors, scripts & templates
    • Trainings
      PRTG TrainingLearn how to work with PRTG
  • Partners
    • Icon Handshake
      Become a PartnerFor resellers and channel partners
    • Icon MSP
      Become an MSPDeliver monitoring as a managed service
    • icon partner
      Partner PortalLog in to your partner account
    • Deal Registration
      Deal RegistrationRegister your sales opportunities
    • icon search
      Find a PartnerFind partners selling Paessler products
    • icon technology
      Technology AlliancesSee Paessler technology partnerships
    • Partner HubTools for Your Success
  • Company
    • About Us
    • Press Center
    • Careers
    • Blog
    • IT Knowledge
    • Contact us
  • Contact us
  • Login
  • English
    • Deutsch
    • Español
    • Français
    • Italiano
    • Português
  • Get a quote
  • Free trial
  1. Home>
  2. Company>
  3. Case Studies>
  4. Somnitec

SCOM, Control-M, and four more tools replaced: how Somnitec consolidated monitoring with PRTG Enterprise Monitor

Challenge: Multiple siloed monitoring tools (SCOM, Control-M) created gaps, alerts complexity, and SLA blind spots

download PDF
Logo Somnitec

COMPANY
Somnitec

INDUSTRY
IT & Telecommunication and MSP (Managed Service Providers)

COMPANY SIZE
SMB

COUNTRY
Switzerland 

SCALE
70+ employees, MSP, private cloud, SAP/HANA environments

Icon gauge

SCOM and Control-M replaced; all monitoring consolidated into PRTG Enterprise Monitorr

Icon database

SAP, database, infrastructure, and network monitoring unified under one platform and interface

Icon alarm

Automated alerting via Teams and SMS routes to available staff based on on-call schedules

The problem

Somnitec AG is a Swiss IT service provider with 70+ employees, specializing in hybrid cloud solutions, SAP/SAP HANA environments, and Microsoft Dynamics 365 for mid-sized businesses. It operates its own private cloud platform and provides end-to-end managed services.

To maintain its strict quality standards, Somnitec was using SCOM, Control-M, and native monitoring from Microsoft and SAP, alongside an existing PRTG installation. The fragmented approach created excessive maintenance overhead, inadequate coverage of certain systems, and no centralized SLA reporting.

Alert management was complex and expensive. The team needed one platform to cover everything: infrastructure, databases, SAP, and all distributed customer locations.

What changed with PRTG

With implementation partner CORP-IT, Somnitec replaced SCOM and Control-M with PRTG Enterprise Monitor after a three-month inventory and planning phase.

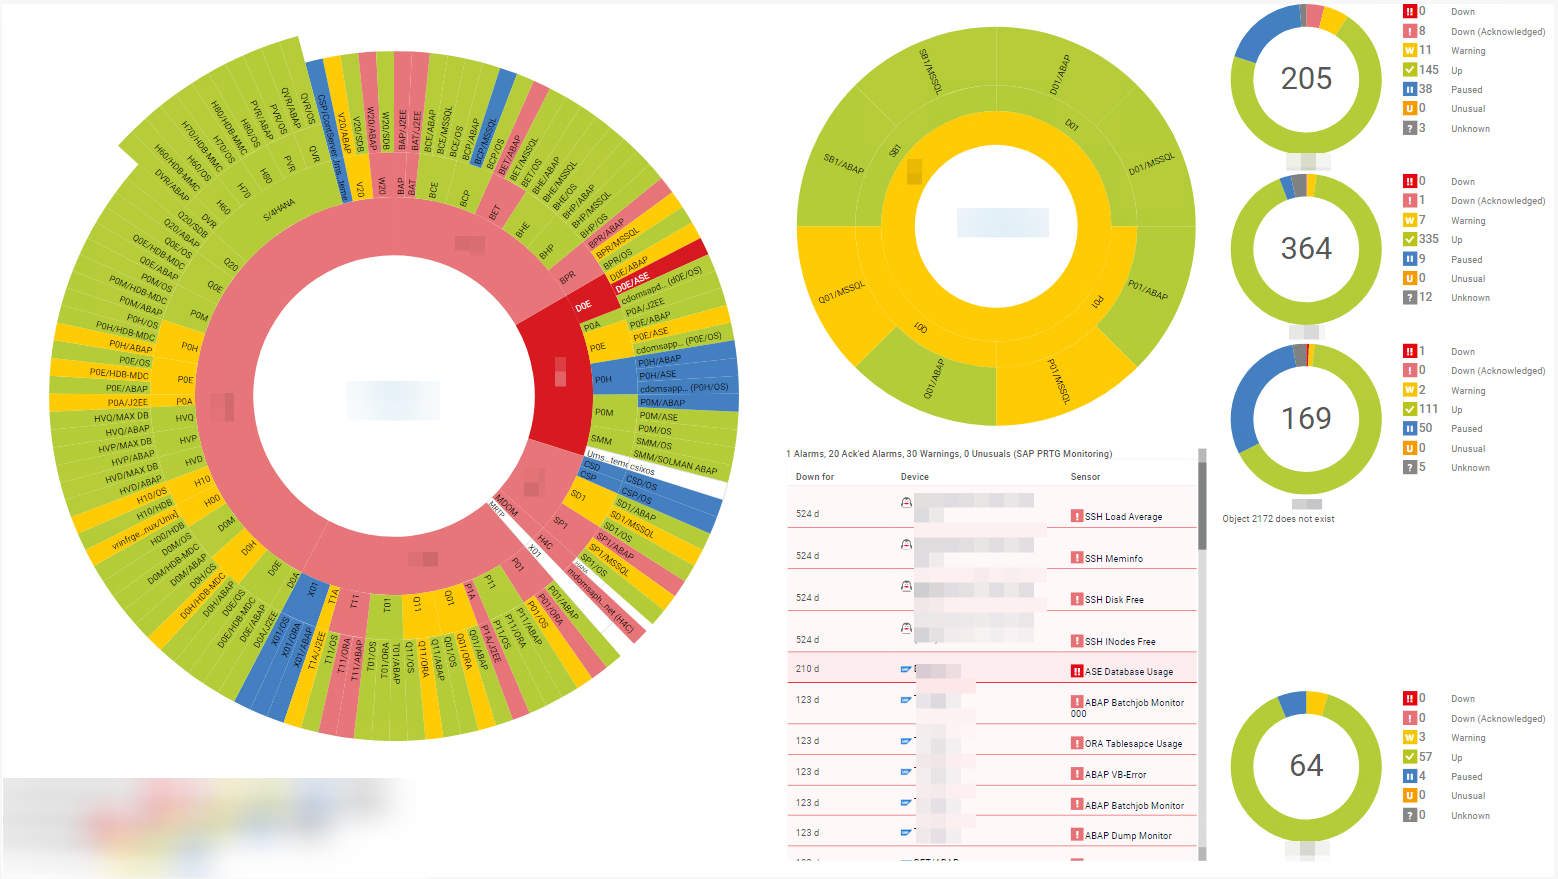
PRTG Enterprise Monitor scales across multiple servers and an unlimited number of remote probes. Customer environments are organized by individual servers and probes, giving Somnitec a clear structural view of its entire managed services landscape.

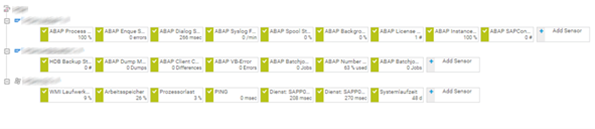
SAP monitoring was fully integrated using standard templates: spool, enqueue, syslog, process list, license, and SAPconnect sensors now cover 60+ primary application servers and 20 Java instances. PRTG Database Observer consolidates HANA, MS SQL, MySQL, Oracle, and Sybase monitoring into PRTG channels.

A link between PRTG's API and Somnitec's inventory system means new devices are monitored automatically. Alerts route via Microsoft Teams and SMS, accounting for staff availability and on-call schedules.

The fact that we were able to replace SCOM and Control-M with PRTG and simultaneously expand our monitoring is nothing short of extraordinary. Thanks to significant improvements in performance, the integration of all monitoring (including that of databases and SAP services) into PRTG, numerous automation options, and the consolidation of all locations into the centralized monitoring system, we have been able to greatly relieve our help desk and provide for the most reliable and comprehensive of monitoring services.

Mirco Blöchliger
Somnitec AG
PRTG Logo

PRTG gives lean university IT teams the proactive visibility they need to serve their communities and focus on innovation.

free TRIAL
screenshot map infrastructure
screenshot dashboard somnitec

Discover more monitoring insights and stories

Solution illustration

Solutions for all your monitoring needs

  • SQL Server Monitoring
  • PostgreSQL Monitoring
  • Redis Monitoring
Content illustration

Powerful stories from the monitoring world

  • Customer success stories - Paessler
  • Customer success story Integrated Precision Systems
  • Monitoring FortiGate Firewalls with Paessler PRTG
Support illustration

Resources to master your monitoring challenges

  • Device and Sensor Setup
  • How can I propose new features or sensors for PRTG?
  • PRTG Apps for Mobile Network Monitoring
Explore All Case Studies

Products

  • Paessler PRTG
    Paessler PRTGMonitor your whole IT infrastructure
    • PRTG Network Monitor
    • PRTG Enterprise Monitor
    • PRTG Hosted Monitor
    • PRTG UVexplorer
    • PRTG extensions
      Extensions for Paessler PRTGExtend your monitoring to a new level
  • Icon Features
    FeaturesExplore all monitoring features

Monitoring with PRTG

  • Network monitoring
  • Bandwidth monitoring
  • SNMP monitoring
  • Network mapping
  • Wi-Fi monitoring
  • Server monitoring
  • Network traffic analyzer
  • NetFlow monitoring
  • Syslog server

Useful Links

  • PRTG Manual
  • Knowledge Base
  • Customer Success Stories
  • About Paessler
  • Subscribe to newsletter
  • PRTG Support
  • PRTG Consulting
  • PRTG Feedback & Roadmap

Contact

Paessler GmbH
Thurn-und-Taxis-Str. 14, 
90411 Nuremberg 
Germany

[email protected]

+49 911 93775-0

  • Contact us
©2026 Paessler GmbHTerms & ConditionsPrivacy PolicyImprintTrust CenterDownload & InstallSitemap
Contact Contact Contact