COMPANY
Process Automation Solutions
INDUSTRY
Manufacturing
INSTALLATION SIZE
Large installation
LOCATION
Germany
With 1400 employees in a global network consisting of more than 50 branch offices in Europe, America and Asia, Process Automation Solutions serves customers in automotive, chemical, pharmaceutical / biotech, food & beverage, oil & gas and other industries.
Its core business focuses on industrial automation, digitalization (industry 4.0) and SAP services (Gold Partner) of which the Business Unit “Digitalization” (> 220 employees) provides solutions and services in the areas of IT/OT, data analytics and historians, cloud (Azure, MS GOLD partner), MES (Manufacturing Execution Systems) and custom IT/OT applications.
“A network without monitoring is like driving a car that’s never had a vehicle inspection. Tire pressure, brakes or the engine can all have problems, but without any checks, they might not be noticed before it’s too late.”
In a nutshell, this is how Pascal Vercammen and Kevin Joos from Process Automation Solutions Belgium explain the importance of monitoring. Within the Digitalization Department, they are responsible for helping manufacturers to better structure and monitor their industrial networks.
To do so, they became a Paessler partner, started using Paessler PRTG Network Monitor and combined it with their know-how of industrial (OT) networks. This is how their solution ‘TINA’ aka ‘The Industrial Network Analyzer’, was born.
Within enterprise IT, monitoring has been essential for years to ensure reliable, secure and robust networks. This is very different within OT environments. Pascal explains the need for industrial monitoring: “In the past, the enterprise and the industrial network were completely separated with very different requirements, such as security versus productivity. We see that within OT, monitoring is not widely used yet for several reasons, but processes are depending on IT systems more and more. The need for a reliable OT network is growing rapidly, and that’s where we come in.”
Obviously, an industrial network has different monitoring requirements to a regular IT network. OT teams want to know about the status of their process automation systems such as DCS’s (Distributed Control Systems), hybrid systems, PLC’s (Programmable Logic Controllers), MES systems such as historians, LIMS (Laboratory Inventory Management Systems), batch management systems, and other specific applications (e.g. based on OPC communication). They also need to monitor network redundancy and industrial protocols such as Profibus.
PRTG is able to monitor a network using a variety of protocols (including SNMP, SSH, OPC UA, MODBUS TCP), Operating Systems (such as Performance Counters, Services), databases (e.g. SQL, Oracle, PostgreSQL), and API’s (e.g. REST). Additionally, all kinds of custom sensors can be scripted or developed (.NET apps, Python, Powershell). PRTG also recommends the best sensors to retrieve your specific data.
Centralized, vendor-agnostic monitoring sends alerts to OT managers on site about potential issues, so they can solve those proactively and prevent delays in the production process.
PRTG is usually installed on a Windows server. If the network is segmented and separated by firewalls, several remote probes can be installed. PRTG is an agentless and active monitoring tool, which means you don’t need agents to be installed on the devices you want to monitor.
PRTG uses all relevant technologies (such as Ping, SNMP, WMI, SOAP, REST and PowerShell) and enables the development of custom sensors. This means you can monitor anything you like, such as the state of hardware or even license use.
Pascal clarifies: “With PRTG and our OT know-how, we can monitor anything. To be honest, the only limit is your own imagination. To give an example: our IT department often got a complaint that the AutoCAD licenses were all in use. We created a custom sensor to monitor how often and when these licenses were used. We discovered that the licenses were used more in the early afternoon than in the late afternoon and solved the issue. These kinds of insights help with license management and justifies whether new investments are required or not.”
In the past, the enterprise and the industrial network were completely separated with very different requirements, such as security versus productivity. We see that within OT, monitoring is not widely used yet for several reasons, but processes are depending on IT systems more and more. The need for a reliable OT network is growing rapidly, and that’s where we come in.
PRTG offers the ability to create dashboards to visualize the network or any part of it. This makes it even easier to see what’s going on in your network.
Pascal adds: “You can simply drag sensors onto a dashboard or place them on a picture. If something goes down, you’ll know exactly where to look. This saves our customers a lot of energy and frustration. And if you feel the need to monitor more parts of your infrastructure, custom sensors will make that possible. And remember: the only limit is your own imagination!”
A petrochemical plant had an issue where occasionally DCS redundant servers were swapped for no clear reason. At first glance, no root cause was found.
We used PRTG to analyze hardware and software anomalies initiating the swap. PRTG identified a memory leak that was causing the Honeywell Experion services to crash on the master server, triggering the redundant server to take over.
A chemicals plant had an issue whenever they executed a project download in the Siemens PC57 network. A part of the network experienced latency and severe packet loss. The plant had no means to determine the root cause of this issue.
PRTG was plugged into the network and a new download was initiated. Packet loss and error packages were observed on a switch crippling the network. PRTG detected the faulty hardware using the SNMP protocol. The network switch was replaced, and all connectivity restored.
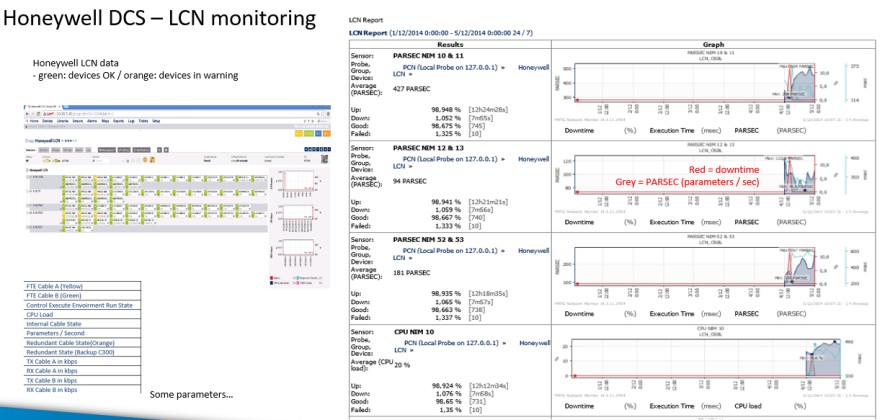
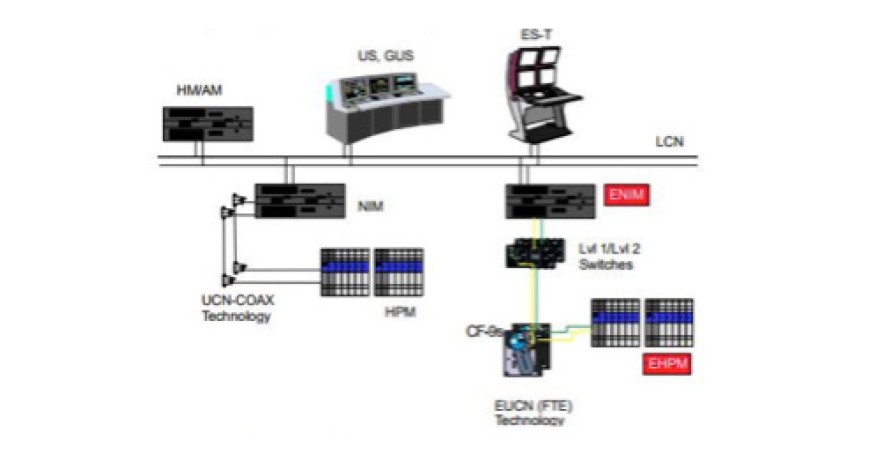
The following system architecture illustrates a typical Honeywell DCS (Distributed Control System), which has legacy technology incorporated with newer automation controllers within the same topology. For example: the LCN is a coaxial-based token ring network, and the same applies to the old UCN coax networks.
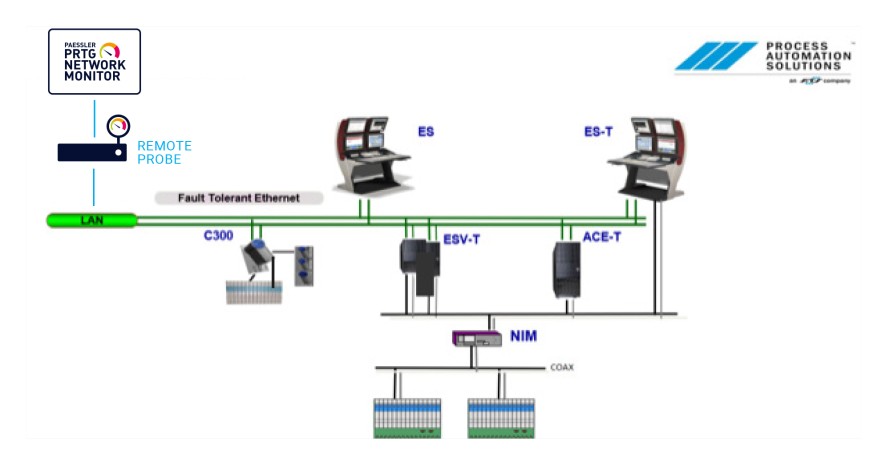
PA Solutions developed custom sensors to monitor Honeywell DCS components and show valuable information within PRTG.


Unlimited use of PRTG for 30 days. After 30 days PRTG reverts to the freeware edition.
You can upgrade to a paid license at any time.
