• Company
    • About Us
    • Press Center
    • Careers
    • Blog
    • IT Knowledge
    • Contact us
  • Contact us
  • Login
 
  • English
    • Deutsch
    • Español
    • Français
    • Italiano
    • Português
Paessler
                    - The Monitoring Experts
  • Products
    • Paessler PRTG
      Paessler PRTGMonitor your whole IT infrastructure
      • PRTG Network Monitor
      • PRTG Enterprise Monitor
      • PRTG Hosted Monitor
      • PRTG UVexplorer
      • PRTG extensionsExtensions for Paessler PRTGExtend your monitoring to a new level
    • Icon Features
      FeaturesExplore all monitoring features
      • Maps & dashboards
      • Alerts & notifications
      • Multiple user interfaces
      • Distributed monitoring
      • Customizable reporting
  • Solutions
    • By TeamFor your organization size
      • Small Business IT
      • Mid-Market IT
      • Enterprise IT
      • MSP Network Monitoring
    • Industries
      By IndustryFor your business sector
      • Industrial
      • Healthcare
      • Energy
      • Government
      • Education
      • Data Center
      • Finance
    • IT Topics
      By Use CaseFor every technical scenario
      • Network Monitoring
      • Server Monitoring
      • OT Monitoring
      • Distributed Monitoring
      • Network Topology Mapping
      • SNMP Monitoring
      • Bandwidth Monitoring
  • Pricing
  • Resources
    • Getting Started
      Getting StartedModules for self-paced learning
    • How-to Guides
      How-to GuidesGet the most out of PRTG
    • Videos & Webinars
      Videos & WebinarsLearn from Paessler experts
    • Case StudiesProven results across industries
    • PRTG Manual
      PRTG ManualFull documentation
    • Knowledge Base
      Knowledge BaseShare community knowledge
    • PRTG Sensor Hub
      PRTG Sensor HubGet sensors, scripts & templates
    • Trainings
      PRTG TrainingLearn how to work with PRTG
  • Partners
    • Icon Handshake
      Become a PartnerFor resellers and channel partners
    • Icon MSP
      Become an MSPDeliver monitoring as a managed service
    • icon partner
      Partner PortalLog in to your partner account
    • Deal Registration
      Deal RegistrationRegister your sales opportunities
    • icon search
      Find a PartnerFind partners selling Paessler products
    • icon technology
      Technology AlliancesSee Paessler technology partnerships
    • Partner HubTools for Your Success
  • Company
    • About Us
    • Press Center
    • Careers
    • Blog
    • IT Knowledge
    • Contact us
  • Contact us
  • Login
  • English
    • Deutsch
    • Español
    • Français
    • Italiano
    • Português
  • Get a quote
  • Free trial
  1. Home>
  2. Company>
  3. Case Studies>
  4. DIVICON MEDIA

Always live on air: how DIVICON MEDIA monitors 400 broadcast locations across Germany with PRTG

Challenge: 30 seconds of silence during a commercial break causes financial and regulatory damage for broadcasters

download PDF
Logo Divicon Media

COMPANY
DIVICON MEDIA

INDUSTRY
Media & Entertainment

COMPANY SIZE
SMB

COUNTRY
Germany

SCALE
400 locations across Germany, NMC, FM/DAB+/streaming

Icon 24/7

400 broadcast locations monitored 24/7; customers notified of issues within 20-30 minutes

Icon maps

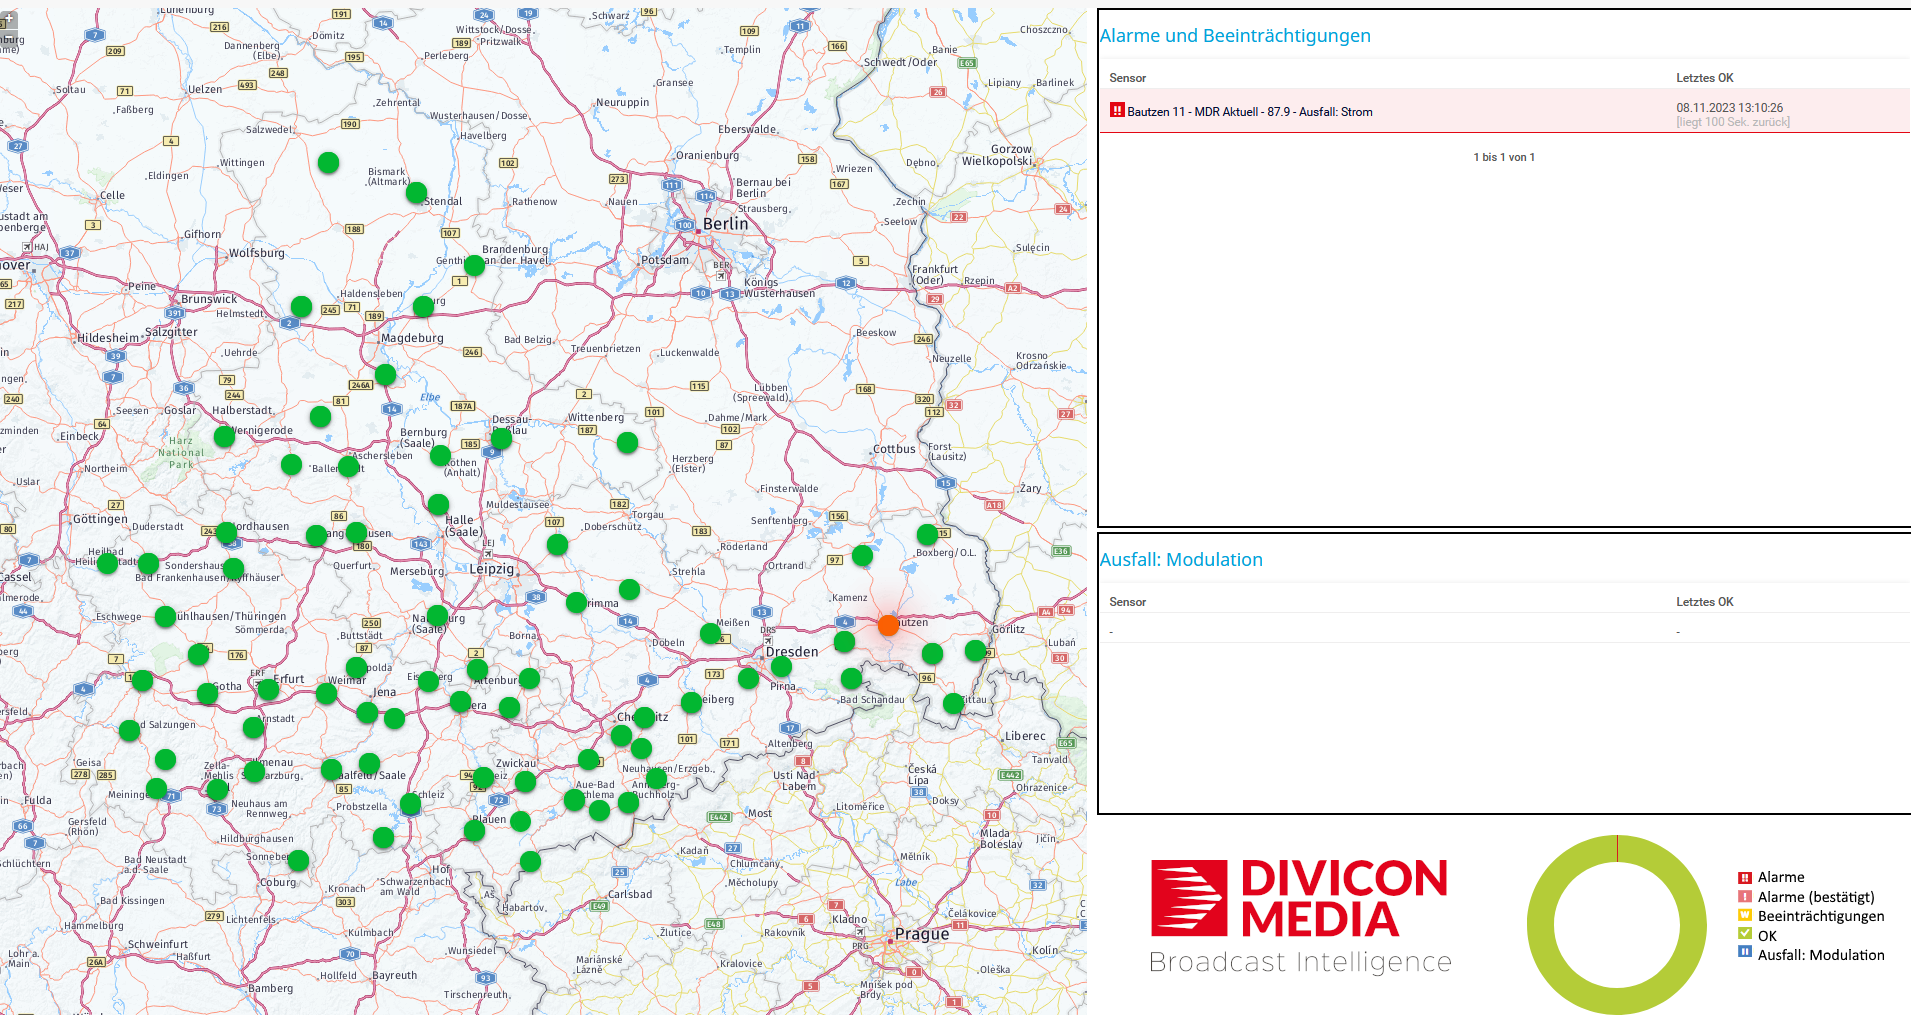
Custom dashboards and weather maps give each broadcaster real-time visibility into their operations

Icon Search

Monitoring success led DIVICON MEDIA to add monitoring as a standalone service offering

The problem

DIVICON MEDIA is a German full-service broadcast operator managing FM frequencies, DAB+ multiplexes, studio technology, and streaming for public and private broadcasters including MDR, Antenne Thüringen, NRJ, and Nordseewelle.

In broadcasting, a 30-second silence during a commercial break is not just a technical incident. It means financial loss for advertisers, reputational damage for the broadcaster, and potential regulatory penalties from the Bundesnetzagentur. Availability must exceed 99.9%.

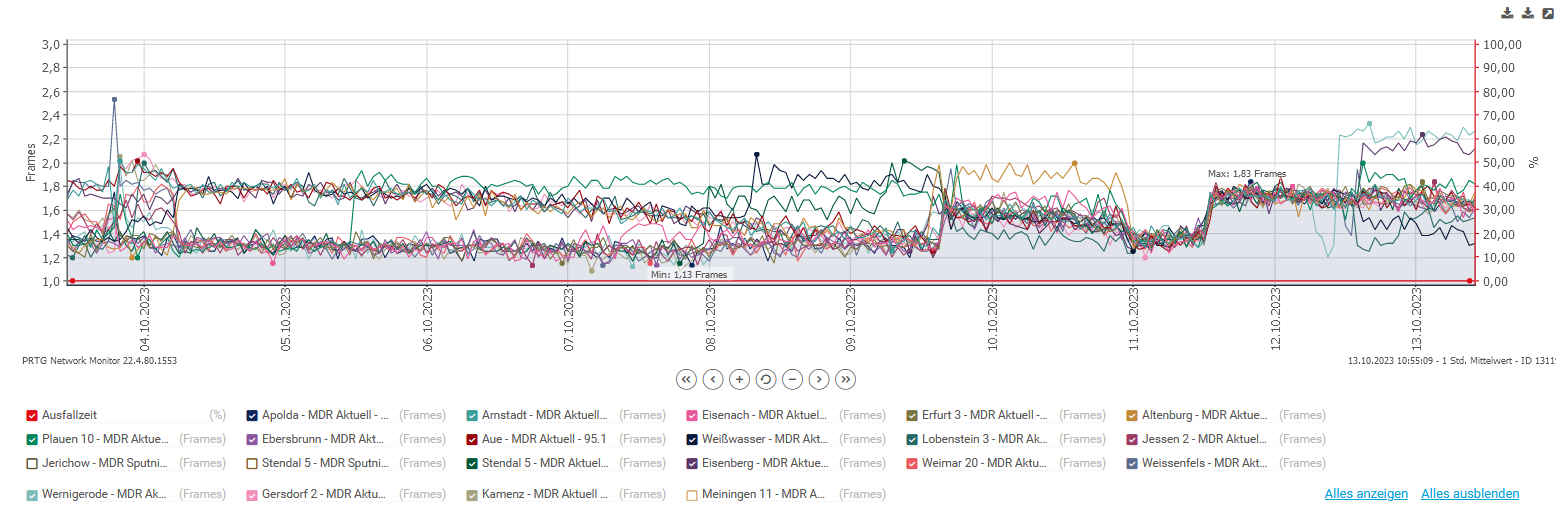
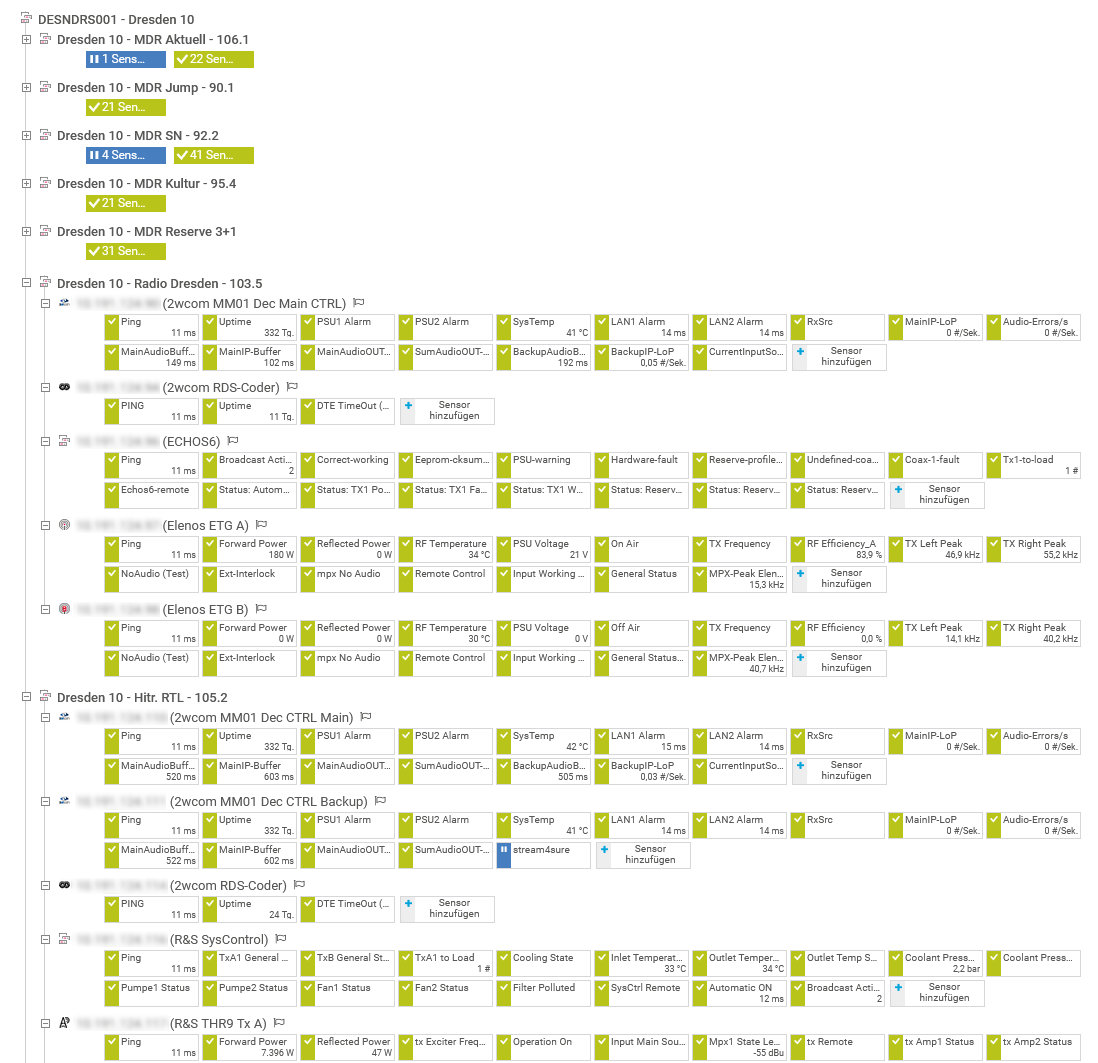
The Network Management Center must monitor 400 locations, 600 audio signals, environmental conditions, broadcasting technology, and external service providers in a single unified system.

What changed with PRTG

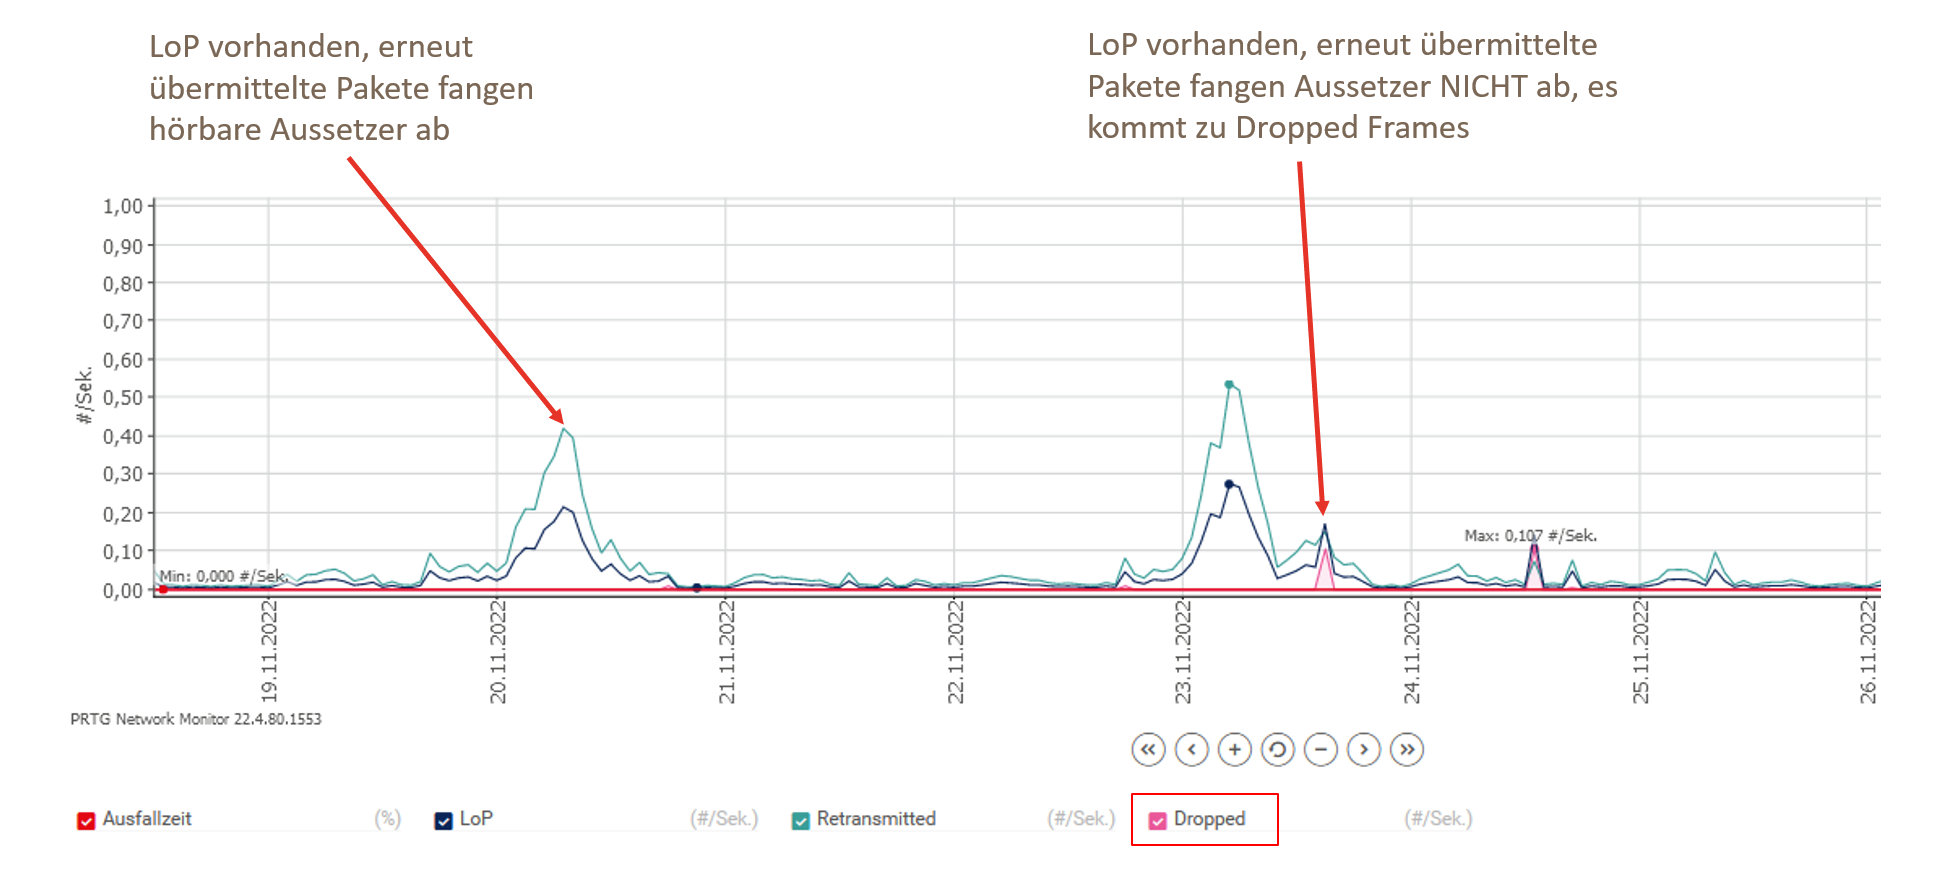
PRTG monitors all parameters from a central NMC. SNMP polling intervals between 30 seconds and 5 minutes cover critical and static values. Traps and syslog messages capture time-critical events to the second.

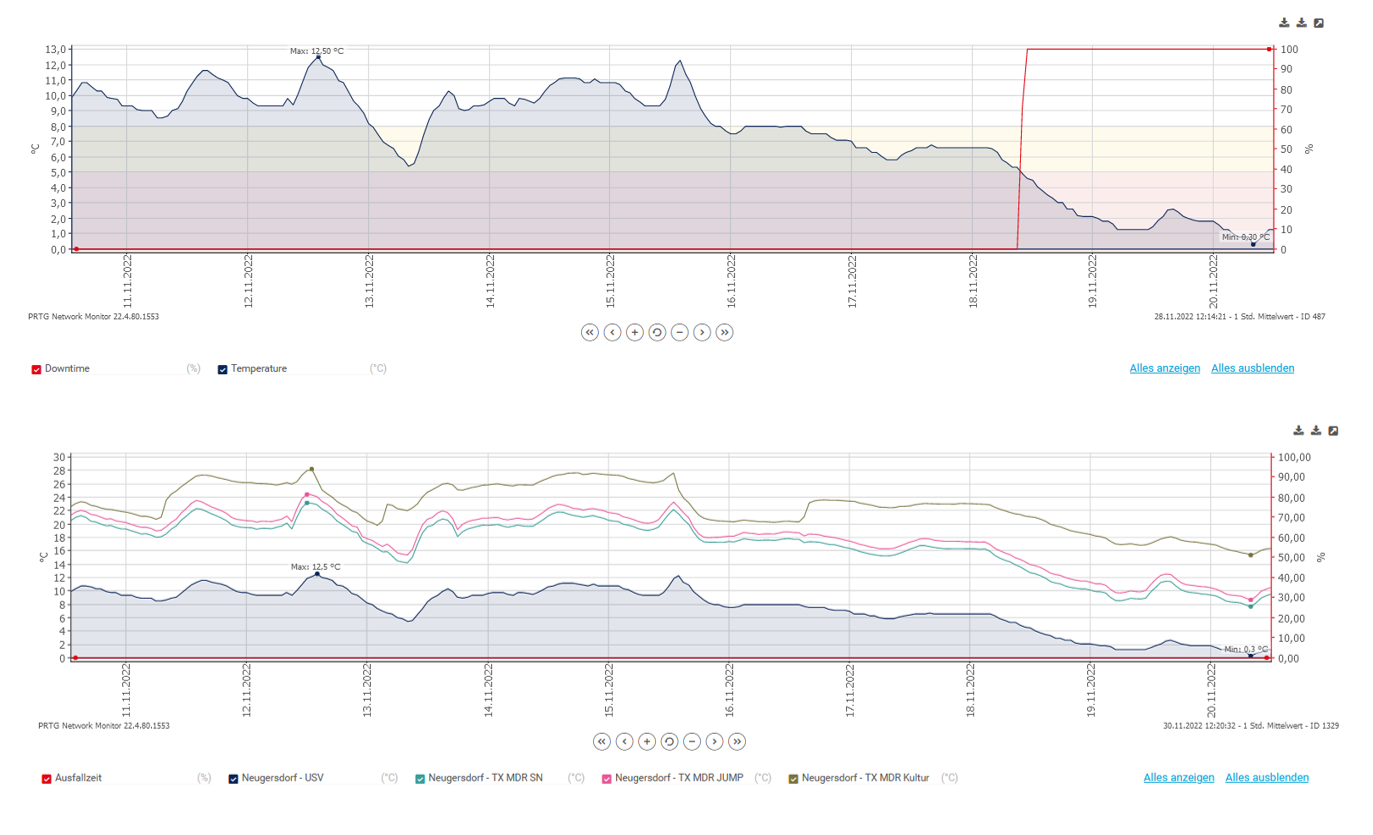
SNMP Custom String sensors consolidate multiple channels to surface correlations between errors. Sensor Factory sensors map complex dependencies across devices and services. Temperature data from all locations is aggregated to identify whether anomalies affect one device or an entire site.

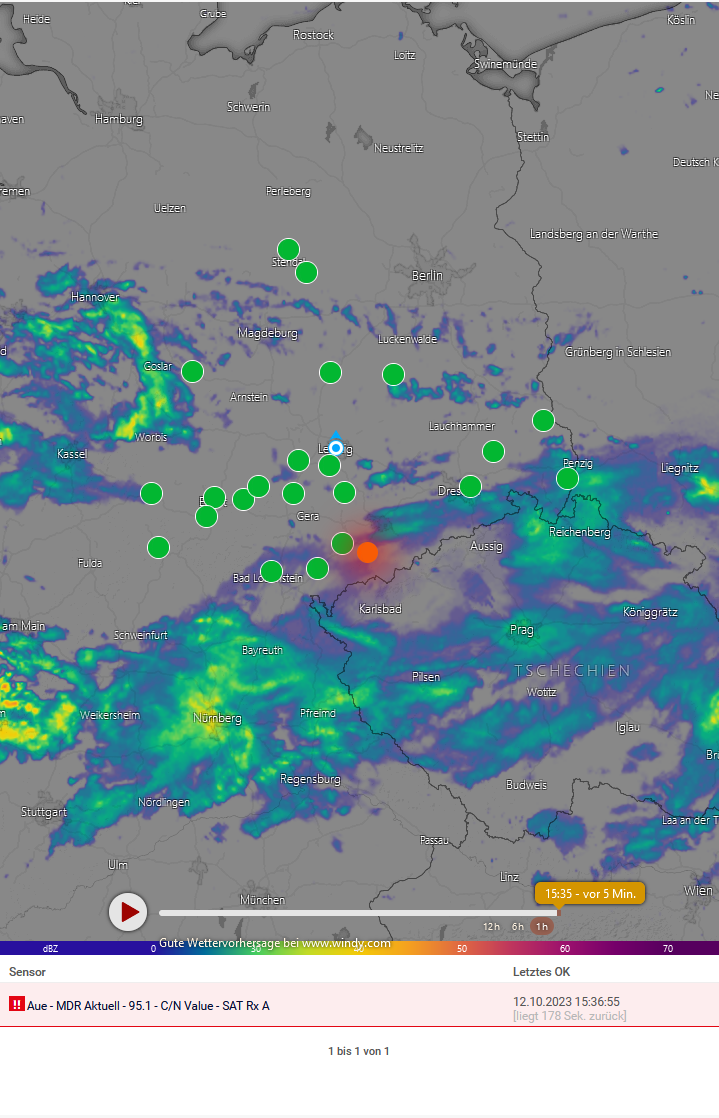
Custom PRTG Maps give each customer a tailored HTML dashboard showing their broadcasting area, live service status, and active disruptions. For satellite-fed stations, a geographic weather map shows current conditions overlaid on transmitter locations.

Redundant alerting via dashboard and messaging ensures no alert is missed under fault conditions.

In order to provide our customers with the best possible service, we must incorporate all the components at our various locations into a central monitoring tool. Round-the-clock monitoring is the only way to detect errors at an early stage and avoid outages.

Marten Hölzer, Broadcast Administrator
DIVICON MEDIA
PRTG Logo

PRTG gives broadcast operators the monitoring depth to protect signal quality, meet SLA obligations, and even build monitoring into a new service line.

free TRIAL
Case Study divicon media tree structure prtg
Case Study divicon media showing site availability
Add Alt text here.
case study divicon media srt protocol
case study divicon media analysis of satellite signals
case study divicon media weather map

Discover more monitoring insights and stories

Solution illustration

Solutions for all your monitoring needs

  • SNMP Monitoring
  • IP Monitoring
  • LAN Monitoring
Content illustration

Powerful stories from the monitoring world

  • Customer success stories - Paessler
  • Customer success story: Riverford & PRTG
  • Understanding MQTT architecture: a deep dive
Support illustration

Resources to master your monitoring challenges

  • How can I use the PRTG Application Programming Interface (API)?
  • How can I move or migrate a PRTG installation to a different system or server?
  • Device and Sensor Setup
Explore All Case Studies

Products

  • Paessler PRTG
    Paessler PRTGMonitor your whole IT infrastructure
    • PRTG Network Monitor
    • PRTG Enterprise Monitor
    • PRTG Hosted Monitor
    • PRTG UVexplorer
    • PRTG extensions
      Extensions for Paessler PRTGExtend your monitoring to a new level
  • Icon Features
    FeaturesExplore all monitoring features

Monitoring with PRTG

  • Network monitoring
  • Bandwidth monitoring
  • SNMP monitoring
  • Network mapping
  • Wi-Fi monitoring
  • Server monitoring
  • Network traffic analyzer
  • NetFlow monitoring
  • Syslog server

Useful Links

  • PRTG Manual
  • Knowledge Base
  • Customer Success Stories
  • About Paessler
  • Subscribe to newsletter
  • PRTG Support
  • PRTG Consulting
  • PRTG Feedback & Roadmap

Contact

Paessler GmbH
Thurn-und-Taxis-Str. 14, 
90411 Nuremberg 
Germany

[email protected]

+49 911 93775-0

  • Contact us
©2026 Paessler GmbHTerms & ConditionsPrivacy PolicyImprintTrust CenterDownload & InstallSitemap
SaaS SaaS SaaS