
• Company
    • About Us
    • Press Center
    • Careers
    • Blog
    • IT Knowledge
    • Contact us
  • Contact us
  • Login
 
  • English
    • Deutsch
    • Español
    • Français
    • Italiano
    • Português
Paessler
                    - The Monitoring Experts
  • Products
    • Paessler PRTG
      Paessler PRTGMonitor your whole IT infrastructure
      • PRTG Network Monitor
      • PRTG Enterprise Monitor
      • PRTG Hosted Monitor
      • PRTG UVexplorer
      • PRTG extensionsExtensions for Paessler PRTGExtend your monitoring to a new level
    • Icon Features
      FeaturesExplore all monitoring features
      • Maps & dashboards
      • Alerts & notifications
      • Multiple user interfaces
      • Distributed monitoring
      • Customizable reporting
  • Solutions
    • By TeamFor your organization size
      • Small Business IT
      • Mid-Market IT
      • Enterprise IT
      • MSP Network Monitoring
    • Industries
      By IndustryFor your business sector
      • Industrial
      • Healthcare
      • Energy
      • Government
      • Education
      • Data Center
      • Finance
    • IT Topics
      By Use CaseFor every technical scenario
      • Network Monitoring
      • Server Monitoring
      • OT Monitoring
      • Distributed Monitoring
      • Network Topology Mapping
      • SNMP Monitoring
      • Bandwidth Monitoring
  • Pricing
  • Resources
    • Getting Started
      Getting StartedModules for self-paced learning
    • How-to Guides
      How-to GuidesGet the most out of PRTG
    • Videos & Webinars
      Videos & WebinarsLearn from Paessler experts
    • Case StudiesProven results across industries
    • PRTG Manual
      PRTG ManualFull documentation
    • Knowledge Base
      Knowledge BaseShare community knowledge
    • PRTG Sensor Hub
      PRTG Sensor HubGet sensors, scripts & templates
    • Trainings
      PRTG TrainingLearn how to work with PRTG
  • Partners
    • Icon Handshake
      Become a PartnerFor resellers and channel partners
    • Icon MSP
      Become an MSPDeliver monitoring as a managed service
    • icon partner
      Partner PortalLog in to your partner account
    • Deal Registration
      Deal RegistrationRegister your sales opportunities
    • icon search
      Find a PartnerFind partners selling Paessler products
    • icon technology
      Technology AlliancesSee Paessler technology partnerships
    • Partner HubTools for Your Success
  • Company
    • About Us
    • Press Center
    • Careers
    • Blog
    • IT Knowledge
    • Contact us
  • Contact us
  • Login
  • English
    • Deutsch
    • Español
    • Français
    • Italiano
    • Português
  • Get a quote
  • Free trial
  1. Home>
  2. Company>
  3. Case Studies>
  4. Noblecom

From four tools to one dashboard: how Noblecom Technology monitors building IT with PRTG 

Challenge: Four siloed monitoring tools created complexity and limited visibility across client buildings

download PDF
Logo Company Noblecom

COMPANY
Noblecom

INDUSTRY
IT & Telecommunication

COMPANY SIZE
SMB

COUNTRY
Malaysia

SCALE
Building technology integrator, data center, multi-sector

Icon Centralized Monitoring

Four monitoring tools replaced by a single PRTG dashboard covering the full IT environment

Icon Alarm

Early network issue detection delivers email alerts before building operations are disrupted

Icon Sheet

Capacity planning now based on actual PRTG usage data rather than estimates

The problem

Noblecom Technology is a Malaysian provider of building technology systems, implementing public address, security control, IPTV, audio-visual, and ICT solutions for hotels, hospitals, government buildings, convention centers, and commercial developments across Malaysia. Once a build is complete, Noblecom maintains long-term operational relationships with its clients.

Its clients' servers and applications are hosted in Noblecom's data center, relying on HPE, Cisco, and AWS network infrastructure. The team monitors workstations, ports, bandwidth, WAN, LAN, servers, and virtual environments including VMware and Hyper-V.

Before PRTG, monitoring was split across Nagios, Spiceworks, SolarWinds, and Zabbix. Each tool covered only part of the picture. The complexity made it impossible to identify and resolve problems efficiently.

What changed with PRTG

Noblecom removed all four existing solutions and replaced them with PRTG across its entire ICT infrastructure. One dashboard now covers the full environment using SNMP, HTTP, SSL, FTP, Ping, Linux, Unix, and port sensors, monitoring workstations, servers, virtual machines, switches, routers, and bandwidth in real time.

Early detection of network issues triggers email notifications to the right people before clients are affected. The team can now proactively identify potential problems before they disrupt critical building operations across all client sites.

Capacity planning improved significantly. Rather than estimating resource requirements, the team now bases decisions on actual usage data from PRTG, enabling much more efficient allocation of network resources and avoiding unnecessary procurement.

Faster problem resolution and reduced downtime followed as the ICT team shifted from reactive troubleshooting to a proactive, data-driven approach.

The ability to monitor our entire IT infrastructure with Paessler’s PRTG monitoring platform within a single dashboard has simplified what was previously an extremely complex job.

Chiew See Gem, Project Manager
Noblecom Technology
PRTG Logo

PRTG gives building technology integrators the unified visibility to manage complex multi-sector client environments and deliver proactive support.

free TRIAL
case study noblecom
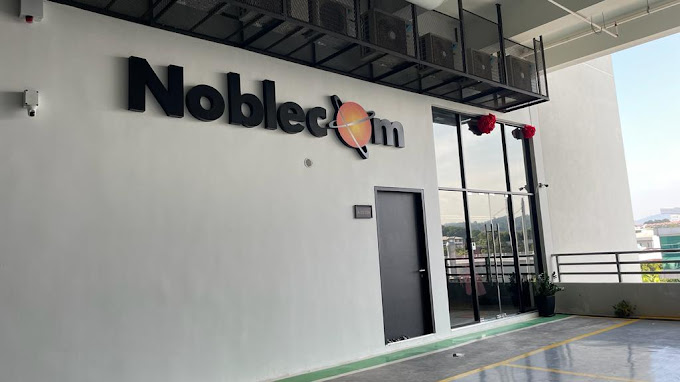
case study noblecom building

Discover more monitoring insights and stories

Solution illustration

Solutions for all your monitoring needs

  • ICT Monitoring
  • SNMP Monitoring
  • CPU Monitoring
Content illustration

Powerful stories from the monitoring world

  • Customer success stories - Paessler
  • Paessler PRTG enables Noblecom Technology to enhance their ...
  • Customer success story Infield ICT
Support illustration

Resources to master your monitoring challenges

  • Understanding Basic Concepts
  • How can I propose new features or sensors for PRTG?
  • Device and Sensor Setup
Explore All Case Studies

Products

  • Paessler PRTG
    Paessler PRTGMonitor your whole IT infrastructure
    • PRTG Network Monitor
    • PRTG Enterprise Monitor
    • PRTG Hosted Monitor
    • PRTG UVexplorer
    • PRTG extensions
      Extensions for Paessler PRTGExtend your monitoring to a new level
  • Icon Features
    FeaturesExplore all monitoring features

Monitoring with PRTG

  • Network monitoring
  • Bandwidth monitoring
  • SNMP monitoring
  • Network mapping
  • Wi-Fi monitoring
  • Server monitoring
  • Network traffic analyzer
  • NetFlow monitoring
  • Syslog server

Useful Links

  • PRTG Manual
  • Knowledge Base
  • Customer Success Stories
  • About Paessler
  • Subscribe to newsletter
  • PRTG Support
  • PRTG Consulting
  • PRTG Feedback & Roadmap

Contact

Paessler GmbH
Thurn-und-Taxis-Str. 14, 
90411 Nuremberg 
Germany

[email protected]

+49 911 93775-0

  • Contact us
©2026 Paessler GmbHTerms & ConditionsPrivacy PolicyImprintTrust CenterDownload & InstallSitemap
SaaS SaaS SaaS