• Company
    • About Us
    • Case Studies
    • Press Center
    • Careers
    • Blog
    • Contact us
  • Contact us
  • Login
 
  • English
    • Deutsch
    • Español
    • Français
    • Italiano
    • Português
Paessler
                    - The Monitoring Experts
  • Products
    • Paessler PRTG
      Paessler PRTGMonitor your whole IT infrastructure
      • PRTG Network Monitor
      • PRTG Enterprise Monitor
      • PRTG Hosted Monitor
      • PRTG UVexplorer
      • PRTG extensionsExtensions for Paessler PRTGExtend your monitoring to a new level
    • Icon Features
      FeaturesExplore all monitoring features
      • Maps & dashboards
      • Alerts & notifications
      • Multiple user interfaces
      • Distributed monitoring
      • Customizable reporting
  • Solutions
    • By TeamFor your organization size
      • Small Business IT
      • Mid-Market IT
      • Enterprise IT
      • MSP Network Monitoring
    • Industries
      By IndustryFor your business sector
      • Industrial
      • Healthcare
      • Government
      • Education
      • Data Center
      • Finance
    • IT Topics
      By Use CaseFor every technical scenario
      • Network Monitoring
      • Server Monitoring
      • OT Monitoring
      • Distributed Monitoring
      • Network Topology Mapping
      • SNMP Monitoring
      • Bandwidth Monitoring
  • Pricing
  • Resources
    • Getting Started
      Getting StartedModules for self-paced learning
    • How-to Guides
      How-to GuidesGet the most out of PRTG
    • Videos & Webinars
      Videos & WebinarsLearn from Paessler experts
    • IT  Knowledge
      IT KnowledgeExpand your IT knowledge
    • PRTG Manual
      PRTG ManualFull documentation
    • Knowledge Base
      Knowledge BaseShare community knowledge
    • PRTG Sensor Hub
      PRTG Sensor HubGet sensors, scripts & templates
    • Trainings
      PRTG TrainingLearn how to work with PRTG
  • Partners
    • Icon Handshake
      Become a PartnerFor resellers and channel partners
    • Icon MSP
      Become an MSPDeliver monitoring as a managed service
    • icon partner
      Partner PortalLog in to your partner account
    • Deal Registration
      Deal RegistrationRegister your sales opportunities
    • icon search
      Find a PartnerFind partners selling Paessler products
    • icon technology
      Technology AlliancesSee Paessler technology partnerships
    • Partner HubTools for Your Success
  • Company
    • About Us
    • Case Studies
    • Press Center
    • Careers
    • Blog
    • Contact us
  • Contact us
  • Login
  • English
    • Deutsch
    • Español
    • Français
    • Italiano
    • Português
  • Get a quote
  • Free trial
  1. Home>
  2. Company>
  3. Case Studies>
  4. Dayton Childrens Hospital

When Clinicians Can’t Wait: Dayton Children’s Hospital Runs on PRTG

Challenge: Reducing after-hours IT failures and keeping clinical systems running with no tolerance for downtime

download PDF
Logo Dayton Childrens Hospital

COMPANY
Dayton Children’s Hospital

INDUSTRY
Healthcare

COMPANY SIZE
Enterprise

COUNTRY
United States

SCALE
20 locations, 4,000+ staff, 22,000 IoT devices, 400+ applications

Icon Uptime

99.99% uptime achieved across more than 20 tier 0 and tier 1 systems

Icon Time

Average unscheduled downtime reduced to 2.4 minutes

Icon Call

After-hours calls from clinicians significantly reduced

Icon Sensor

Custom sensors built for patch monitoring and cyberattack prevention

The problem

At a children’s hospital, IT downtime is not an inconvenience. It is a patient care issue. When clinicians can’t access imaging systems, EHR records, or telemetry data, care slows down.

When Colin Metzler joined the Network Admin Team at Dayton Children’s Hospital, after-hours calls from clinicians reporting technical issues were a constant drain. The existing monitoring tool made it hard to pinpoint the source of a problem. With 4,000 staff across 20 locations using more than 22,000 IoT devices and 400 applications, the team was always reacting instead of preventing.

Healthcare IT is uniquely complex. Structured tiers of systems, strict uptime SLAs, and the direct link between technology performance and patient outcomes leave no room for guesswork.

What changed with PRTG

Metzler had used PRTG previously at a defense contractor and knew it could handle the scale. The team deployed PRTG Enterprise Monitor with ITOps Board, using 21,000 sensors and eight remote probes across all locations.

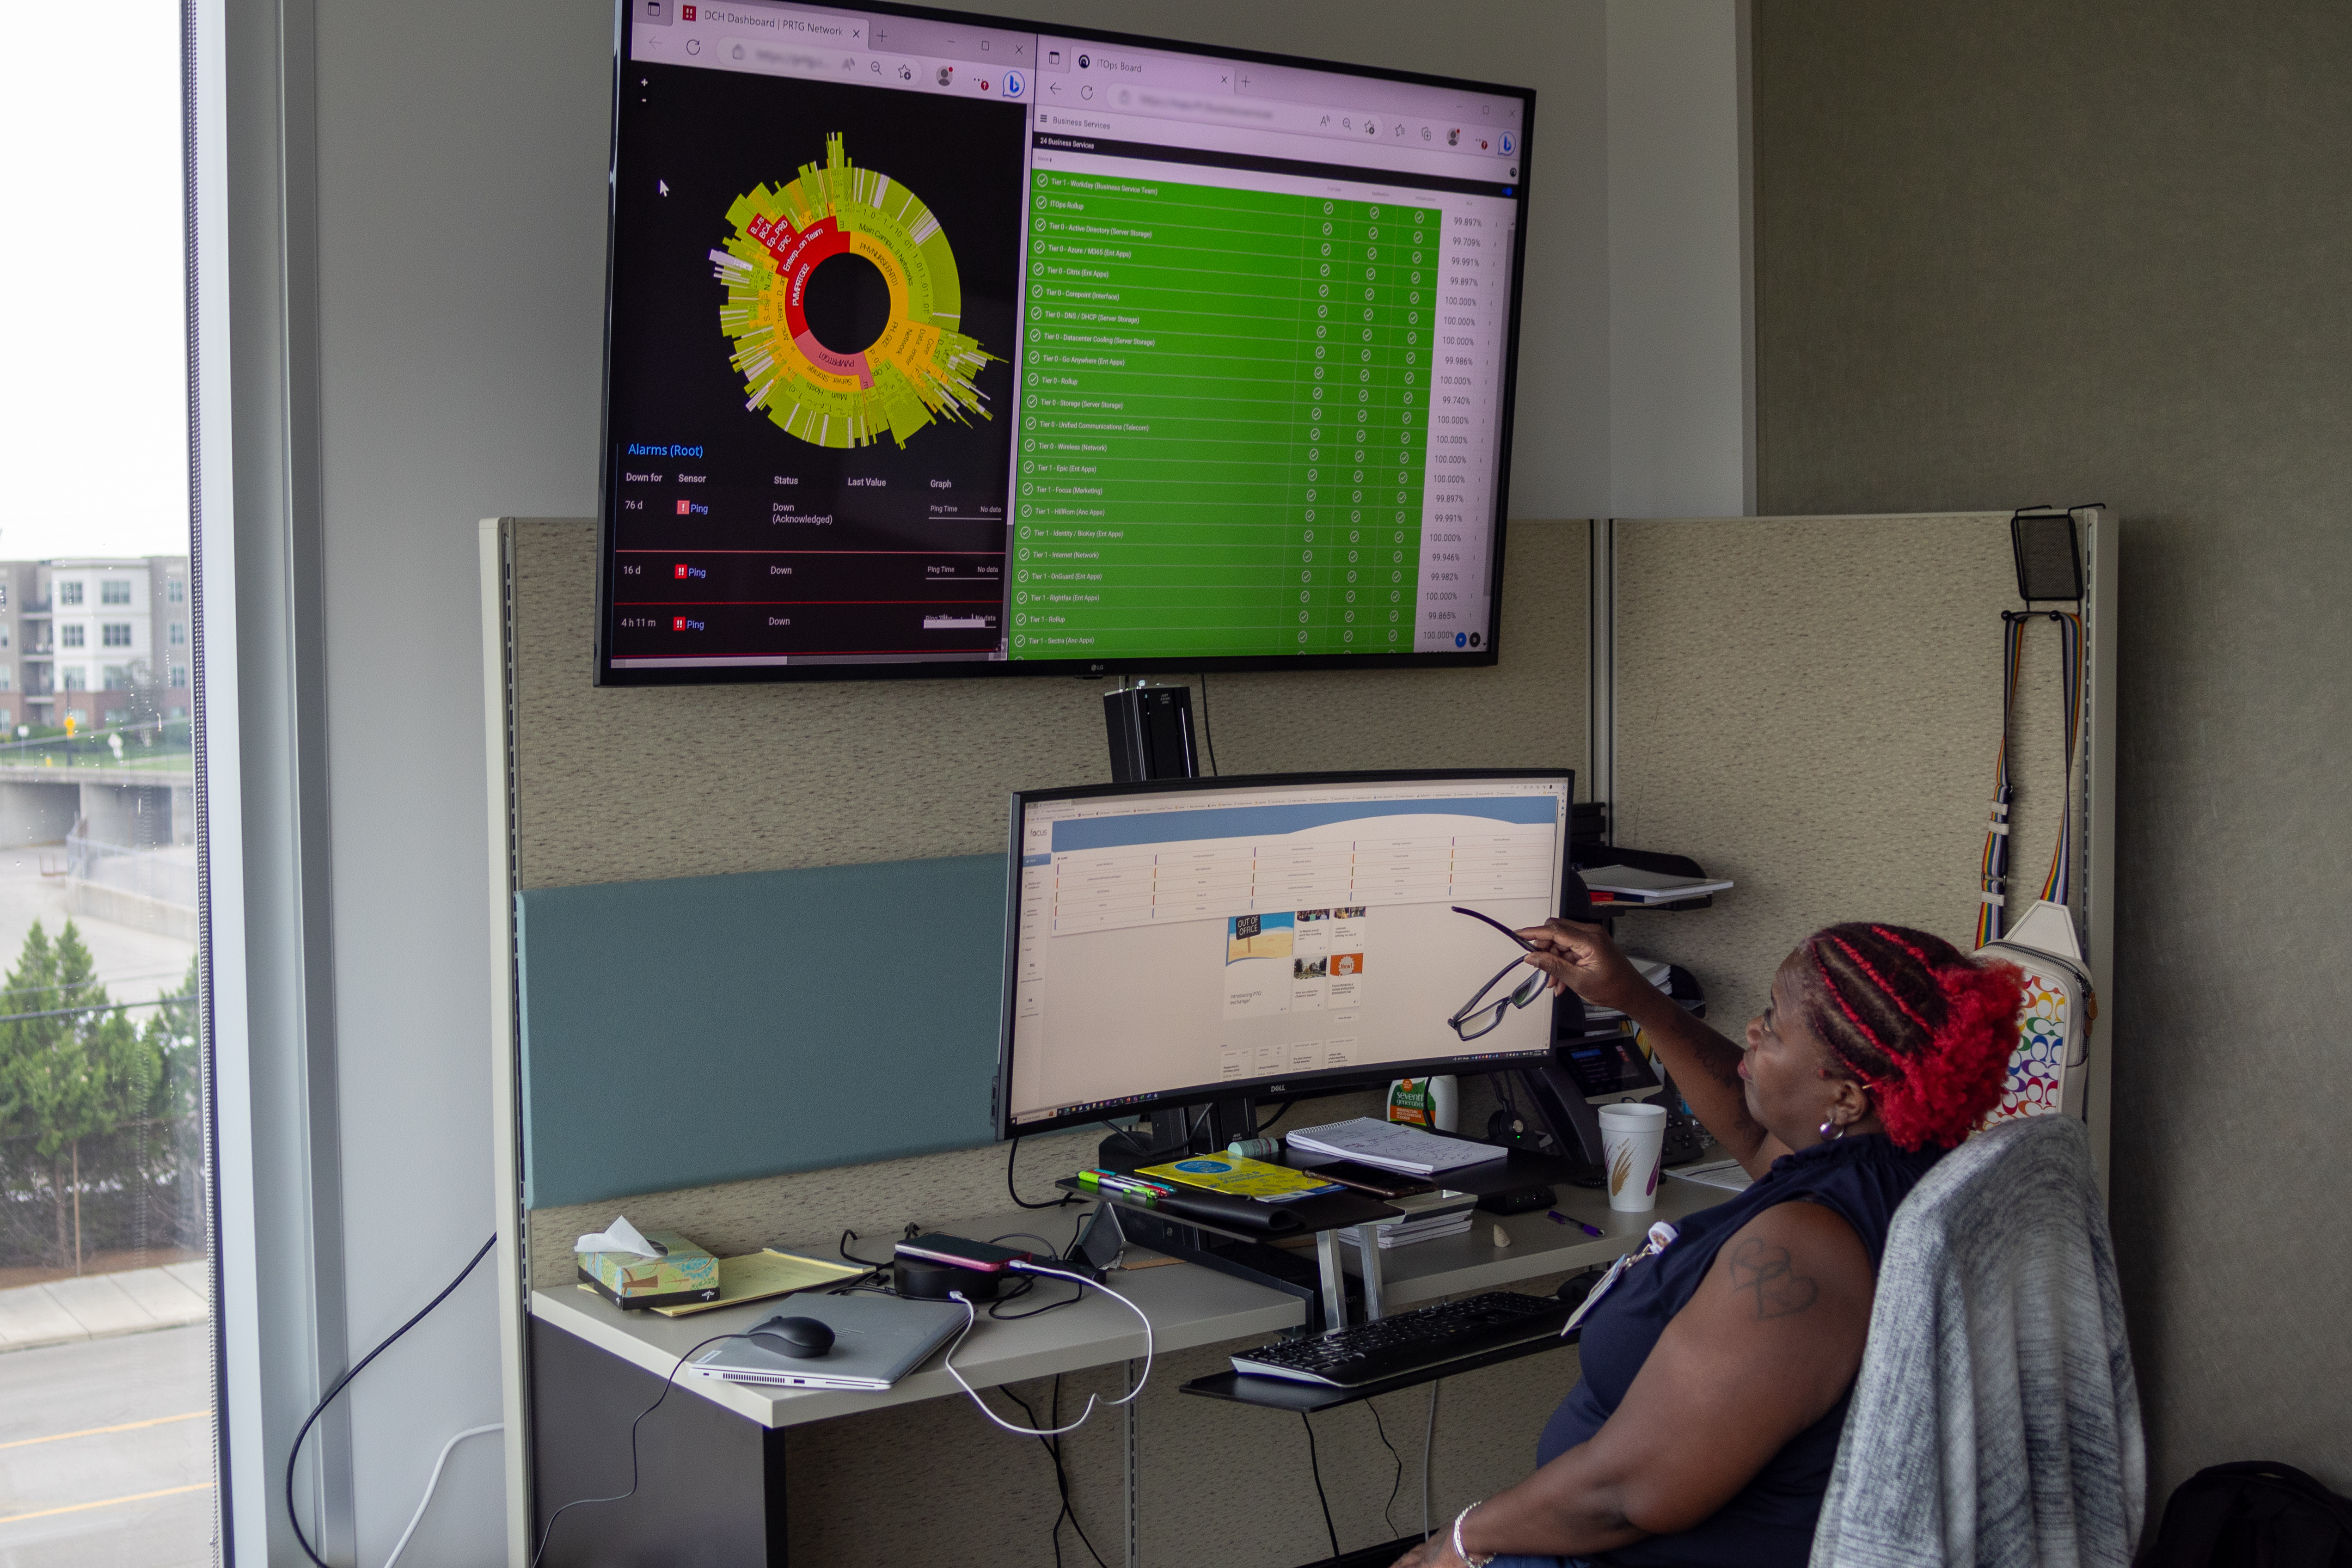
PRTG now monitors top-tier patient-impacting applications first: EHR systems, PACS imaging, clinical communication platforms, and telemetry. If a service degrades, the team knows before clinicians notice.

Every morning, the technology team reviews PRTG reporting together. Percolating issues get flagged early. Cross-team accountability improves. Metzler also built a custom sensor that monitors software release notes pages, triggering immediate patch updates to reduce vulnerability windows and cut cyberattack risk.

Data center temperature, mean time between failures, and SLA compliance are all tracked in one place. Subnetwork scans flag unauthorized devices for security and capacity planning.

PRTG gives a birds-eye view of your network to troubleshoot problems or look at systems in their entirety that other solutions cannot – and I have looked at all of them.

Colin Metzler, Cybersecurity Analyst
Dayton Children’s Hospital
PRTG Logo

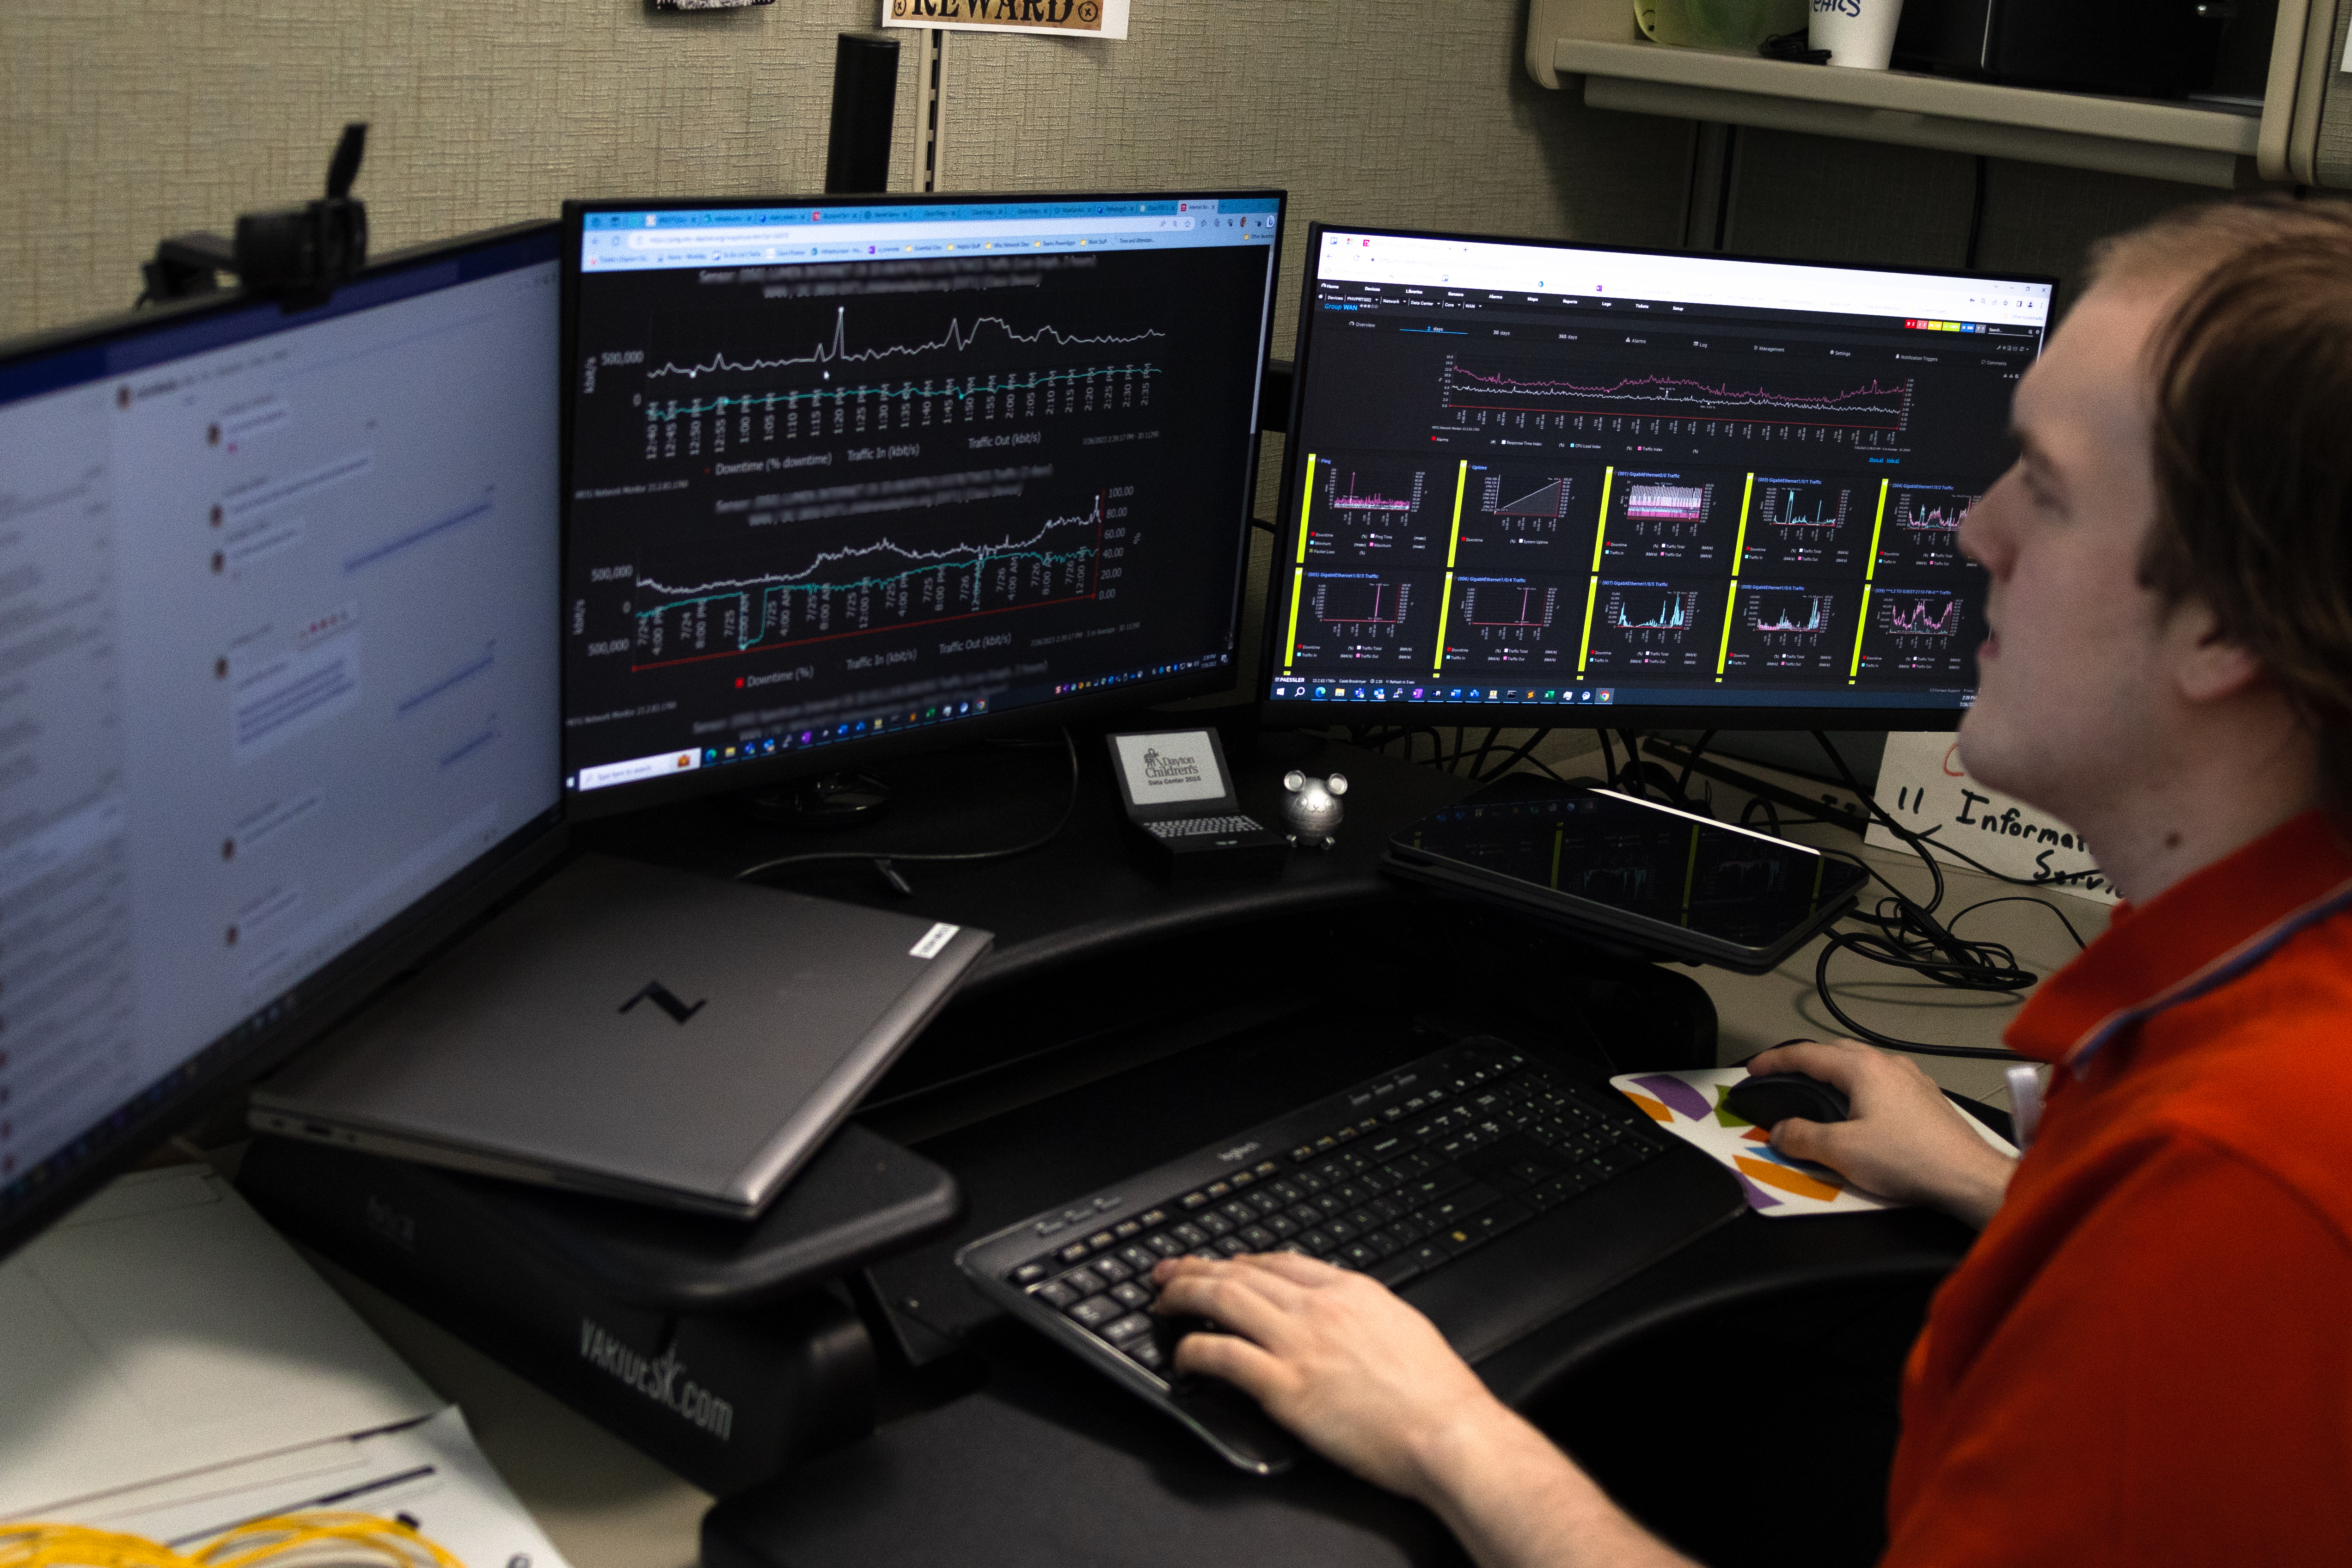
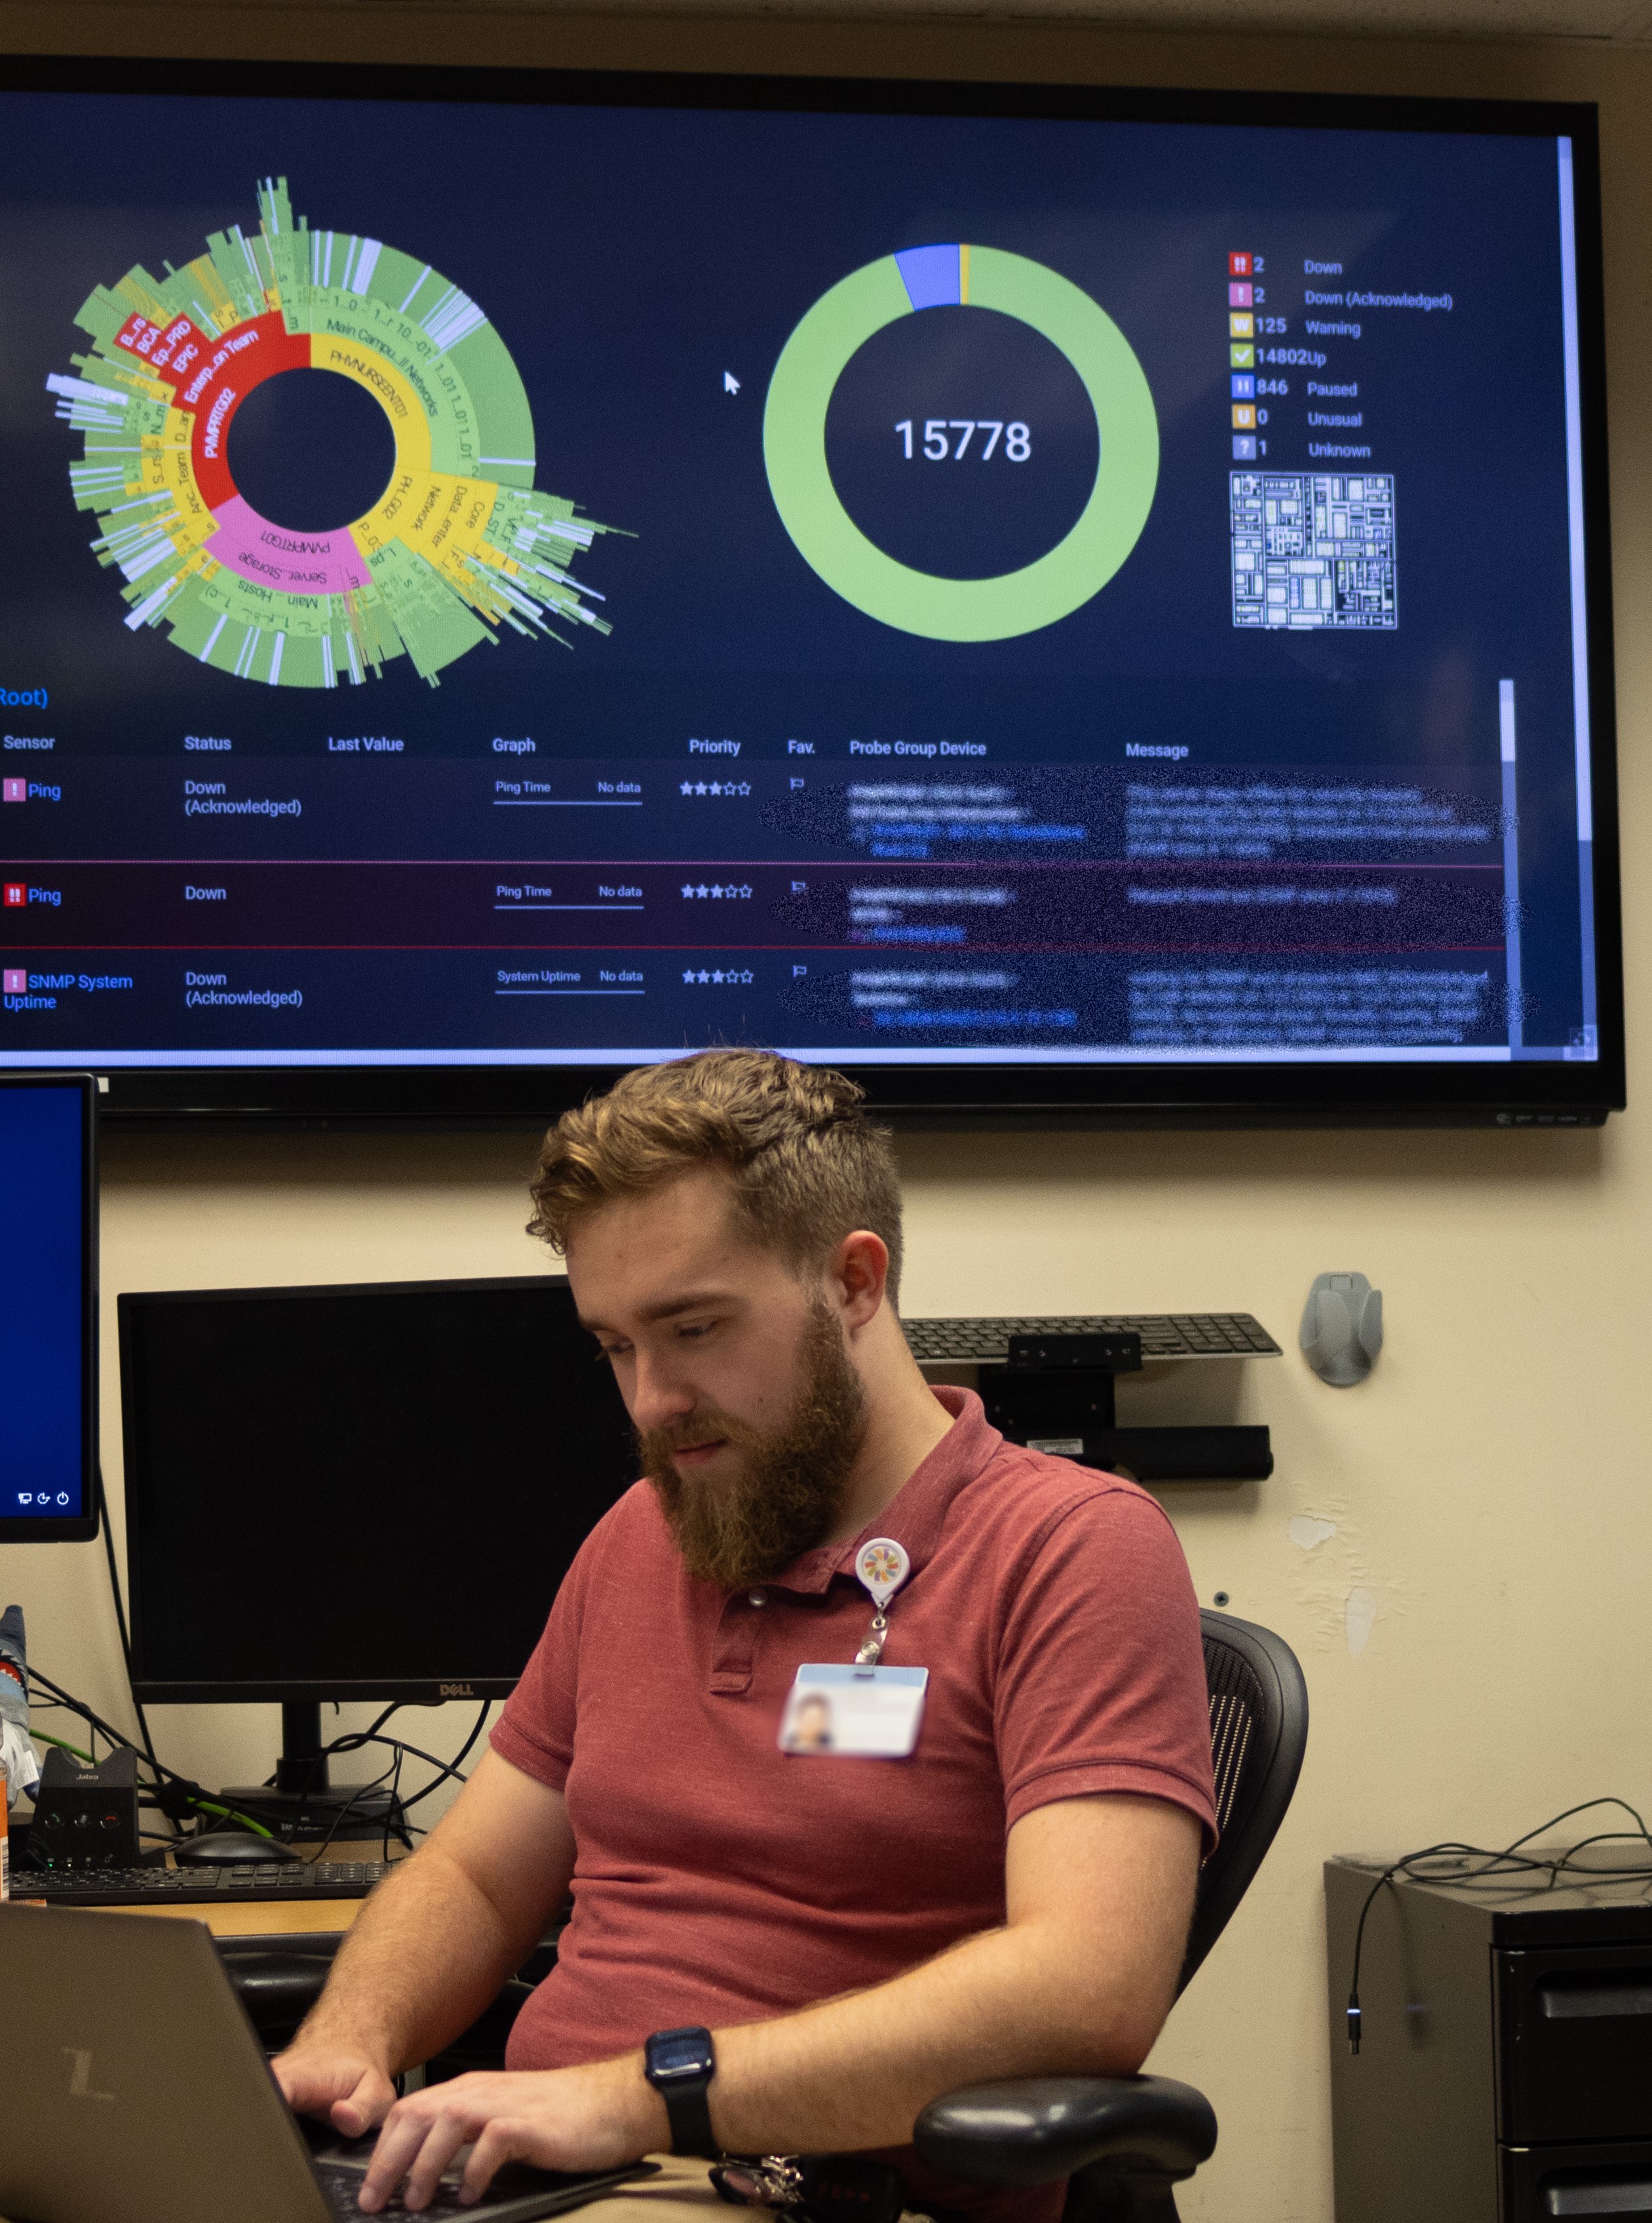
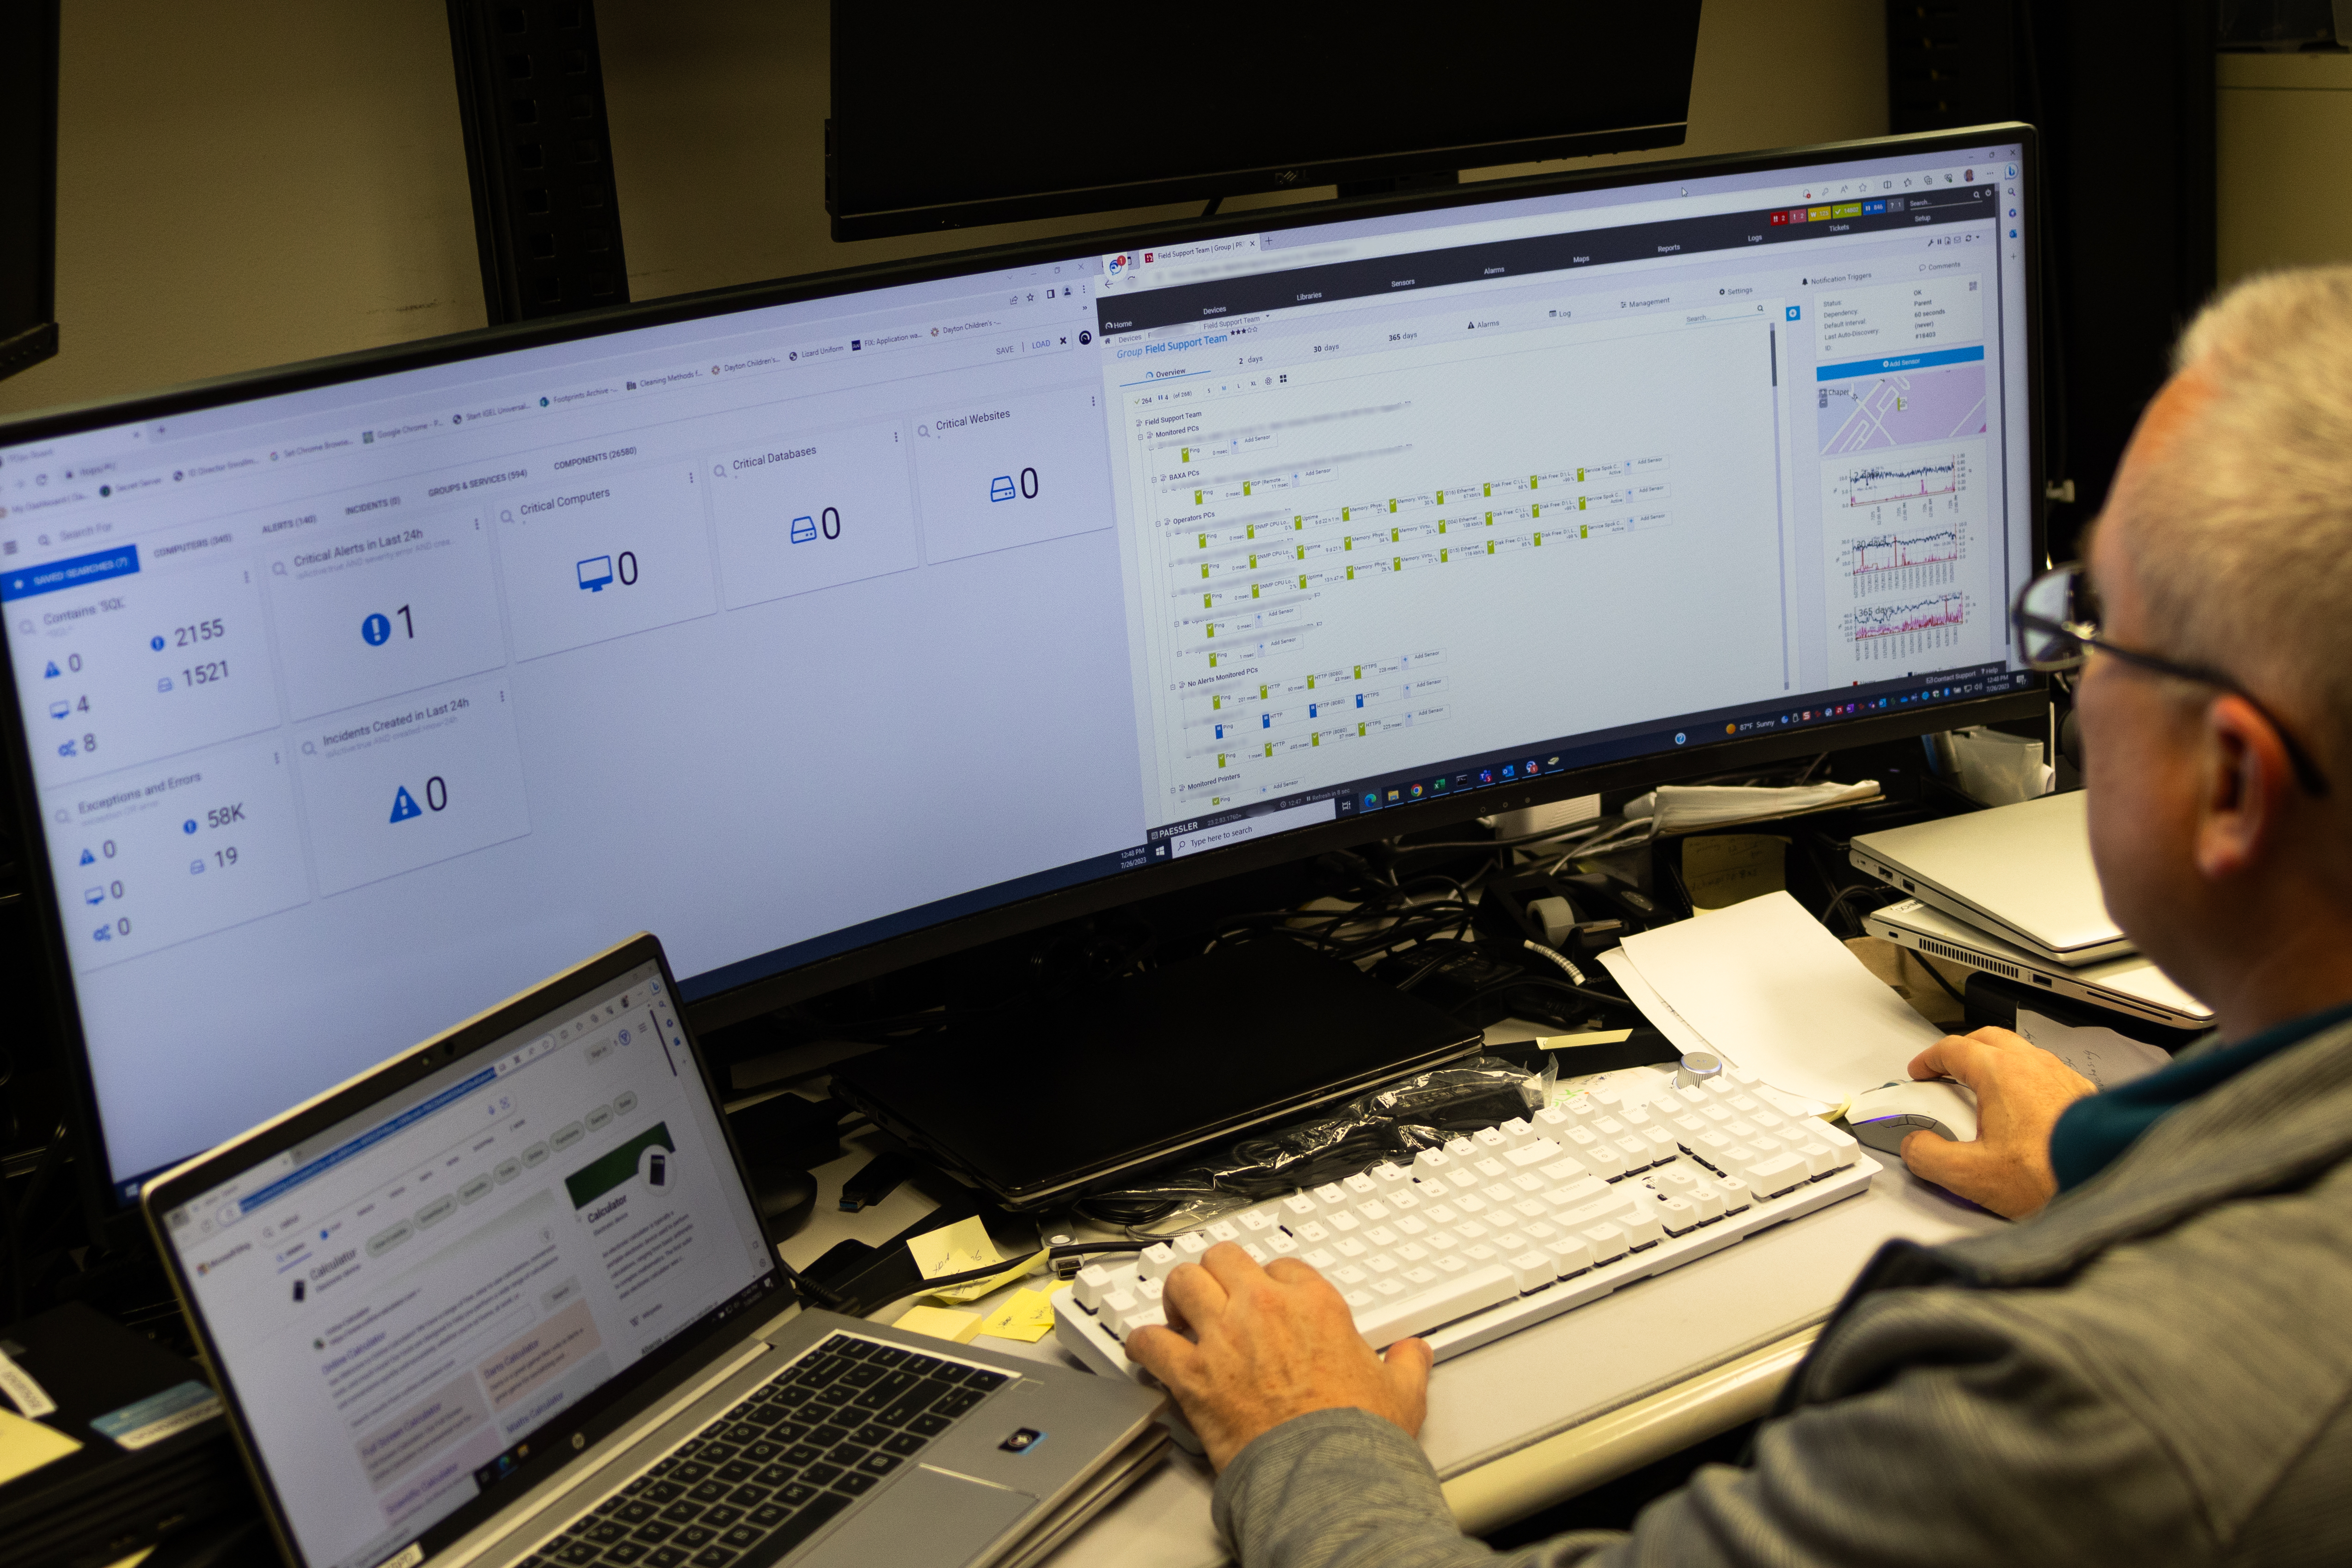
PRTG monitors clinical applications, data center infrastructure, IoT devices, and SLA compliance from one platform.

CONTACT SALES
case study dayton hospital screens
case study dayton hospital hospital screens
case study dayton hospital colin metzler
case study dayton hospital hospital screens

Discover more monitoring insights and stories

Solution illustration

Solutions for all your monitoring needs

  • Server Monitoring
  • NetFlow Monitoring
  • SNMP Monitoring
Content illustration

Powerful stories from the monitoring world

  • Customer success stories - Paessler
  • Customer success story: Riverford & PRTG
  • Monitoring FortiGate Firewalls with Paessler PRTG
Support illustration

Resources to master your monitoring challenges

  • How can I propose new features or sensors for PRTG?
  • Understanding Basic Concepts
  • Device and Sensor Setup
Explore All Case Studies

Products

  • Paessler PRTG
    Paessler PRTGMonitor your whole IT infrastructure
    • PRTG Network Monitor
    • PRTG Enterprise Monitor
    • PRTG Hosted Monitor
    • PRTG UVexplorer
    • PRTG extensions
      Extensions for Paessler PRTGExtend your monitoring to a new level
  • Icon Features
    FeaturesExplore all monitoring features

Monitoring with PRTG

  • Network monitoring
  • Bandwidth monitoring
  • SNMP monitoring
  • Network mapping
  • Wi-Fi monitoring
  • Server monitoring
  • Network traffic analyzer
  • NetFlow monitoring
  • Syslog server

Useful Links

  • PRTG Manual
  • Knowledge Base
  • Customer Success Stories
  • About Paessler
  • Subscribe to newsletter
  • PRTG Support
  • PRTG Consulting
  • PRTG Feedback & Roadmap

Contact

Paessler GmbH
Thurn-und-Taxis-Str. 14, 
90411 Nuremberg 
Germany

[email protected]

+49 911 93775-0

  • Contact us
©2026 Paessler GmbHTerms & ConditionsPrivacy PolicyImprintReport VulnerabilityDownload & InstallSitemap
How to buy How to buy How to buy