Server virtualization using VMware vSphere has been widely adopted for many years and has gained a wide market share. Monitoring a virtualized environment is very critical because any failure will have impact on much more services compared to a non-virtualized environment.
But if you’re new to PRTG, you might ask yourself:
How can PRTG assist me in monitoring this VMware environment?
You can monitor the environment on the different layers. PRTG offers monitoring capabilities for all of them. Therefore, PRTG can monitor the entire stack down from the hardware up to the services within your virtual machines.
Get full visibility with real-time dashboards, alerts, and customizable sensors
Many servers provide an out-of-band-management controller to control environmental parameters.
Examples are HPE iLO for the ProLiant servers, or Dell iDrac, Fujitsu iRMC, IBM IMM.
PRTG has built-in sensors for HPE ProLiant, Dell, Fujitsu and IBM X series servers to monitor server hardware health using the out-of-band-management controllers.
These controllers work independent of any operating system and usually provide a good overview about your server’s hardware, like temperatures, fans, power supplies, and more.
Here is an overview of the PRTG sensors:
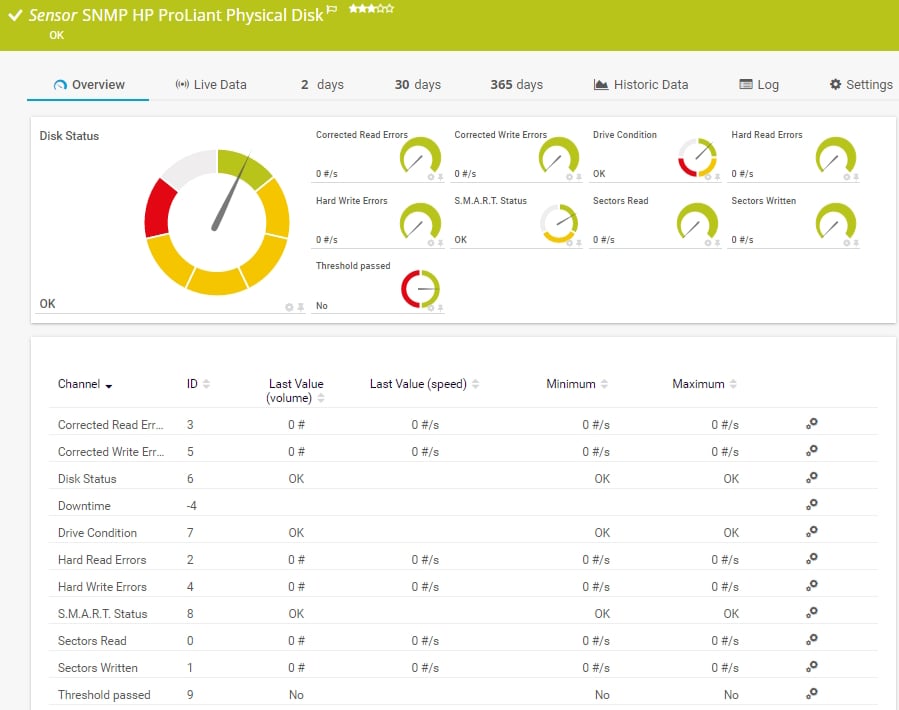
The SNMP HPE ProLiant Physical Disk sensor monitors a physical disk in an HPE ProLiant server. It can show the following:
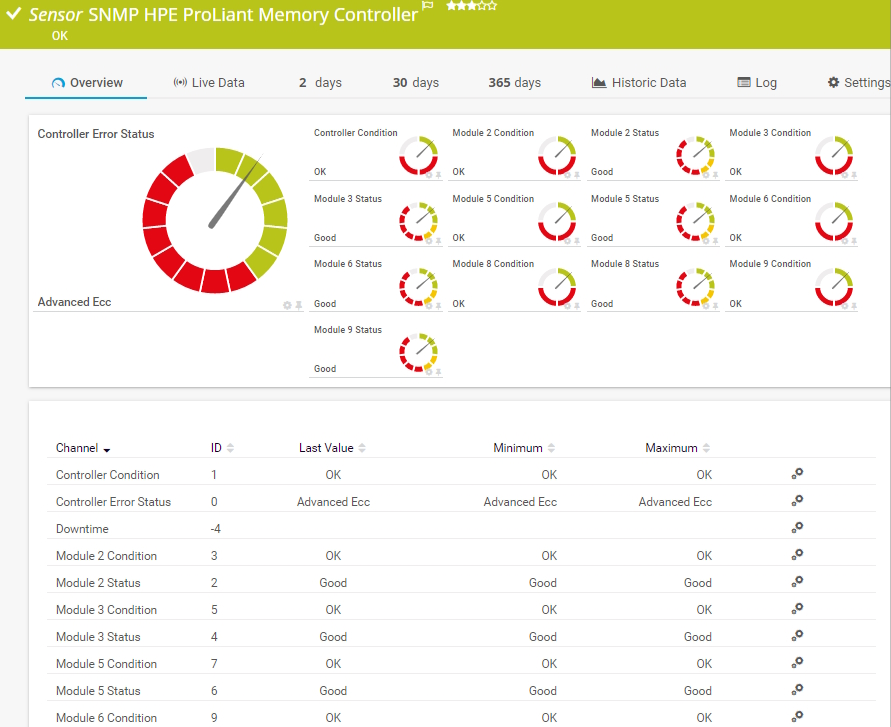
The SNMP HPE ProLiant Memory Controller sensor monitors a memory controller in an HPE ProLiant server. It can show the following:
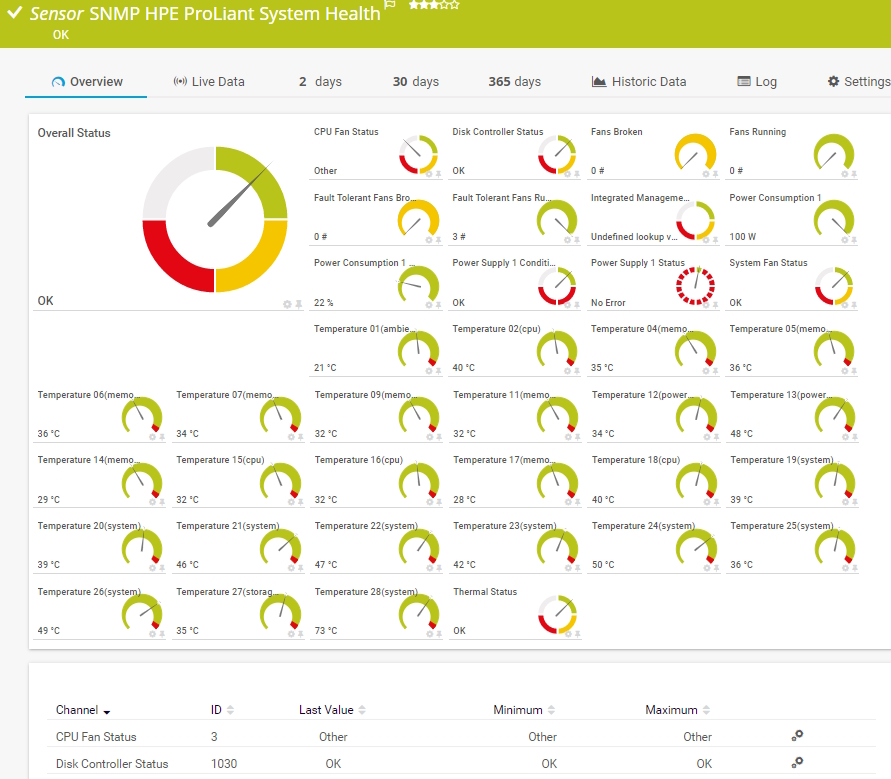
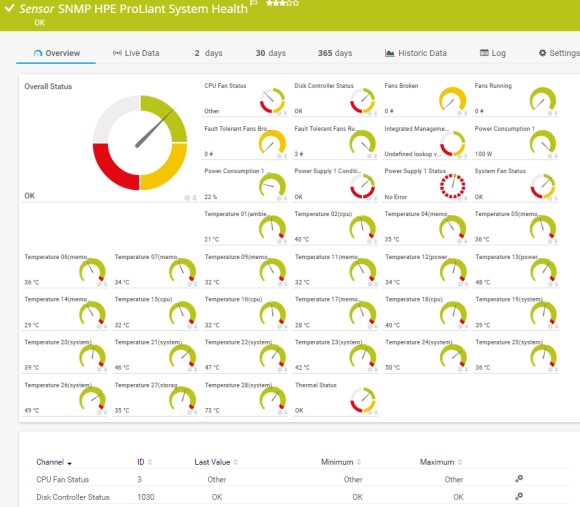
The SNMP HPE ProLiant System Health sensor monitors the system health of an HPE ProLiant server. It can show the following:
• Overall, CPU fan, system fan, thermal, and disk controller status
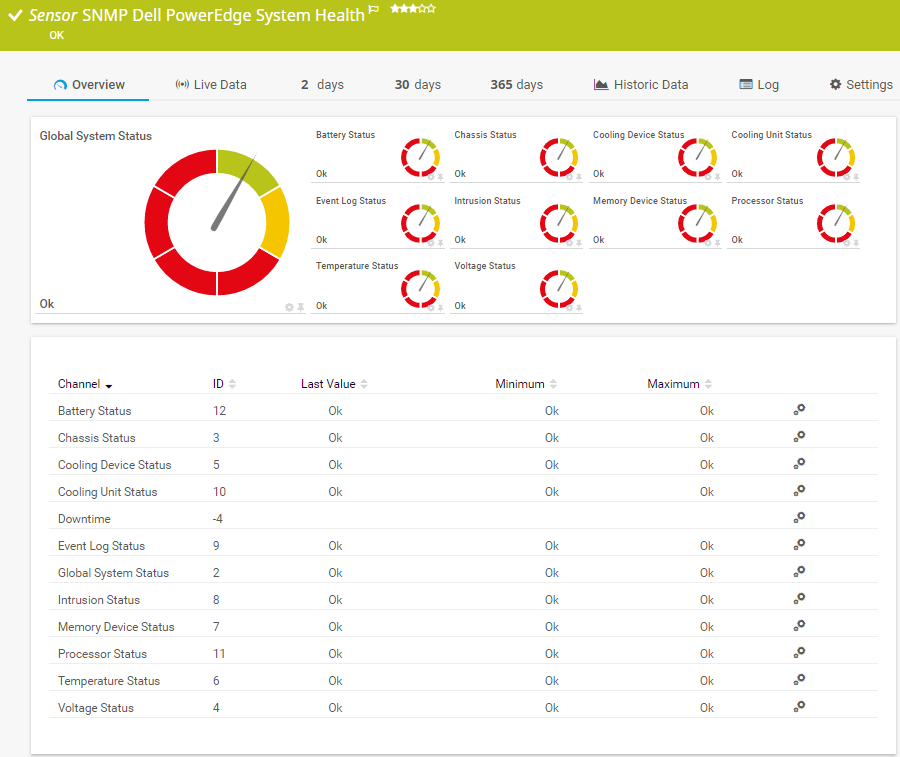
The SNMP Dell PowerEdge System Health sensor monitors the system health of a Dell PowerEdge server. It can show the following:
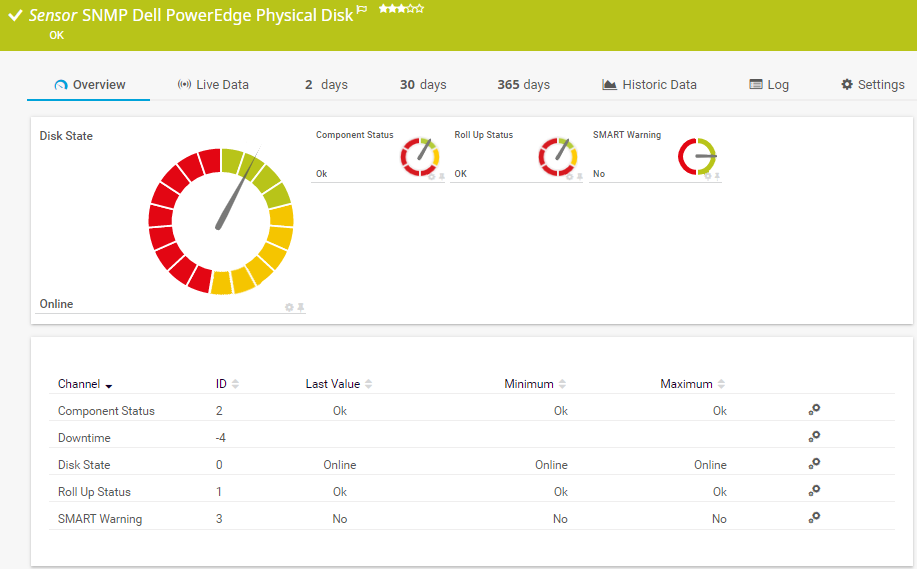
The SNMP Dell PowerEdge Physical Disk sensor monitors a physical disk in a Dell PowerEdge server. It can show the following:
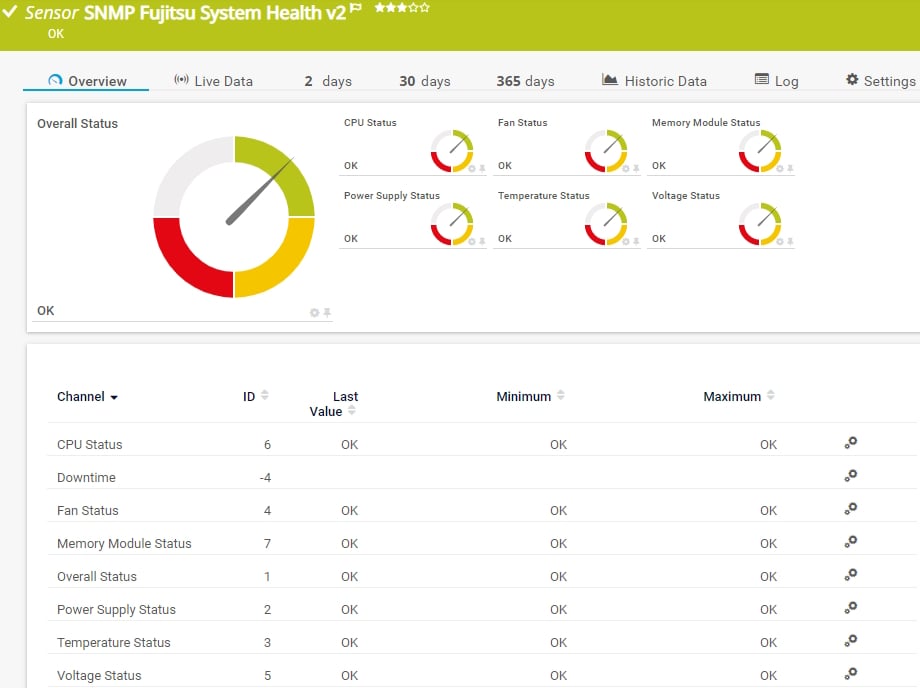
The SNMP Fujitsu System Health v2 sensor monitors the status of a Fujitsu PRIMERGY server via the integrated Remote Management Controller (iRMC) The sensor might also work on other Fujitsu devices that have an iRMC available like PRIMEQUEST servers, some storage systems of the ETERNUS product line, and CELSIUS workstations in racks. It can show the following:
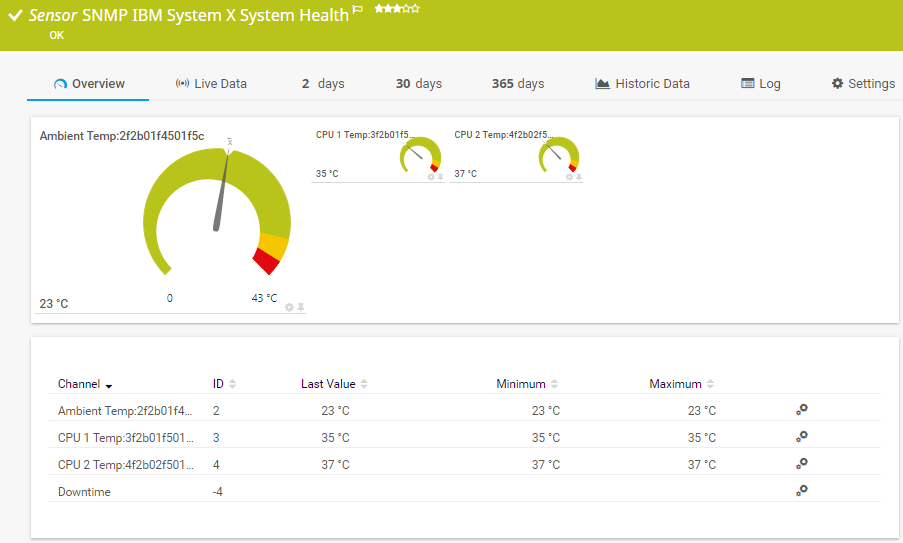
The SNMP IBM System X System Health sensor monitors the system health of an IBM device. It can show the following:
PRTG provides two different sensors using two different protocols to get hardware related information from the ESXi hosts. You can use them in addition to the above described out-of-band-management-controller sensors or as a replacement for them if you use servers without such interfaces or are not using them.
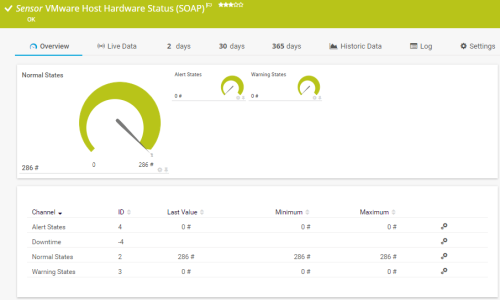
The sensor VMware Host Hardware Status (SOAP) monitors the hardware status of a VMware host server using Simple Object Access Protocol (SOAP). It shows the total number of items in normal, warning, and alert status, just as the vSphere client reports.
This sensor is intended to give you a general status overview for your host. Any states other than "normal" will be reported in the sensor message. This is a nice sensor to see the overall status, but you don’t get details on the hardware metrics.
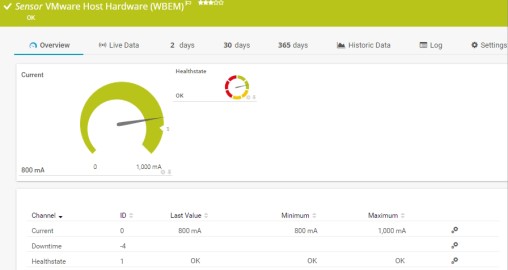
To see more details on the hardware, please use the sensor VMware Host Hardware (WBEM) using the management IP address of your ESXi server as parent device.
ESXi uses WBEM providers to query hardware related information from the devices. During the sensor creation you can select which component you would like to monitor. Each selected component will be monitored by one sensor. Examples are temperature, power and fans.
Let’s summarize: The VMware Host Hardware Status (SOAP) sensor shows the total number of items in normal, warning or alert status in one single sensor. The VMware Host Hardware (WBEM) sensor shows detailed hardware related info, each one in its own separate sensor.
Read more about VMware ESXi monitoring in this blog article.
Let’s leave the hardware and ESXi layer and head on to the next level, the virtual machines or in short VMs. VMs can be monitored from outside, so from the VMware ESXi layer, or from inside, so from within the running guest operating system. Of course, PRTG can do both.
Let’s start with monitoring the VMs from the outside, using VMware’s view on the VMs.
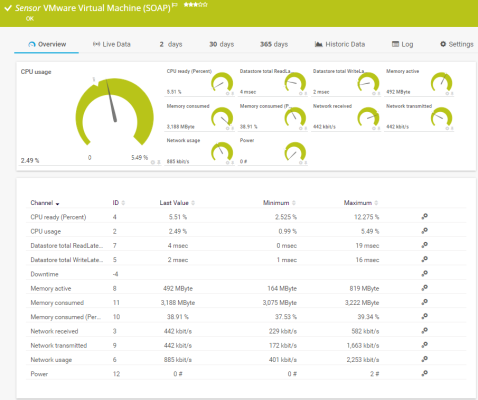
The sensor VMware Virtual Machine (SOAP) monitors the VM using VMWare SOAP protocol. It covers metrics like CPU, memory, disk and network usage within a single sensor per VM.
If your VMware environment consists of multiple servers where VMs are not bound to specific ESXi server, make sure you place this sensor on the Virtual Center, instead of the ESXi server. Otherwise a simple migration (like vMotion) of the VM between ESXi hosts would cause a false down alarm for the VM. PRTG creates one sensor per VM that you choose in the Add Sensor dialog.
To integrate a new VM, create another VMware Virtual Machine (SOAP) sensor and select your VM. When you remove a VM, make sure you remove the sensor as well to avoid false alarms and downtime notifications from PRTG.
Custom alerts and data visualization let you quickly identify and prevent all kinds of issues
You can monitor your guest operating system using the standard OS sensors available, like the sensors for Windows or Linux, to name the most common ones. These sensors get further details of the guest OS, like running processes/services or disk usage.
We’ve now covered the monitoring of the underlying server hardware, the virtualization layer itself and the virtual machines.
Let’s look at two more sensors as they provide a high added value and should be used in every virtualization environment.
VMware Datastore (SOAP) Sensor
VMware Host Performance (SOAP) Sensor
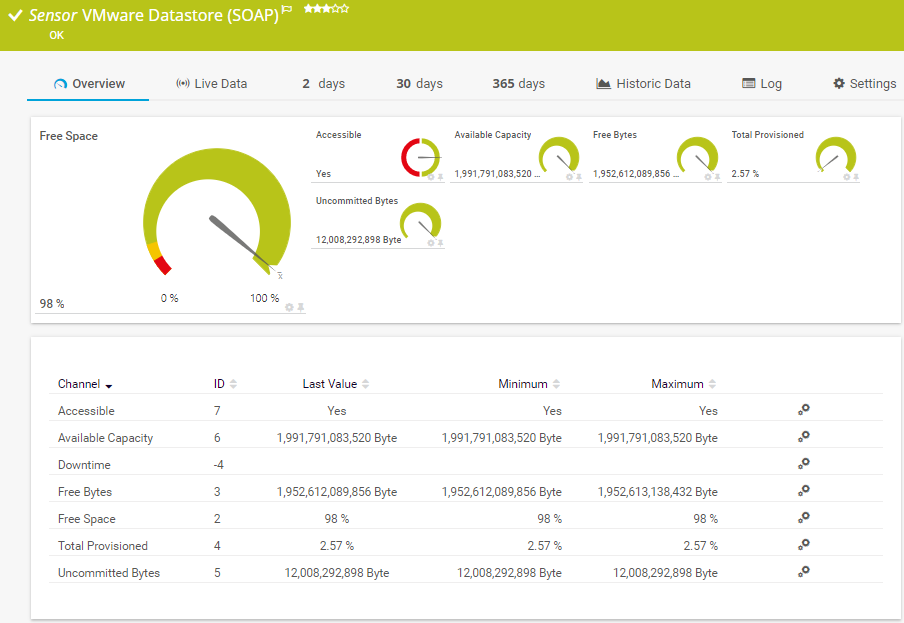
VMware Datastore (SOAP) Sensor
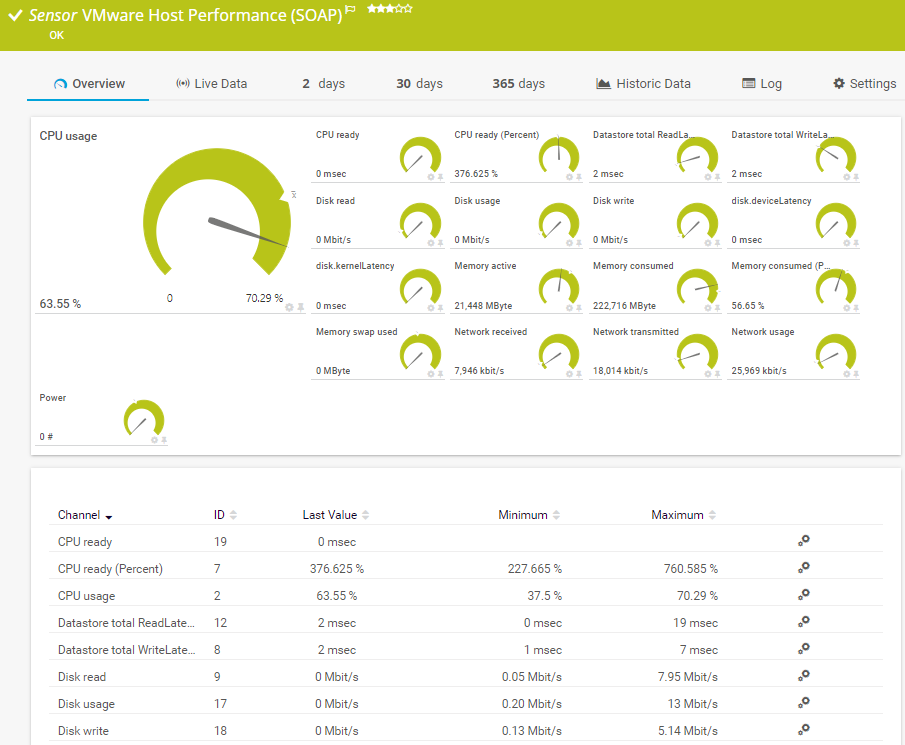
VMware Host Performance (SOAP) Sensor