• Company
    • About Us
    • Case Studies
    • Press Center
    • Careers
    • Blog
    • Contact us
  • Contact us
  • Login
 
  • English
    • Deutsch
    • Español
    • Français
    • Italiano
    • Português
Paessler
                    - The Monitoring Experts
  • Products
    • Paessler PRTG
      Paessler PRTGMonitor your whole IT infrastructure
      • PRTG Network Monitor
      • PRTG Enterprise Monitor
      • PRTG Hosted Monitor
      • PRTG UVexplorer
      • PRTG extensionsExtensions for Paessler PRTGExtend your monitoring to a new level
    • Icon Features
      FeaturesExplore all monitoring features
      • Maps & dashboards
      • Alerts & notifications
      • Multiple user interfaces
      • Distributed monitoring
      • Customizable reporting
  • Solutions
    • Industries
      IndustriesMonitor various industry sectors
      • Industrial
      • Healthcare
      • Data Center
      • Education
      • Finance
      • Government
    • IT Topics
      IT TopicsMonitor all areas of IT
      • Network Monitoring
      • Bandwidth Monitoring
      • SNMP Monitor
      • Network Mapping
      • WiFi Monitoring
      • Server Monitoring
  • Pricing
  • Resources
    • Getting Started
      Getting StartedModules for self-paced learning
    • How-to Guides
      How-to GuidesGet the most out of PRTG
    • Videos & Webinars
      Videos & WebinarsLearn from Paessler experts
    • IT  Knowledge
      IT KnowledgeExpand your IT knowledge
    • PRTG Manual
      PRTG ManualFull documentation
    • Knowledge Base
      Knowledge BaseShare community knowledge
    • PRTG Sensor Hub
      PRTG Sensor HubGet sensors, scripts & templates
    • Trainings
      PRTG TrainingLearn how to work with PRTG
  • Partners
    • Icon Handshake
      Become a PartnerFor resellers and channel partners
    • Icon MSP
      Become an MSPDeliver monitoring as a managed service
    • icon partner
      Partner PortalLog in to your partner account
    • Deal Registration
      Deal RegistrationRegister your sales opportunities
    • icon search
      Find a PartnerFind partners selling Paessler products
    • icon technology
      Technology AlliancesSee Paessler technology partnerships
    • Partner HubTools for Your Success
  • Company
    • About Us
    • Case Studies
    • Press Center
    • Careers
    • Blog
    • Contact us
  • Contact us
  • Login
  • English
    • Deutsch
    • Español
    • Français
    • Italiano
    • Português
  • Get a quote
  • Free trial

Reliable LDAP Monitoring

Keep your authentication and directory services available. Know when something's off before your users do.

Free download
PRODUCT OVERVIEW

How do you monitor LDAP and Active Directory health?  

Reliable LDAP monitoring covers four areas: server availability, bind response time, domain controller replication health, and host-level resource capacity on the machines running the directory service. If any of those go unchecked, authentication issues and replication drift tend to surface as user complaints rather than something your monitoring caught first. 

Paessler PRTG covers all four with dedicated sensors: the LDAP sensor for bind-based availability and response time, the AD Replication Errors sensor for DC sync health, and WMI-based sensors for CPU, memory, and disk on domain controllers. Everything runs agentless from the PRTG probe, no software deployed on the directory server itself. PRTG officially supports Microsoft Active Directory and Windows domain controllers, including encrypted connections via LDAPS on port 636 (SSL/TLS). All monitoring data feeds into dashboards that give you a combined view across your LDAP infrastructure. 

Supported technologies: Microsoft Active Directory, Windows domain controllers, LDAPS (SSL/TLS, port 636) 

Download PRTG Trial

What you will find on this page

  • PRTG Keeps Your LDAP Healthy
  • How PRTG Monitors LDAP
  • LDAP Monitoring With & Without PRTG
  • FAQs

PRTG is compatible with all major vendors, products, and systems

compatible with all major vendors, products, and systems

How PRTG Keeps Your LDAP Infrastructure Healthy

Stay on Top of LDAP Availability 

LDAP is a silent dependency. VPN logins, internal apps, email, file access, access control for every endpoint on the network: all of it runs through the directory service. When an LDAP server becomes unreachable or a bind fails, none of those work, and IT finds out from user reports, not from their own tooling. PRTG checks availability via a real bind operation at configurable scan intervals, detects authentication failures, and sends an alert at the next check interval. The LDAP sensor officially supports Microsoft LDAP implementations, including Active Directory, on port 389 and port 636 (LDAPS with SSL/TLS). 

  • Availability check via LDAP bind operation: tests the full authentication path, not just network reachability
  • Configurable scan intervals per server
  • Supports port 389 (standard) and port 636 (LDAPS with SSL/TLS)
  • Alert on server unreachable or authentication failure
  • Officially supports Microsoft LDAP implementations, including Active Directory

Get Ahead of Slow Authentication 

LDAP servers rarely fail all at once. Response time drifts gradually, and by the time applications start timing out, the degradation has been building for a while. PRTG tracks bind response time continuously as its primary ldap monitoring channel, with configurable warning and critical thresholds you define yourself. You get alerted at the next check interval before the issue escalates, and historical trend data makes gradual performance degradation visible before it becomes a user-facing problem. 
  • Continuous bind response time measurement
  • Configurable warning and critical thresholds per sensor
  • Historical data for spotting gradual degradation trends
  • Alert delivery via email, SMS, push, or webhook
  • Per-sensor threshold configuration, set independently per server
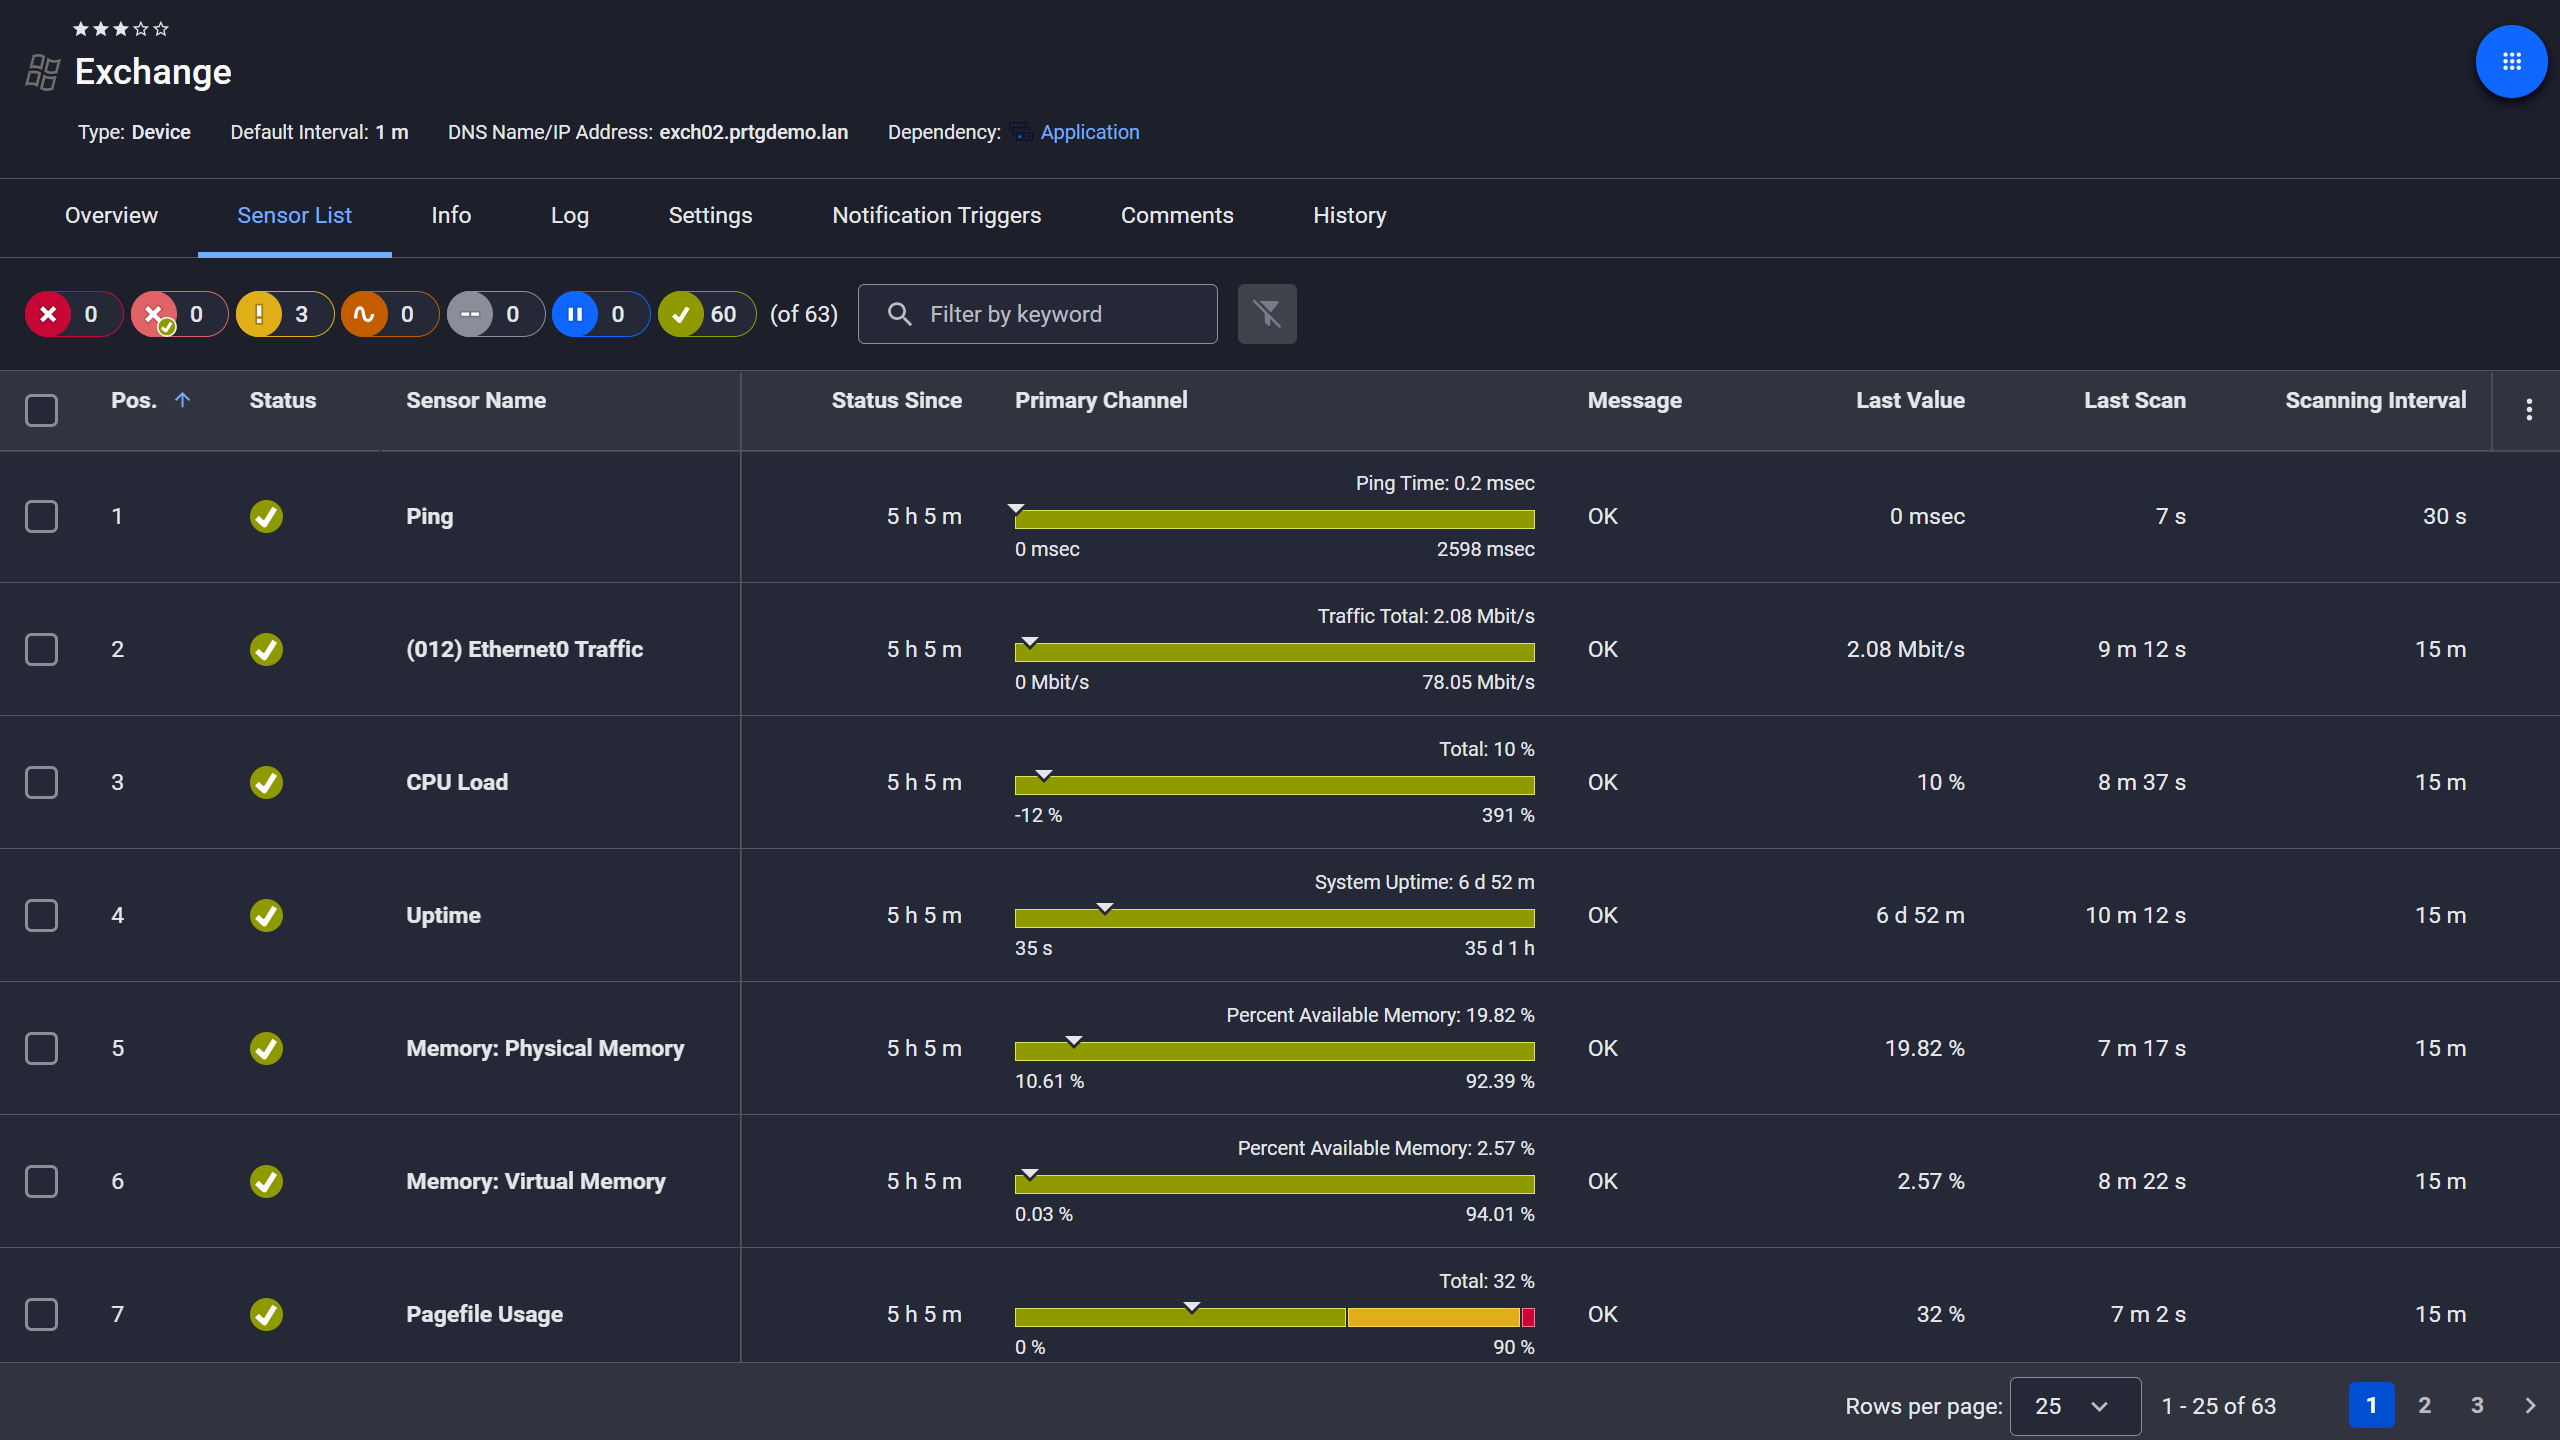
PRTG device view showing sensor list for a monitored Microsoft Exchange server

Exchange server, fully under control

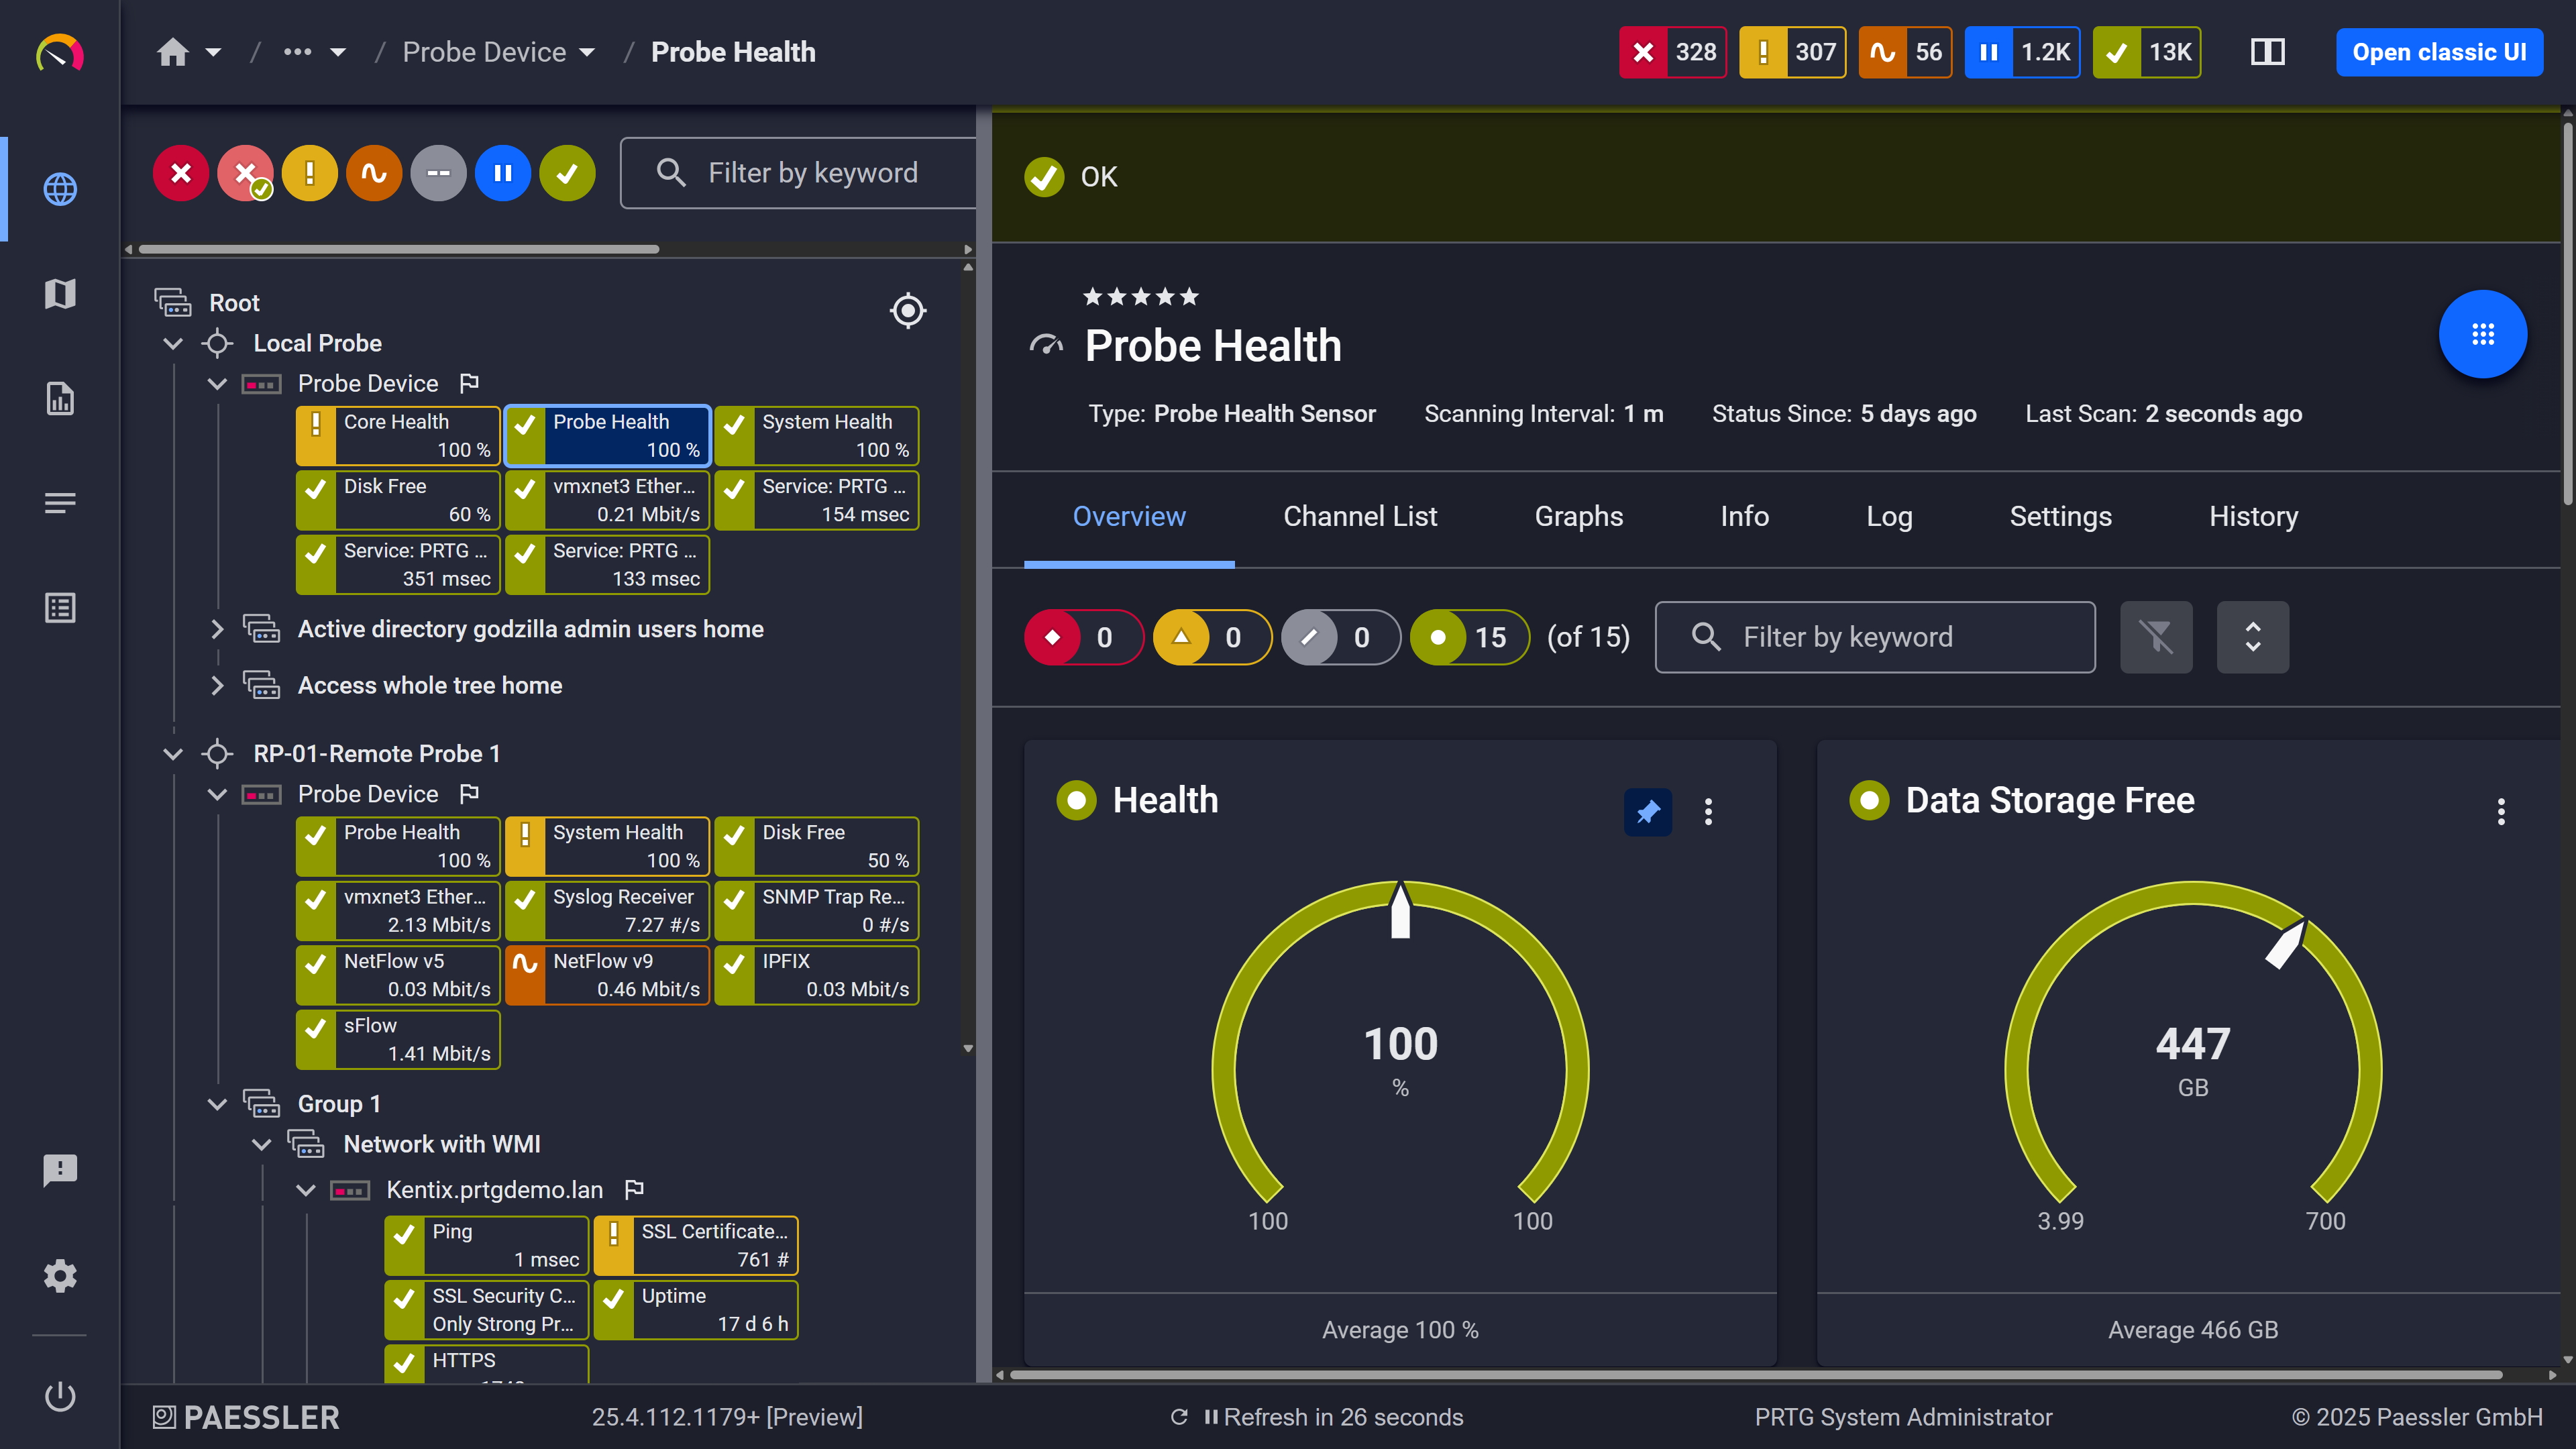
PRTG web interface showing Probe Health sensor with health and storage gauge widgets

Probe health at a glance

PRTG web interface showing live performance graphs for a Probe Health sensor

Live graphs, real-time performance data

Keep All Your Domain Controllers in Sync 

AD replication failures don't cause clean outages. A password change that doesn't apply everywhere, group policies that behave differently across sites, a user who can authenticate in one location but not another: troubleshooting these without replication health data means running manual repadmin checks that only show the current state. PRTG's AD Replication Errors sensor monitors each domain controller automatically at every check interval, tracking consecutive failures, pending replication operations, last sync attempt and result, and source DC information, so you catch drift early instead of after something breaks. 

  • Per-DC replication error tracking
  • Consecutive synchronization failure counter
  • Pending replication operation count
  • Timestamp of last sync attempt and last successful sync
  • Indication of stalled or missing replication partners

See Why IT Professionals Trust PRTG

Start monitoring your infrastructure in minutes. No professional services, no complex configuration, no risk.

Free download
PRODUCT OVERVIEW

See the Full Picture 

Response time problems don't always start at the protocol level. A domain controller running low on disk space or under sustained CPU load degrades authentication performance just as effectively, but you'd never see that by watching LDAP alone. In environments with multiple domain controllers handling load distribution, that blind spot compounds. PRTG monitors CPU load, memory, disk space, and I/O on domain controllers via WMI and Windows Performance Monitor counters, with SNMP available for bandwidth and network-level metrics. All sensors sit in the same device view as the LDAP sensor, giving you full observability across both layers of the stack. 
  • CPU load, memory usage, and disk space monitoring via WMI
  • Pagefile and disk I/O tracking on Windows domain controllers
  • No agent required on the monitored server
  • LDAP sensor and WMI sensors co-located in the same device view
  • Historical data available for both layers for comparison
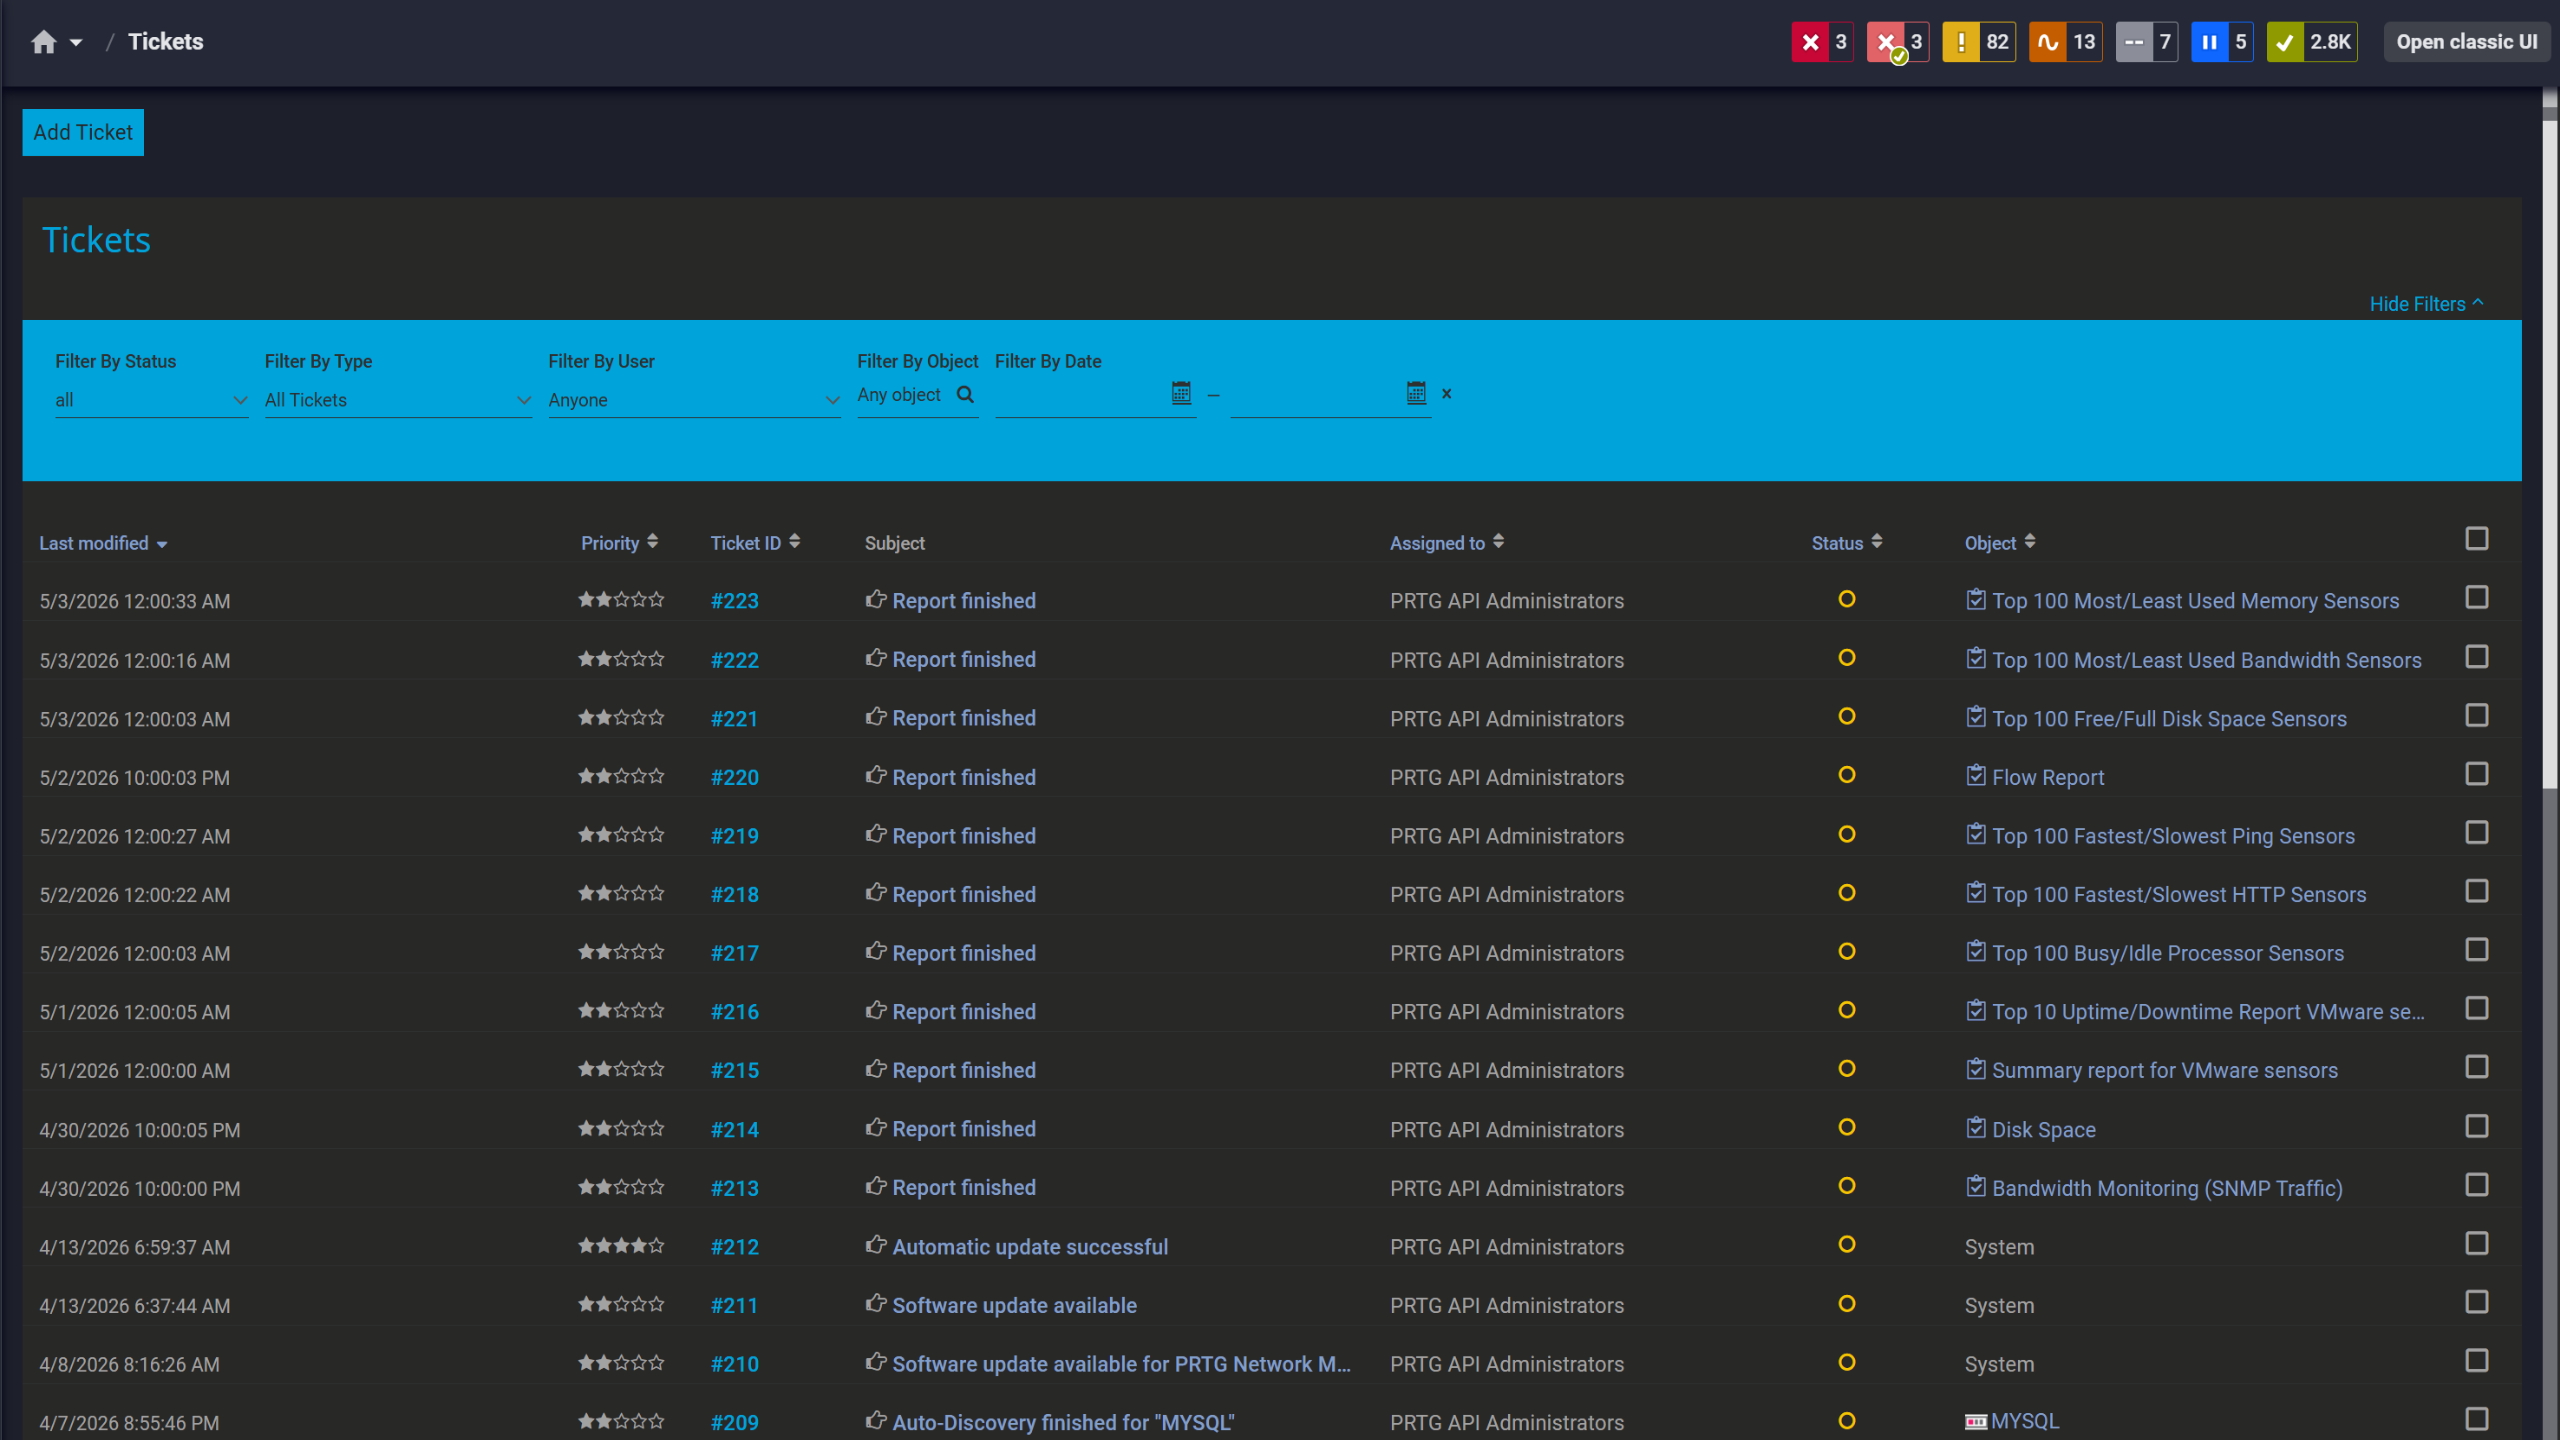
PRTG tickets list showing system notifications, report completions, and update alerts

Tickets keep your team aligned

PRTG reports list showing scheduled monitoring reports with run times and sensor counts

Scheduled reports, always on time

PRTG web interface showing device tree and full device list with sensor status badges

Full device list, instant overview

How PRTG Monitors LDAP and Directory Services 

PRTG uses protocol-level checks and native Windows instrumentation to monitor LDAP and directory services. No agents are deployed on the directory server itself; monitoring runs from the PRTG probe. 

LDAP Bind Authentication  

An LDAP bind is a login command issued to the LDAP server. The PRTG LDAP sensor authenticates the way a real client would, sending credentials and waiting for a response. This means it tests the full authentication path, not just whether the server is reachable over the network. A ping can tell you the host is up; a bind tells you whether authentication is actually working. 

The sensor requires a distinguished name (DN) and credentials, which are configurable per sensor instance. This lets you scope access precisely and monitor multiple servers with separate credentials independently. Note: the LDAP sensor supports IPv4 only. This applies to all connection types, including LDAPS. IPv6 is not supported.

Encrypted LDAP (LDAPS) 

For encrypted connections, PRTG supports LDAPS on port 636 using SSL/TLS. Port 389 is available for standard unencrypted connections; the choice is configurable per sensor. Encrypting LDAP traffic is the standard approach for production environments, particularly where credential exposure is a vulnerability concern. 

One important requirement when using SSL/TLS: the parent device in PRTG must be configured with a DNS name, not just an IP address. This is needed for certificate validation during the TLS handshake. Configuring LDAP monitoring with an IP address on the parent device will cause SSL/TLS connections to fail.

Host-Level Metrics 

For host-level visibility on domain controllers, PRTG uses WMI and Windows Performance Monitor counters. Built-in sensor types (Windows CPU Load, WMI Memory, Windows Physical Disk I/O, Windows Pagefile) cover the metrics that matter for DC health. All of these are agentless; PRTG accesses the data remotely via WMI. For network-level data such as bandwidth utilization on the DC's network interface, PRTG supports SNMP as an additional protocol alongside WMI. 

Where WMI overhead is a concern, PRTG also supports Windows performance counter-based access as an alternative. For custom monitoring needs beyond the built-in sensor types, PRTG’s PowerShell sensor lets you run scripts on the probe to collect custom data from monitored systems. The API-based access model is consistent across all Windows sensor types.

Alerts & Thresholds 

PRTG sensors operate in defined states: Up, Warning, Down, Paused, Unknown, and Error. For threshold-based alerting, the relevant states are Up, Warning, and Down, where each one is tied to the ranges you configure per sensor. When a sensor crosses a threshold at the next scheduled check, it changes state and sends a notification through whichever channels you've set up: email, push notifications, SMS, or webhooks via API integrations. 

Dashboards give you a visual overview of LDAP and DC sensor data across multiple servers in one place. You can review notification history and use notification triggers to route alerts to the right person or system. Notifications, thresholds, and delivery channels are all configurable per sensor.

free downLoad

LDAP Monitoring With and Without PRTG 

Capability

Without PRTG

Without PRTG

With PRTG

With PRTG

LDAP server availability check

Without PRTG
not included

Teams often rely on generic ping monitoring, which doesn’t verify whether LDAP authentication itself is functioning.

With PRTG
included

Automated bind-based check detects authentication failures and unreachable servers at every configured scan interval.

Bind response time tracking

Without PRTG
not included

Response time degradation typically goes unnoticed until applications time out or users report slowness.

With PRTG
included

Continuous bind response time measurement with configurable warning and critical thresholds. You’re alerted at the next check interval, before the issue escalates.

AD replication health

Without PRTG
not included

Manual repadmin checks per DC only show the state at the moment you run them.

With PRTG
included

The AD Replication Errors sensor tracks failures, pending operations, and sync timestamps for every configured domain controller, at every check interval.

DC resource monitoring

Without PRTG
not included

Host-level metrics often require a separate tool and aren't visible alongside LDAP data.

With PRTG
included

WMI-based sensors for CPU, memory, disk, and I/O sit in the same device view as the LDAP sensor.

Alert on failure

Without PRTG
not included

IT often learns about LDAP issues from help desk tickets, after users are already affected.

With PRTG
included

Threshold-based alerts trigger at the next check interval and reach the right person via email, SMS, push, or webhook.

free downLoad

“We strive to equip our systems with state-of-the-art technology to safeguard our educational practices for the future. Part of this includes ensuring that all our systems run smoothly at all times. On any given day, we rarely have time to keep an eye on all our systems. We therefore decided to monitor our school’s IT environment with a centralized network monitoring tool.”

Stefan Roschewitz, IT administrator
BBS Holzminden

“We want to include the tool in our set of solutions in order to solve problems more proactively in our technology infrastructure. PRTG has exceeded all our expectations because it is a reliable, extremely easy-to-use solution. There is no doubt that it lives up to the renowned quality of German technology.”

Esbin Saúl Lázaro García, IT Infrastructure and Security Engineer
Hospital El Pilar

“The reactivity, know-how, and technical solutions of Paessler are outstanding in every situation. For me, no monitoring tool compares to PRTG.”

Andreas Reimann, Senior Networking Communication Architect
Zurich Airport

Paessler PRTG Network Monitor licenses & pricing

Choose the PRTG Network Monitor subscription that's best for you.

License NameLicense descriptionPriceLicense DetailsGet startedPricing Details
PRTG 500$200per month paid annuallyBuy nowBuy now

Enough to monitor multiple aspects of 50 devices

PRTG 1000$358per month paid annuallyBuy nowBuy now

Enough to monitor multiple aspects of 100 devices

PRTG 2500$742per month paid annuallyBuy nowBuy now

Enough to monitor multiple aspects of 250 devices

PRTG 5000$1,300per month paid annuallyBuy nowBuy now

Enough to monitor multiple aspects of 500 devices

PRTG 10000$1,642per month paid annuallyBuy nowBuy now

Enough to monitor multiple aspects of 1000 devices

Over 100,000 Customers Worldwide Love Paessler  

customer success stories

 LDAP Monitoring: Frequently Asked Questions


What exactly does an LDAP sensor measure?

The PRTG LDAP sensor measures two things: bind response time and server availability (Up/Down status). It does not measure ldap query volume, per-query search latency, or connection pool utilization. If you need those metrics, you'd need additional tooling beyond what the LDAP sensor provides.

Which LDAP implementations does PRTG support?

Microsoft Active Directory is officially supported and tested. OpenLDAP and other third-party LDAP providers may work in practice, but they're not officially supported. If you're running a non-Microsoft directory service on Linux or another operating system, verify compatibility in a test environment before deploying to production.

Does LDAP monitoring work with encrypted connections (LDAPS)?

Yes. PRTG supports LDAPS on port 636 using SSL/TLS. When using encrypted connections, the parent device in PRTG must be configured with a DNS name, not an IP address, for certificate validation to work. The entire LDAP sensor is IPv4-only; this applies to both standard and encrypted connections. Plain LDAP on port 389 is also available and configurable per sensor.

Can I monitor multiple domain controllers independently?

 Yes. You deploy one LDAP sensor and one AD Replication Errors sensor per domain controller, each configured and tracked independently. This gives you per-DC visibility for both authentication availability and replication health across all your monitored servers.

What's the difference between the LDAP sensor and the AD Replication Errors sensor?

Different layers, different use cases. The LDAP sensor checks protocol-level availability and bind response time: it tells you whether the ldap service is responding and how fast. The AD Replication Errors sensor tracks DC-to-DC sync health, covering replication failures, pending operations, and sync timestamps. You typically need both to get a complete picture of Microsoft Active Directory health.

How does PRTG notify me when something goes wrong with LDAP?

When a sensor crosses a threshold at the next check interval, it changes state and sends a notification. Delivery options include email, push notifications, SMS, and API-based integrations (e.g., webhooks). Notifications are configurable per sensor, and dashboards give you an at-a-glance view across all monitored LDAP and DC devices. You can also set up notification triggers to route alerts based on sensor state. 

Paessler PRTG

Paessler PRTG

Network Monitoring Software – Version 26.1.116.1532 (February 9th, 2026)

Hosting icon

Hosting

Download for Windows and cloud-based version PRTG Hosted Monitor available

Languages icon

Languages

English, German, Spanish, French, Portuguese, Dutch, Russian, Japanese, and Simplified Chinese

test

Monitor everything

Network devices, bandwidth, servers, applications, virtual environments, remote systems, IoT, and more

test

Pricing

Choose the PRTG Network Monitor subscription that's best for you

Discover more monitoring insights and stories

Content illustration

Powerful stories from the monitoring world

  • LDAP vs AD: Key Differences and Monitoring Best Practices
  • PRTG & The Exchange Admin (Part 5/6): Metrics That Matter
  • All about IT, Monitoring, and PRTG
Support illustration

Resources to master your monitoring challenges

  • Secure LDAP monitoring with PRTG - Paessler Helpdesk
  • PRTG Manual: LDAP Sensor - Paessler
  • Monitor SSL LDAP Certificate
Solution illustration

Solutions for all your monitoring needs

  • LDAP Monitoring
  • Monitoring Technologies
  • DNS Monitoring
PRTG Logo

Start Monitoring with PRTG and see how it can make your network more reliable and your job easier.

Free download
PRODUCT OVERVIEW

Products

  • Paessler PRTG
    Paessler PRTGMonitor your whole IT infrastructure
    • PRTG Network Monitor
    • PRTG Enterprise Monitor
    • PRTG Hosted Monitor
    • PRTG UVexplorer
    • PRTG extensions
      Extensions for Paessler PRTGExtend your monitoring to a new level
  • Icon Features
    FeaturesExplore all monitoring features

Monitoring with PRTG

  • Network monitoring
  • Bandwidth monitoring
  • SNMP monitoring
  • Network mapping
  • Wi-Fi monitoring
  • Server monitoring
  • Network traffic analyzer
  • NetFlow monitoring
  • Syslog server

Useful Links

  • PRTG Manual
  • Knowledge Base
  • Customer Success Stories
  • About Paessler
  • Subscribe to newsletter
  • PRTG Support
  • PRTG Consulting
  • PRTG Feedback & Roadmap

Contact

Paessler GmbH
Thurn-und-Taxis-Str. 14, 
90411 Nuremberg 
Germany

[email protected]

+49 911 93775-0

  • Contact us
©2026 Paessler GmbHTerms & ConditionsPrivacy PolicyImprintReport VulnerabilityDownload & InstallSitemap
SNMP, MIBs and OIDs SNMP, MIBs and OIDs SNMP, MIBs and OIDs