
Last reviewed: 10/2026


PRTG runs continuous checks against your network, servers, and applications using protocols like SNMP and WMI, and its auto-discovery finds new devices and adds the right sensors without you writing a rule for each one. That means a failing switch, a maxed-out disk, or a service that just stopped responding gets flagged the moment it happens, whether or not anything was ever logged about it. According to our 2026 survey of 1,088 IT teams, covering everything with one tool was the top reason midmarket respondents chose PRTG, at 60.2%. Searching, parsing, and investigating the messages your systems generate is still a job for a dedicated log platform, and that's exactly what it's built for. The two answer different questions: PRTG tells you something is wrong right now, while a log platform helps you understand what happened once you go looking.
PRTG licenses by sensor, a fixed number tied to what you choose to monitor, so the plan you buy is the plan you see on the invoice every time. Add a device, and you know exactly how many sensors it needs before you add it. There's no separate meter tracking how much data moved through your network last month. That predictability matters most exactly when things go wrong: a rough week for your infrastructure doesn't turn into a rough week for your budget. If your team also needs to search and retain log data at real volume, that's a different job with its own pricing model, and it should be judged on its own terms.
Install PRTG and its auto-discovery scans your network, identifies what it finds using SNMP, WMI, and other protocols, then applies preconfigured sensors automatically: no rules to write before you see your first result. Most teams have real visibility into their core devices within the same session, not after a platform is stood up and tuned. There's no separate database to provision and no cluster to keep healthy, since PRTG runs as a single installation from the start. Building out advanced dashboards or fine-tuning alerts for a large, complex environment still takes real time, and that part doesn't happen automatically either.
FEATURE | PRTG PRTG | Graylog Graylog |
|---|---|---|
Cover network, server, and application monitoring with one license | PRTG Every sensor type included in one license; flow, SNMP, WMI, and application sensors draw from the same pool | Graylog Limited: Correlation alerting, SSO, and audit logs require Graylog Enterprise ($15,000/yr+) or Security ($18,000/yr+) |
Get alerting across multiple sources without paying for a higher tier | PRTG Threshold and multi-sensor alerting included at every license size, from the free tier up | Graylog Limited: Open tier supports single-condition alerting only; correlation alerting across multiple sources requires Enterprise or Security |
Give every team the same monitoring access, without a paid tier | PRTG Role-based user accounts and access rights are a standard feature in every license | Graylog Limited: Open tier is single-owner access only; shared access across teams requires Enterprise or Security |
Alert on legacy network hardware faults via SNMP traps | PRTG Native SNMP Trap Receiver sensor, included in every license | Graylog Limited: SNMP traps aren't listed among Graylog's documented input types |
Visualize bandwidth and traffic patterns per site | PRTG Native flow sensors generate Top Talkers, Top Connections, and Top Protocols automatically, no configuration needed | Graylog Limited: NetFlow and IPFIX arrive as log data; dashboards on that data are built using Graylog's own pipeline and search tools |
Get paged before the helpdesk hears about it from users | PRTG Multi-channel alerts (email, SMS, push, Teams, Slack) fire the moment a threshold trips, right after auto-discovery finds the device | Graylog Alerts fire once a detection rule or threshold is configured on the incoming log or event data |
Search and investigate raw log data across your environment | PRTG Limited: Syslog and SNMP Trap Receiver sensors count, filter, and store messages for basic review; not built for full-text search at volume | Graylog Purpose-built log search returns results in seconds, even across large volumes |
Retain and search months of log data for a compliance audit | PRTG Limited: Not designed for long-term structured log retention or audit-ready log reporting at that depth | Graylog Integrated data lake with tiered hot, warm, and archive retention, plus audit-ready reporting on Enterprise and Security |
PRTG licenses by sensor: a number tied to what you choose to monitor, visible before you buy and stable once you do. Every feature ships in every license tier, so there's no separate module to add for network, server, or application monitoring. That's a different model from log-ingestion-based pricing, where the bill can move with how much data flows through in a given month.
| License Name | License description | Price | License Details | Get started | Pricing Details | |
|---|---|---|---|---|---|---|
| PRTG 500 | $200 | per month paid annually | Buy nowBuy now | Enough to monitor multiple aspects of 50 devices | ||
| PRTG 1000 | $358 | per month paid annually | Buy nowBuy now | Enough to monitor multiple aspects of 100 devices | ||
| PRTG 2500 | $742 | per month paid annually | Buy nowBuy now | Enough to monitor multiple aspects of 250 devices | ||
| PRTG 5000 | $1,300 | per month paid annually | Buy nowBuy now | Enough to monitor multiple aspects of 500 devices | ||
| PRTG 10000 | $1,642 | per month paid annually | Buy nowBuy now | Enough to monitor multiple aspects of 1000 devices |
”As an international company, PRTG is ideal for us. If something went down half way across the world, we wouldn’t be woken up – we can rely on PRTG to identify the problem and alert us before it occurs – enabling the right person, in the right time zone to resolve the problem. At the end of the day, if we’re to provide an internal network experience for our employees that meets expectations, we need a tool like PRTG to be successful.”
PRTG's device tree gives you one place to see everything you're watching, organized the way your network actually looks. Auto-discovery populates it automatically, and every sensor reports status, history, and alerts in the same interface. From here, a threshold alert, a bandwidth graph, and a manually built site map are all a click away.
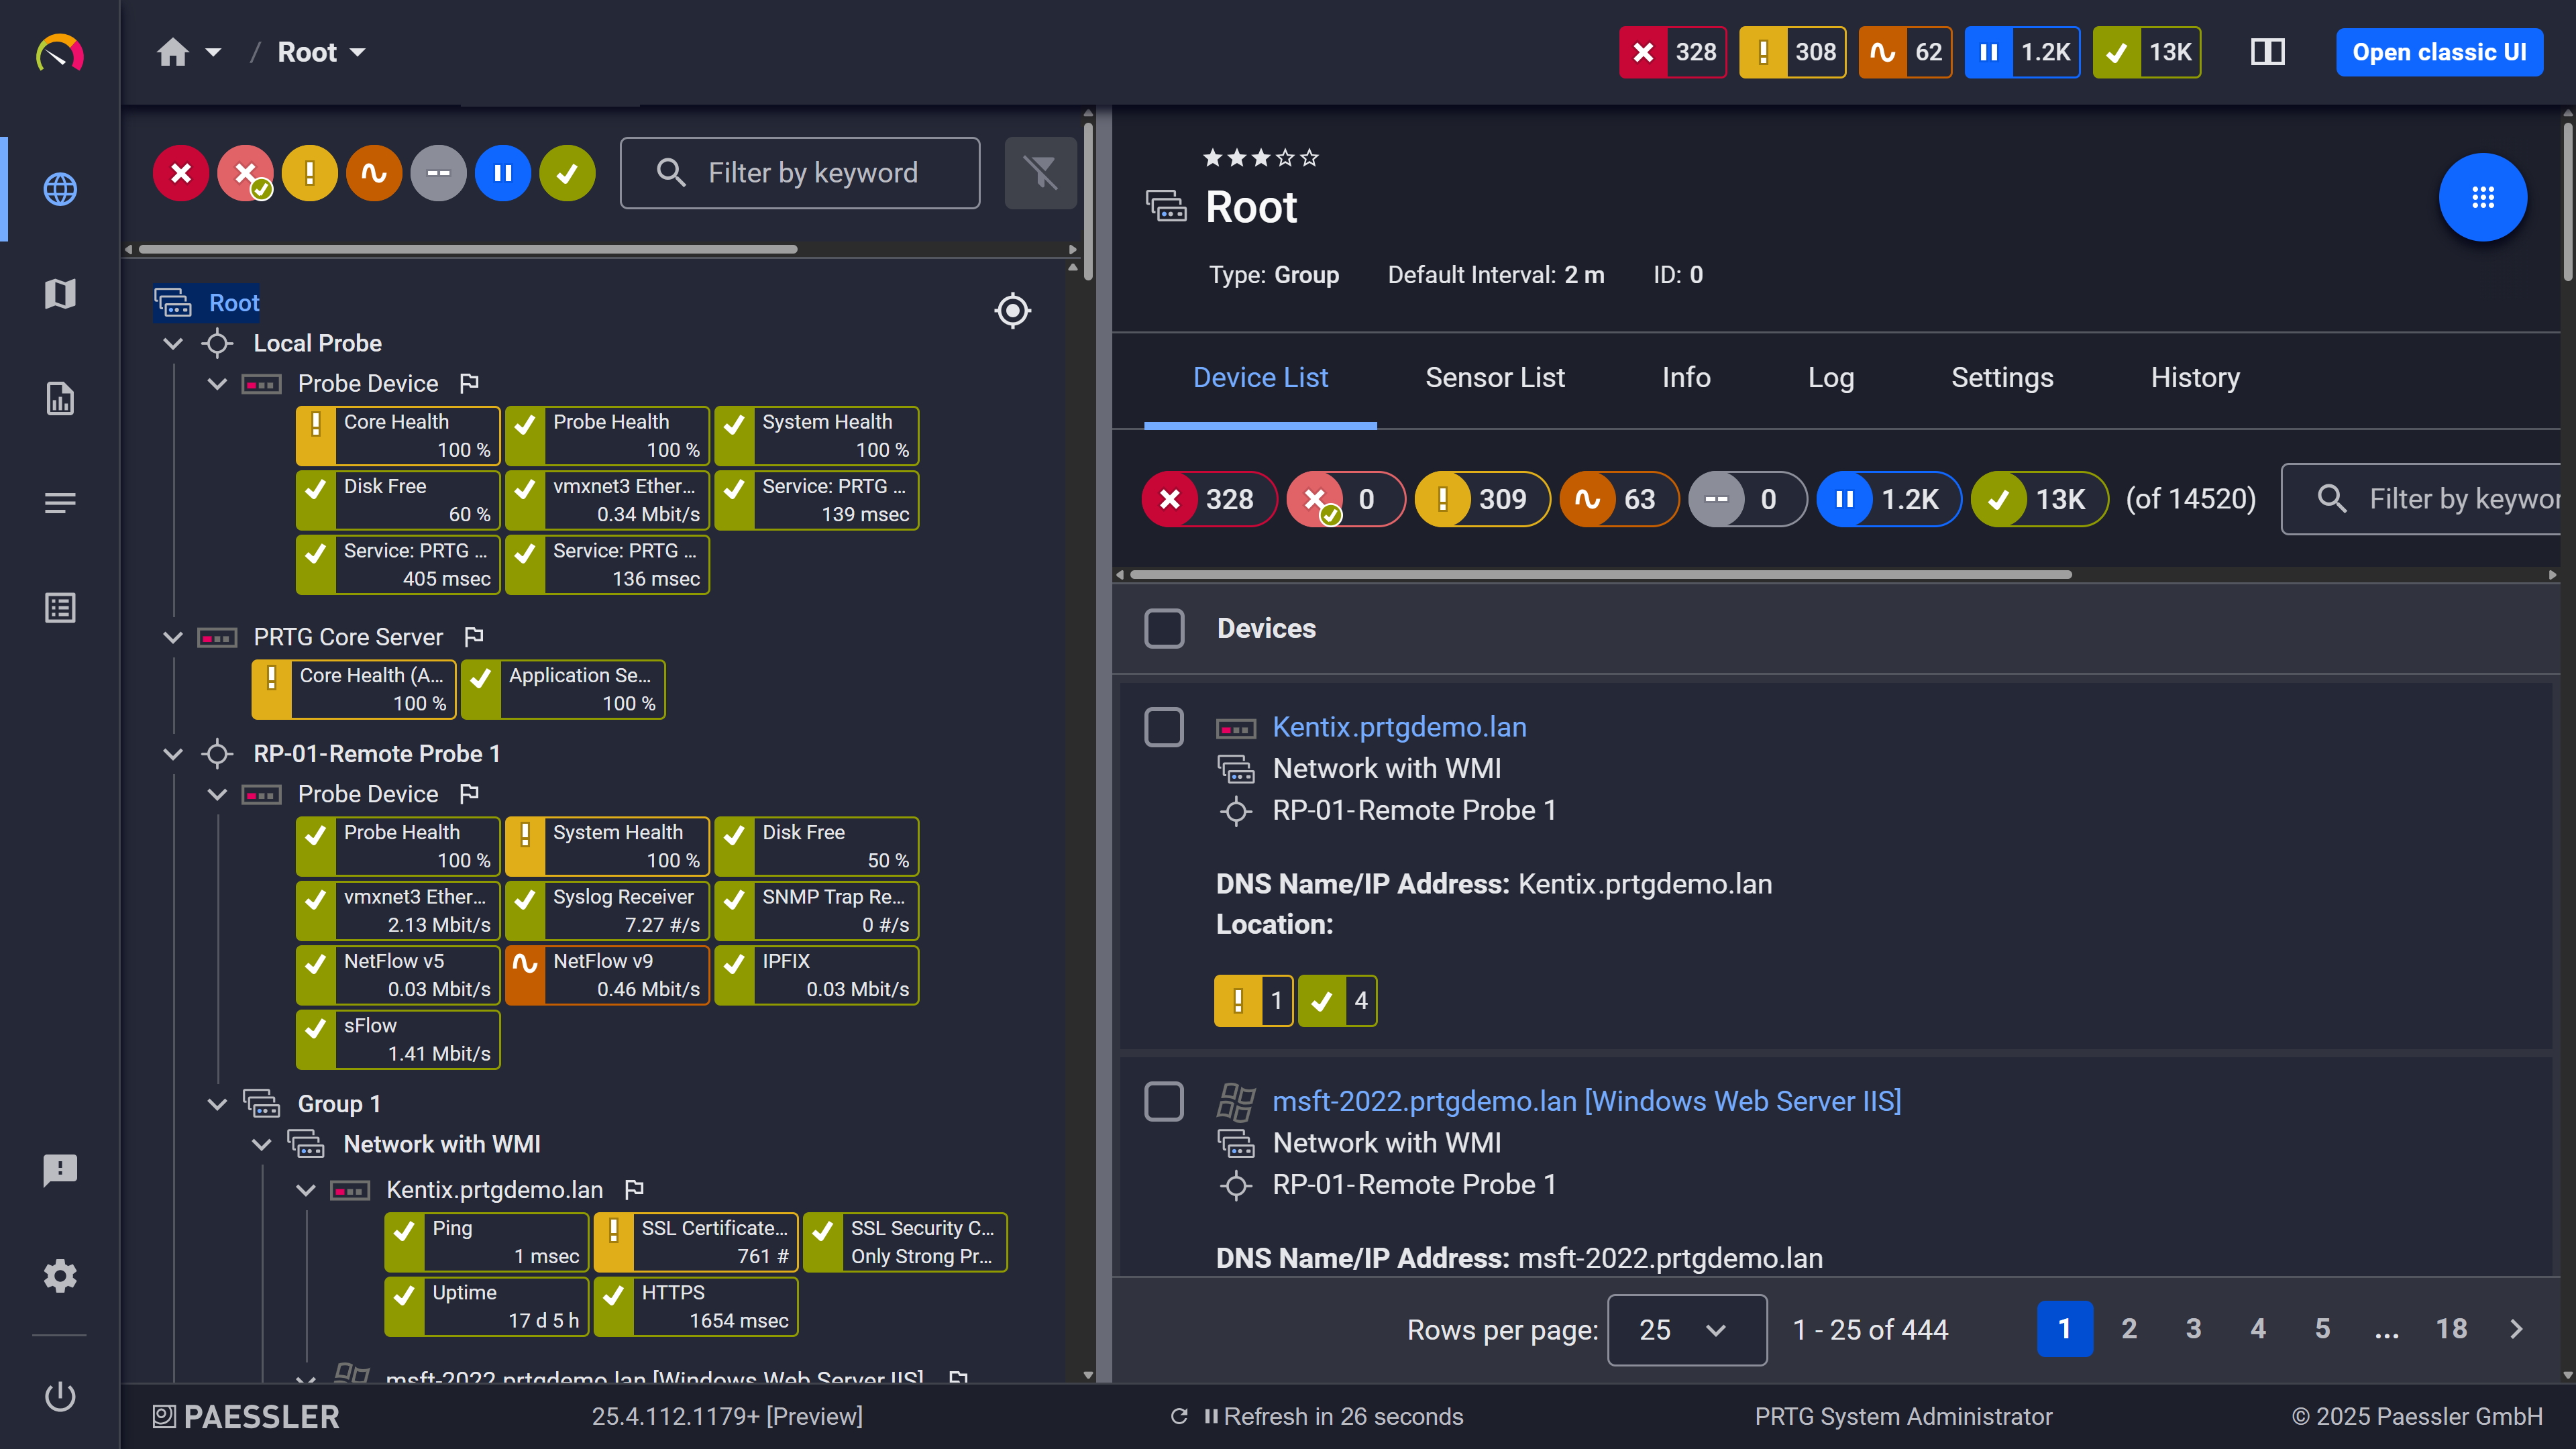
Device tree view: your full infrastructure, organized automatically after auto-discovery
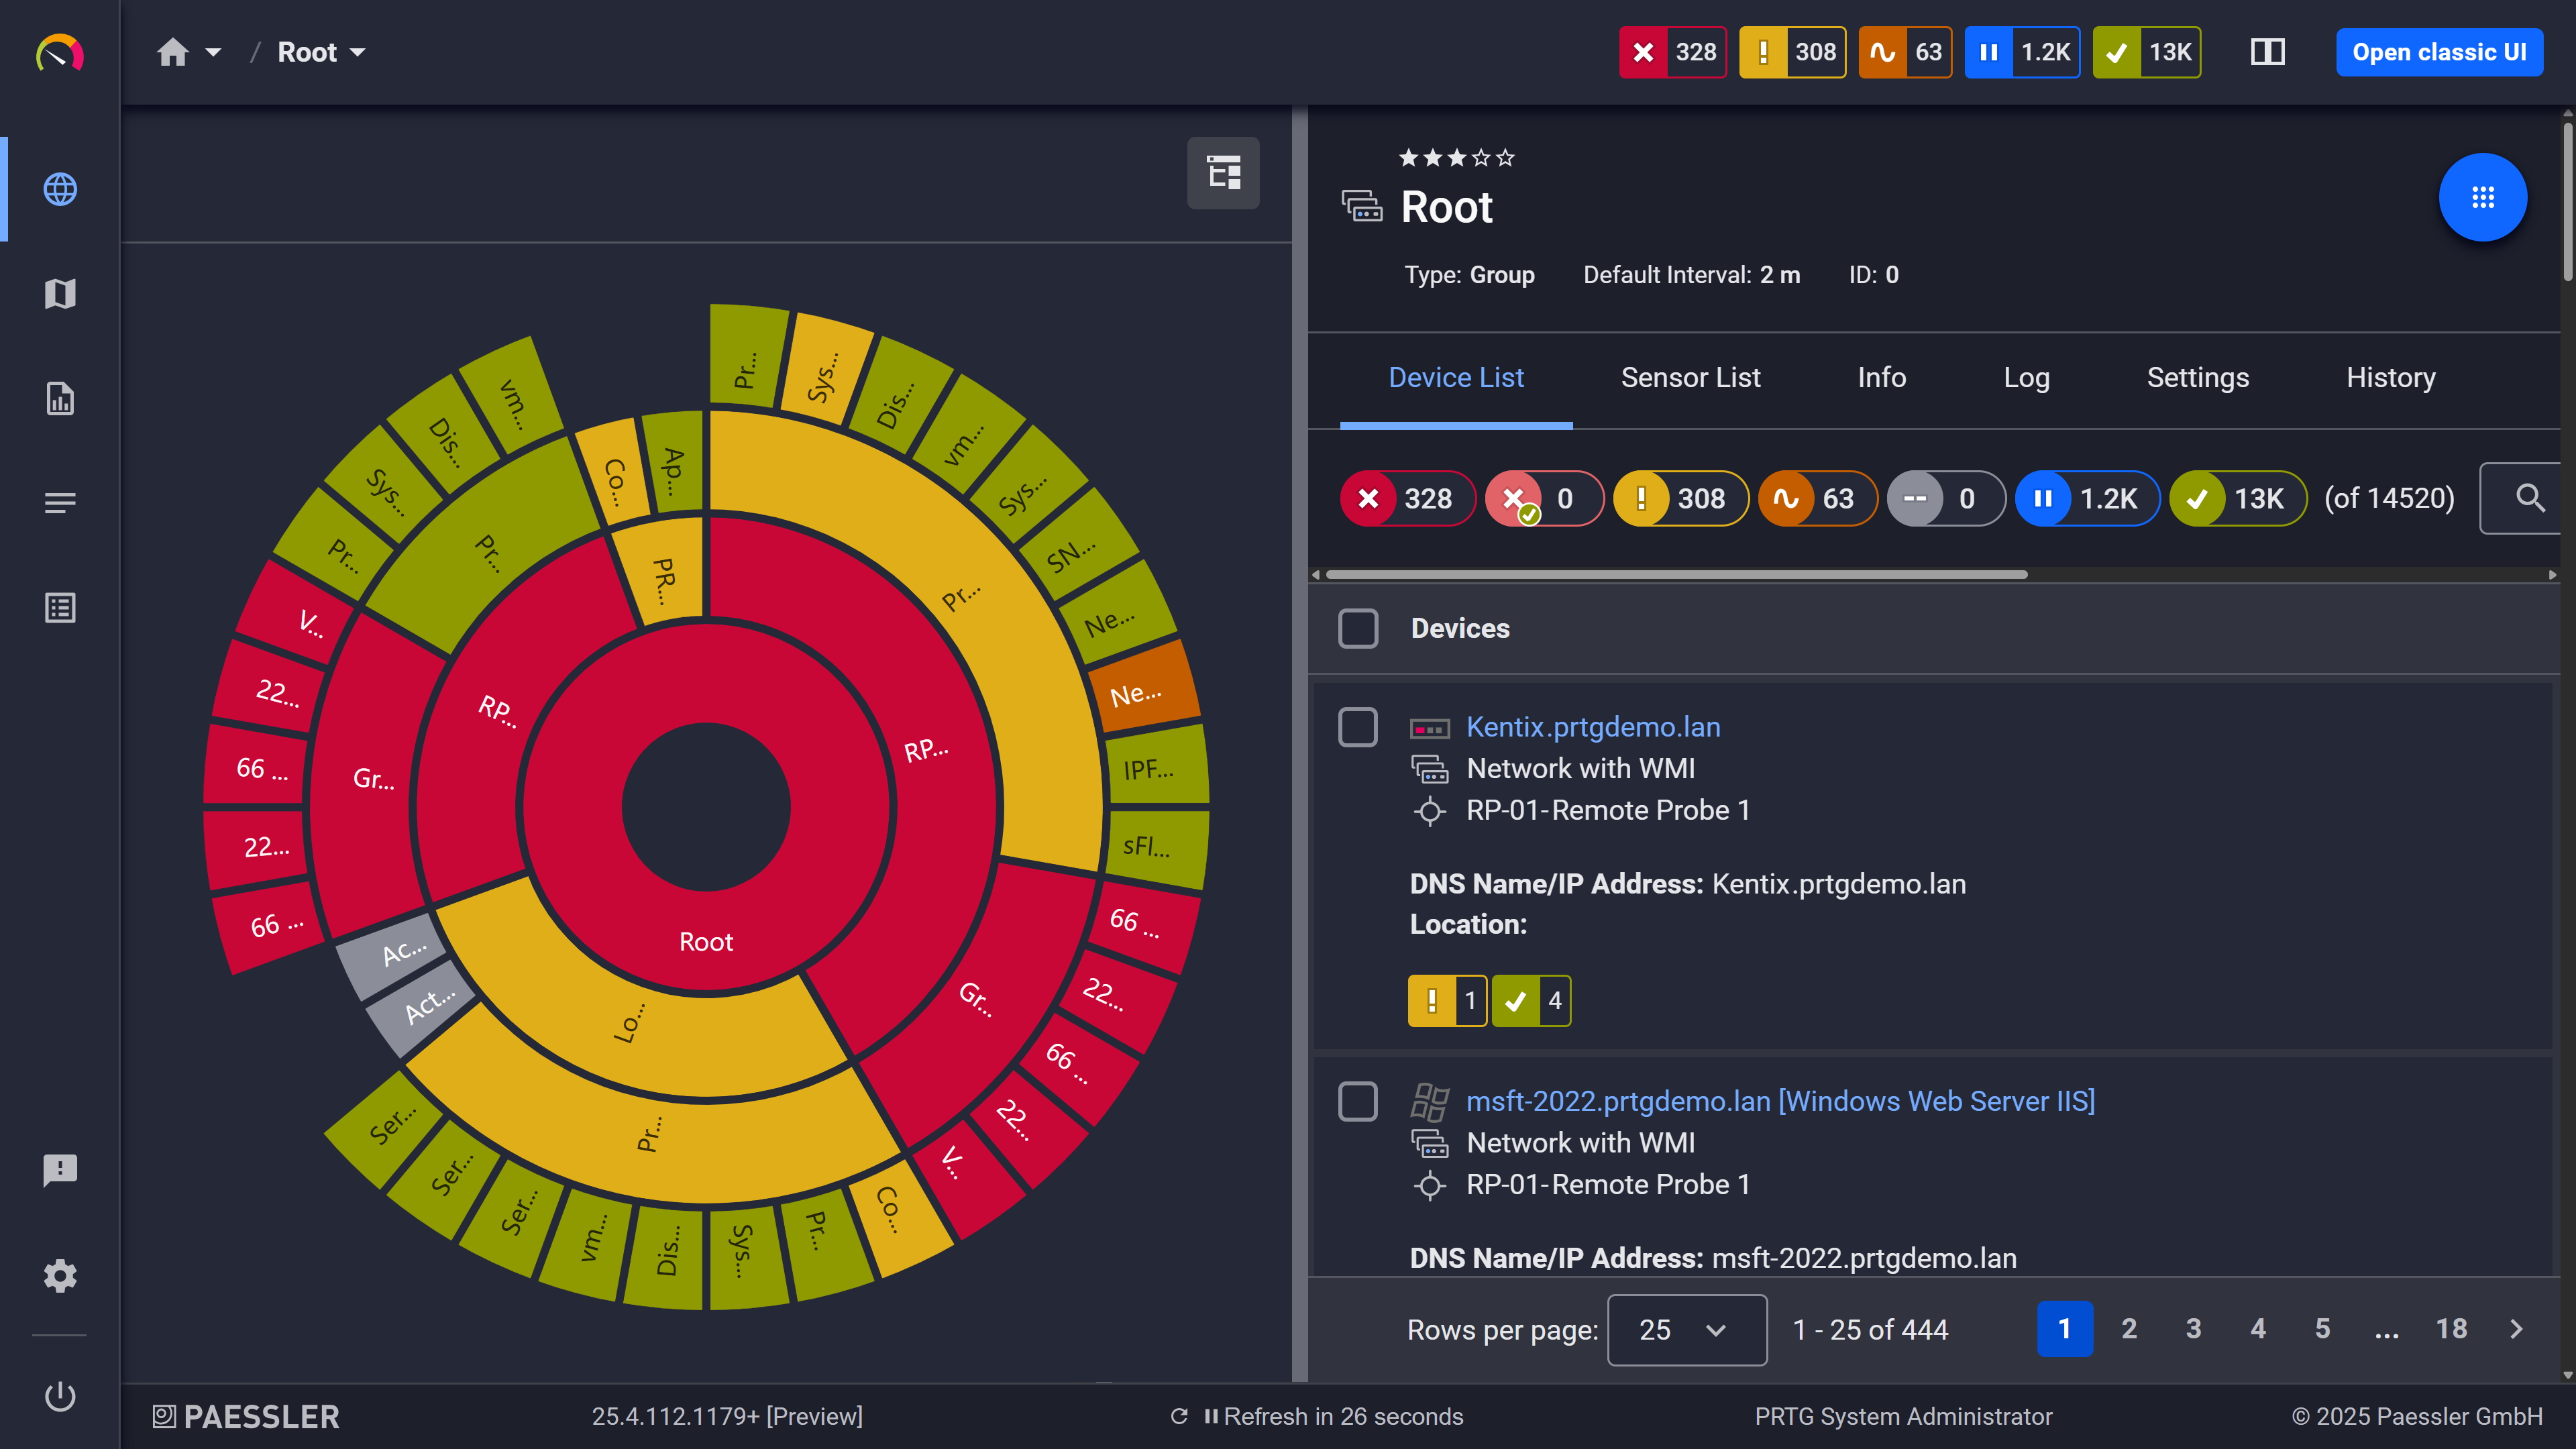
Custom dashboard: your easy-to-grasp overview built from your own sensors
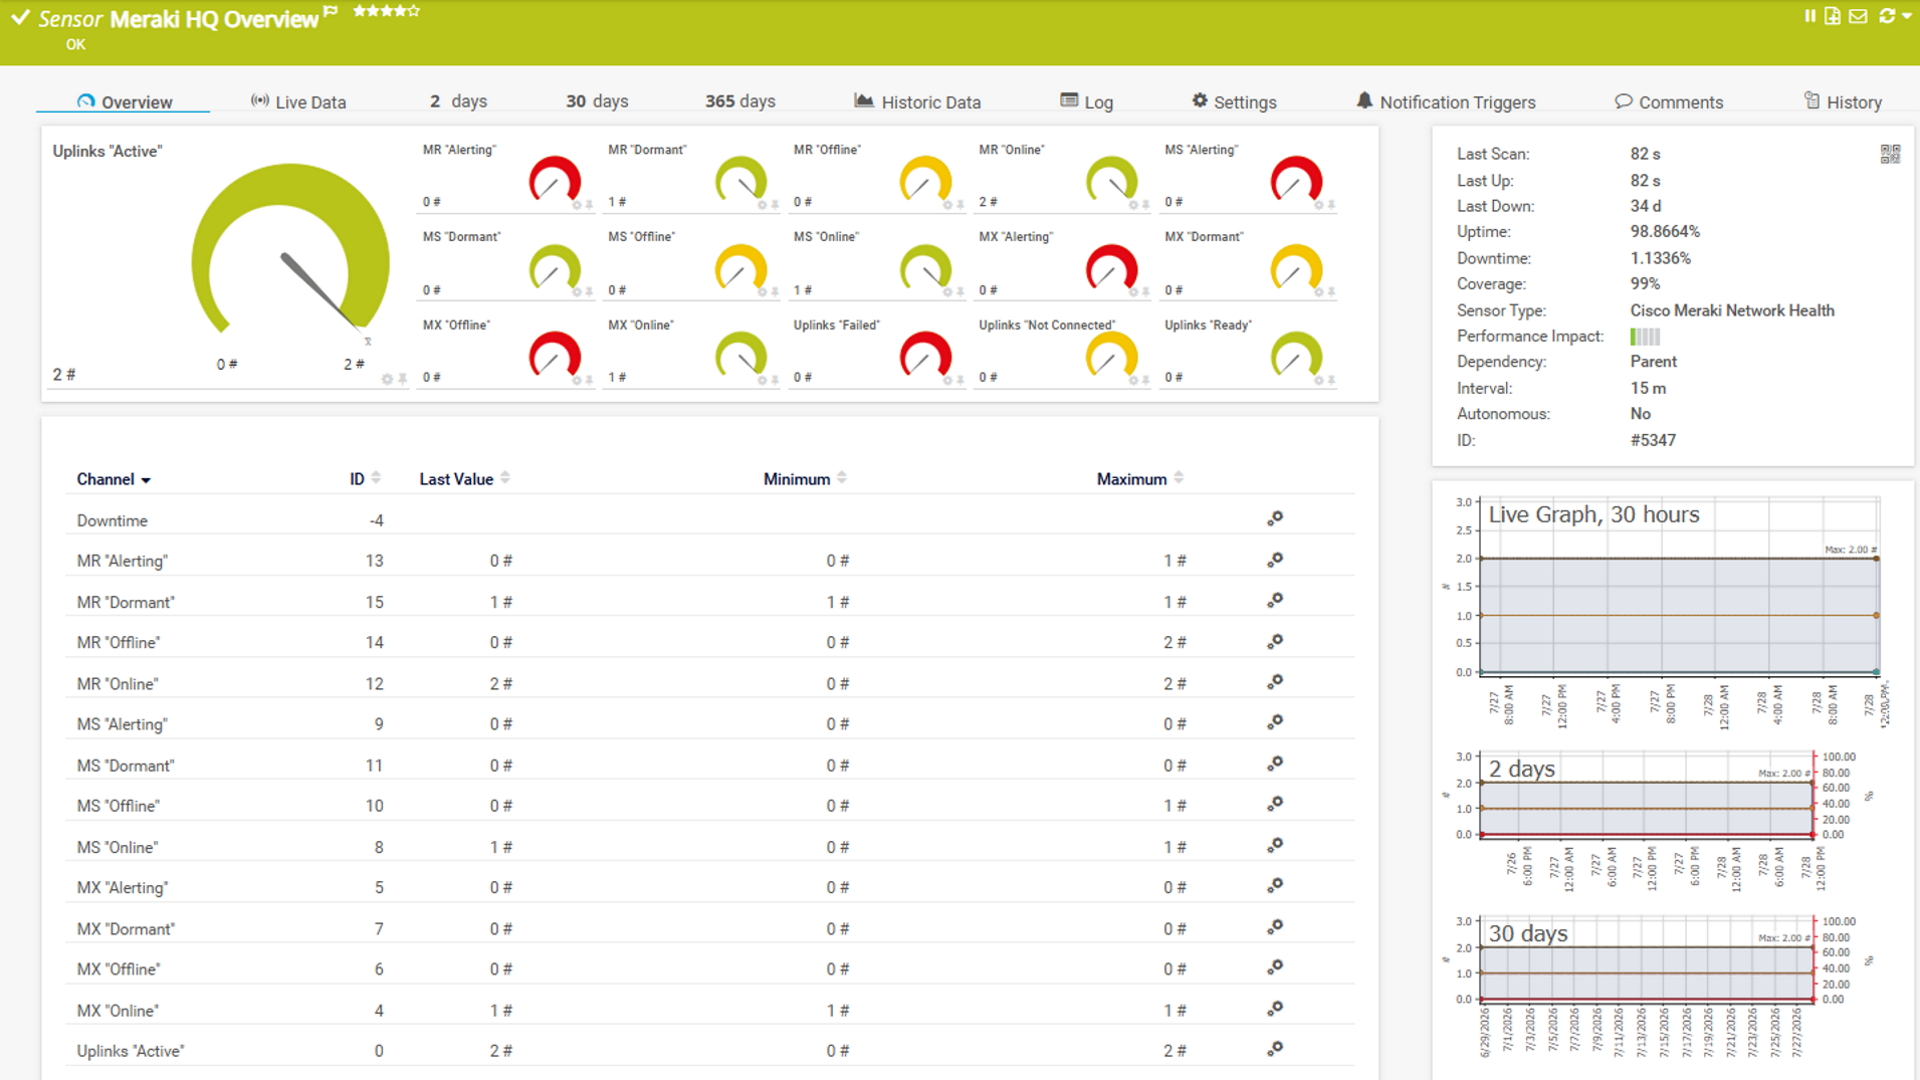
Sensor traffic: live sensor data, updated on your configured scan interval
Adding PRTG next to Graylog follows the same principle PRTG uses everywhere: your live network is the source, and auto-discovery builds monitoring straight from it without touching anything Graylog already does. Consolidation is already a documented pattern here: in our 2026 survey of 1,088 IT teams, 18.7% of decentralized enterprises already running PRTG said they're looking to consolidate additional tools around it. Four steps take you from installation to full infrastructure visibility.
Graylog keeps doing its job. There's nothing to export or migrate out of Graylog. It keeps collecting and analyzing your log data exactly as it does today, untouched. Install PRTG as a separate, independent installation alongside it, and the two run side by side from day one, with nothing shared and nothing to disrupt.
Let auto-discovery build your monitoring. Enter your IP ranges and device credentials (e.g. for protocols like SNMP or WMI) and let PRTG's auto-discovery scan those network segments. It identifies device types on its own and creates suitable sensors from built-in device templates, all pulled from what's actually running rather than a list anyone has to assemble by hand. Review the result and add anything auto-discovery couldn't reach on its own, such as a device sitting behind a firewall that blocks ping.
Set the alerting Graylog isn't built to send. Configure threshold-based notification triggers on the sensors that matter most: a device going down, a disk filling up, a service that stops responding. PRTG's built-in notification methods cover email, SMS, push, Microsoft Teams, and Slack, so alerts land in the tools your team already watches. This is the gap dedicated monitoring closes that a log platform, built for a different job, doesn't.
Tune it in, then leave both running. Adjust thresholds and schedules over the first few weeks as real alerts come in, and build the maps and reports your team relies on day to day. There's no cutover date to plan for and no old tool to decommission. PRTG and Graylog simply keep running side by side, each doing the job it's built for.
No. PRTG runs alongside Graylog, watching device and service health through its own sensors while Graylog keeps doing exactly what it already does with your log data. Nothing about your existing Graylog setup needs to change. The two cover different jobs, and most teams that add PRTG keep using both.
Graylog Operations is the earlier name for what Graylog now markets as Graylog Enterprise, its centralized log management tier. The rename shows up across Graylog's current product pages, though the older name still appears in some of Graylog's own documentation and in third-party listings. If you're comparing quotes or reviews under either name, they refer to the same underlying product.
Not at the same depth. PRTG's Syslog Receiver and SNMP Trap Receiver sensors can count, filter, and alert on incoming messages, and store them for basic review, but they're not built for full-text search, parsing, or correlation across large volumes of log data. That's what a dedicated log platform like Graylog is for.
PRTG monitors distributed environments using remote probes that report back to a central core server, so one deployment can cover multiple locations. Larger organizations often run a separate PRTG instance per site or business unit instead, keeping each site's monitoring and access fully independent. Either way, sites don't have to share a single set of permissions or a single administrator to get started.
No, because PRTG's license isn't tied to log or data volume at all. You license by sensor, a number tied to what you choose to monitor, not to how much data flows through your network or your log platform in any given month. Log volume and PRTG's bill are two separate things.
No extra complexity carries over. PRTG's auto-discovery scans your network on its own schedule, independent of anything already running, and applies preconfigured sensors without needing details from your existing Graylog setup. Most teams see real results within the same session they install it. That holds up long after setup too: in our 2026 survey of 1,088 IT teams, 89.5% of respondents rated PRTG's reliability among their top two scores.
We also compared PRTG with other monitoring tools:
LogicMonitor might be your choice if your organization is cloud-first and relies heavily on cloud services. However, LogicMonitor’s out-of-the-box monitoring functionality is much more limited.
Grafana excels at visualization but requires additional tools for data collection. PRTG offers complete monitoring with pre-configured sensors and predictable pricing without data volume limitations.
Comparison with Grafana
Prometheus is an open-source tool that excels at monitoring containerized applications. However, it lacks comprehensive network monitoring capabilities and requires extensive manual configuration for infrastructure visibility.
Icinga is an open-source monitoring tool offering flexibility but requiring advanced technical knowledge. Its setup and maintenance can be complex, especially for teams lacking dedicated Linux expertise.
Start a 30-day trial with unlimited sensors, no commitment required.
Tell us your device count and we'll send you a quote.
See PRTG in a live demo with one of our monitoring experts.
