

• Company
    • About Us
    • Case Studies
    • Press Center
    • Careers
    • Blog
    • Contact us
  • Contact us
  • Login
 
  • English
    • Deutsch
    • Español
    • Français
    • Italiano
    • Português
Paessler
                    - The Monitoring Experts
  • Products
    • Paessler PRTG
      Paessler PRTGMonitor your whole IT infrastructure
      • PRTG Network Monitor
      • PRTG Enterprise Monitor
      • PRTG Hosted Monitor
      • PRTG UVexplorer
      • PRTG extensionsExtensions for Paessler PRTGExtend your monitoring to a new level
    • Icon Features
      FeaturesExplore all monitoring features
      • Maps & dashboards
      • Alerts & notifications
      • Multiple user interfaces
      • Distributed monitoring
      • Customizable reporting
  • Solutions
    • By TeamFor your organization size
      • Small Business IT
      • Mid-Market IT
      • Enterprise IT
      • MSP Network Monitoring
    • Industries
      By IndustryFor your business sector
      • Industrial
      • Healthcare
      • Government
      • Education
      • Data Center
      • Finance
    • IT Topics
      By Use CaseFor every technical scenario
      • Network Monitoring
      • Server Monitoring
      • OT Monitoring
      • Distributed Monitoring
      • Network Topology Mapping
      • SNMP Monitoring
      • Bandwidth Monitoring
  • Pricing
  • Resources
    • Getting Started
      Getting StartedModules for self-paced learning
    • How-to Guides
      How-to GuidesGet the most out of PRTG
    • Videos & Webinars
      Videos & WebinarsLearn from Paessler experts
    • IT  Knowledge
      IT KnowledgeExpand your IT knowledge
    • PRTG Manual
      PRTG ManualFull documentation
    • Knowledge Base
      Knowledge BaseShare community knowledge
    • PRTG Sensor Hub
      PRTG Sensor HubGet sensors, scripts & templates
    • Trainings
      PRTG TrainingLearn how to work with PRTG
  • Partners
    • Icon Handshake
      Become a PartnerFor resellers and channel partners
    • Icon MSP
      Become an MSPDeliver monitoring as a managed service
    • icon partner
      Partner PortalLog in to your partner account
    • Deal Registration
      Deal RegistrationRegister your sales opportunities
    • icon search
      Find a PartnerFind partners selling Paessler products
    • icon technology
      Technology AlliancesSee Paessler technology partnerships
    • Partner HubTools for Your Success
  • Company
    • About Us
    • Case Studies
    • Press Center
    • Careers
    • Blog
    • Contact us
  • Contact us
  • Login
  • English
    • Deutsch
    • Español
    • Français
    • Italiano
    • Português
  • Get a quote
  • Free trial
  1. Home>
  2. Company>
  3. Case Studies>
  4. Pepe Jeans

Global retail, 350 locations, one dashboard: how Pepe Jeans keeps its network healthy with PRTG

Challenge: No network baseline or centralized visibility across 350 global locations

download PDF
Logo Pepe Jeans

COMPANY
Pepe Jeans

INDUSTRY
Retail

COMPANY SIZE
Enterprise

COUNTRY
Spain

SCALE
350 remote locations, 6,000 sensors, LAN and WAN monitoring

Icon Sensors

6,000 sensors monitoring LAN, WAN, and device health across 350 locations

Icon time.

Network baseline established with real-time trend data on bandwidth and hardware

Icon Configuration

Faulty devices identified and replaced proactively before causing outages

The problem

Pepe Jeans is an international clothing retailer with offices and stores across the globe. The IT network team needed three things it couldn't reliably do before: establish a network baseline, track the health status of devices across all locations, and monitor bandwidth on WAN communication lines. 

The existing toolset was costly and time-intensive. Without real-time visibility into remote offices, finding the source of a network problem was slow. Troubleshooting consumed resources that should have gone toward higher-value projects. 

The team also needed full Cisco device support and a proper GUI, not just a command line. 

What changed with PRTG

PRTG gave Pepe Jeans a single monitoring environment covering LAN and WAN across all 350 locations. A remote probe handles the distributed sites, while 6,000 sensors track device health, bandwidth, interface status, and connectivity in real time. 

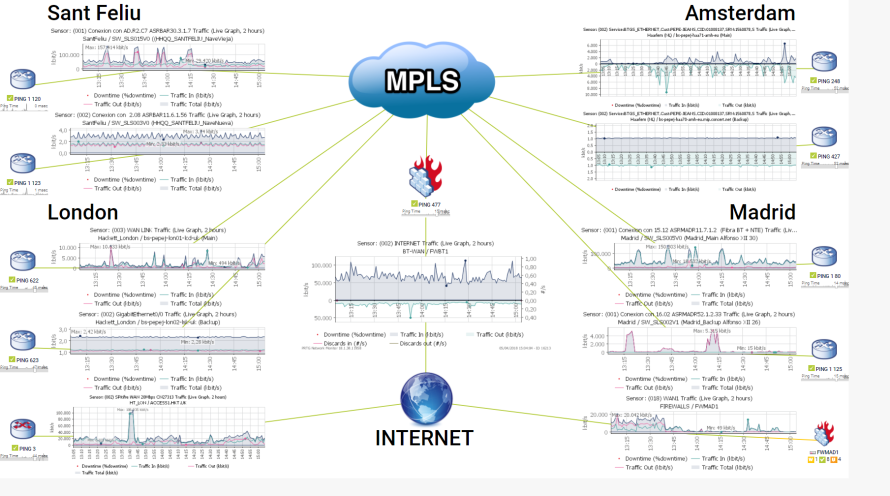
Weather maps provide a live view of WAN link status for every remote office worldwide. When a link degrades or a device triggers repeated alarms, the team can pinpoint the source before it becomes a full outage. 

Trend analysis across bandwidth usage and hardware performance drives proactive decisions. Devices repeatedly triggering alarms were identified and replaced. WAN lines flagged for interface flapping were reviewed before causing disruption. 

Threshold-based alerts notify the team automatically. Less time investigating means more time on projects that matter to the business. 

PRTG has become an essential tool in our daily tasks. Not only is the software great but also the people behind it. We've contacted their support many times to request assistance, and their attention has always been excellent.

Xavier Marchador, Senior IT Network Engineer
Pepe Jeans
PRTG Logo

PRTG gives global retail IT teams the visibility they need to manage distributed networks proactively and spend less time firefighting. 

CONTACT SALES
Global PRTG map Pepe Jeans main offices

Discover more monitoring insights and stories

Solution illustration

Solutions for all your monitoring needs

  • Network Monitoring Tool
  • Bandwidth Monitoring
  • Network Mapping
Content illustration

Powerful stories from the monitoring world

  • Customer success stories - Paessler
  • Customer success story: Riverford & PRTG
  • Video: PRTG Network Monitor – Smart Setup
Support illustration

Resources to master your monitoring challenges

  • How can I use the PRTG Application Programming Interface (API)?
  • How can I propose new features or sensors for PRTG?
  • I run PRTG on VMware. How can I obtain best performance?
Explore All Case Studies

Products

  • Paessler PRTG
    Paessler PRTGMonitor your whole IT infrastructure
    • PRTG Network Monitor
    • PRTG Enterprise Monitor
    • PRTG Hosted Monitor
    • PRTG UVexplorer
    • PRTG extensions
      Extensions for Paessler PRTGExtend your monitoring to a new level
  • Icon Features
    FeaturesExplore all monitoring features

Monitoring with PRTG

  • Network monitoring
  • Bandwidth monitoring
  • SNMP monitoring
  • Network mapping
  • Wi-Fi monitoring
  • Server monitoring
  • Network traffic analyzer
  • NetFlow monitoring
  • Syslog server

Useful Links

  • PRTG Manual
  • Knowledge Base
  • Customer Success Stories
  • About Paessler
  • Subscribe to newsletter
  • PRTG Support
  • PRTG Consulting
  • PRTG Feedback & Roadmap

Contact

Paessler GmbH
Thurn-und-Taxis-Str. 14, 
90411 Nuremberg 
Germany

[email protected]

+49 911 93775-0

  • Contact us
©2026 Paessler GmbHTerms & ConditionsPrivacy PolicyImprintReport VulnerabilityDownload & InstallSitemap
Cisco Router Monitoring Cisco Router Monitoring Cisco Router Monitoring


