• Company
    • About Us
    • Case Studies
    • Press Center
    • Careers
    • Blog
    • Contact us
  • Contact us
  • Login
 
  • English
    • Deutsch
    • Español
    • Français
    • Italiano
    • Português
Paessler
                    - The Monitoring Experts
  • Products
    • Paessler PRTG
      Paessler PRTGMonitor your whole IT infrastructure
      • PRTG Network Monitor
      • PRTG Enterprise Monitor
      • PRTG Hosted Monitor
      • PRTG UVexplorer
      • PRTG extensionsExtensions for Paessler PRTGExtend your monitoring to a new level
    • Icon Features
      FeaturesExplore all monitoring features
      • Maps & dashboards
      • Alerts & notifications
      • Multiple user interfaces
      • Distributed monitoring
      • Customizable reporting
  • Solutions
    • By TeamFor your organization size
      • Small Business IT
      • Mid-Market IT
      • Enterprise IT
      • MSP Network Monitoring
    • Industries
      By IndustryFor your business sector
      • Industrial
      • Healthcare
      • Government
      • Education
      • Data Center
      • Finance
    • IT Topics
      By Use CaseFor every technical scenario
      • Network Monitoring
      • Server Monitoring
      • OT Monitoring
      • Distributed Monitoring
      • Network Topology Mapping
      • SNMP Monitoring
      • Bandwidth Monitoring
  • Pricing
  • Resources
    • Getting Started
      Getting StartedModules for self-paced learning
    • How-to Guides
      How-to GuidesGet the most out of PRTG
    • Videos & Webinars
      Videos & WebinarsLearn from Paessler experts
    • IT  Knowledge
      IT KnowledgeExpand your IT knowledge
    • PRTG Manual
      PRTG ManualFull documentation
    • Knowledge Base
      Knowledge BaseShare community knowledge
    • PRTG Sensor Hub
      PRTG Sensor HubGet sensors, scripts & templates
    • Trainings
      PRTG TrainingLearn how to work with PRTG
  • Partners
    • Icon Handshake
      Become a PartnerFor resellers and channel partners
    • Icon MSP
      Become an MSPDeliver monitoring as a managed service
    • icon partner
      Partner PortalLog in to your partner account
    • Deal Registration
      Deal RegistrationRegister your sales opportunities
    • icon search
      Find a PartnerFind partners selling Paessler products
    • icon technology
      Technology AlliancesSee Paessler technology partnerships
    • Partner HubTools for Your Success
  • Company
    • About Us
    • Case Studies
    • Press Center
    • Careers
    • Blog
    • Contact us
  • Contact us
  • Login
  • English
    • Deutsch
    • Español
    • Français
    • Italiano
    • Português
  • Get a quote
  • Free trial
  1. Home>
  2. Company>
  3. Case Studies>
  4. Nobia

10,000 Sensors, One View: How Nobia Monitors Its Europe-Wide IT with PRTG

Challenge: Getting a single, reliable view of IT performance across a distributed European network while shifting from reactive firefighting to proactive monitoring

download PDF
Logo Company Nobia

COMPANY
Nobia

INDUSTRY
Manufacturing

COMPANY SIZE
Enterprise

COUNTRY
Sweden

SCALE
6,100+ employees, multiple countries and data centers

Icon Centralized Monitoring

AWS, VPN, firewall, certificate, and factory equipment monitored from one platform

Icon Offline

Offline blade server identified by PRTG before it caused a system failure

Icon Clock Fast

VPN capacity monitoring stood up within hours when demand spiked unexpectedly

The problem

Nobia develops and sells kitchen solutions through brands across Europe, including Magnet, HTH, Marbodal, ewe, and Bribus. With operations in multiple countries and data centers across the continent, the IT team had no consistent view of how the network performed outside headquarters.

Without visibility across geographies, users would be impacted before IT knew anything was wrong. The team was spending too much time firefighting and not enough time improving performance.

Vendor tools couldn't deliver the cross-environment visibility the team needed. Delegating monitoring access outside the core network team wasn't easily achievable. One platform was needed.

What changed with PRTG

Nobia consolidated onto PRTG Network Monitor and expanded its use across the full environment. Today, close to 10,000 sensors monitor all core and access networking infrastructure across Europe.

The immediate impact was visibility. Data from different geographic locations could finally be collected and analyzed together, giving the team a much clearer picture of network performance outside HQ.

PRTG now monitors SSL certificate validity, AWS availability, VPN connections, firewall failovers, CPU usage, and factory equipment. When VPN demand spiked, the team used PRTG to monitor capacity and delegate visibility outside the core network team. The solution was live within hours.

PRTG surfaced an issue Cisco's own management system had missed: a blade server in the UK had been offline for months. PRTG flagged it. The team contacted Cisco and avoided a system failure.

We appreciate the flexibility of PRTG and how it grows together with the company, supporting our needs to also digitalize the factory floor and monitor not only standard IT infrastructure but also factory equipment.

Sandeep Rai, Network and Security Team Lead
Nobia
PRTG Logo

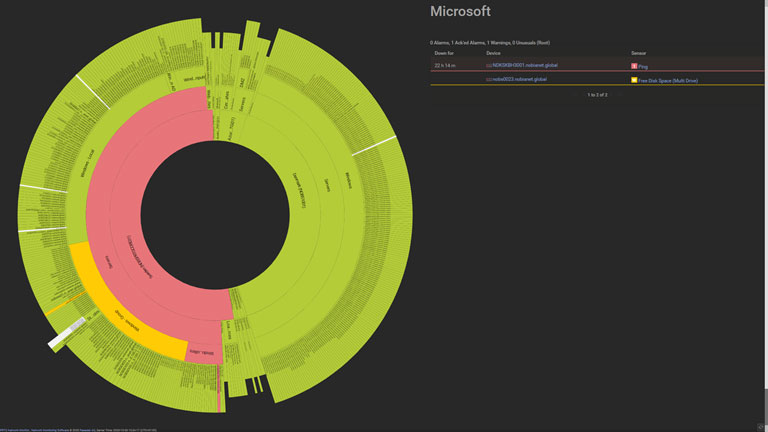
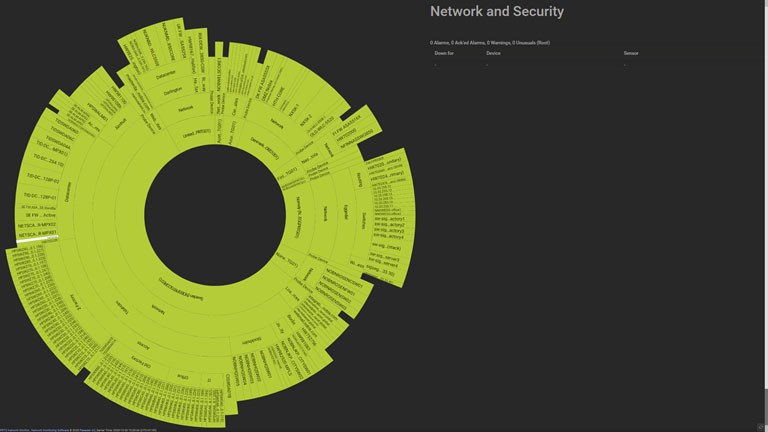
PRTG monitors distributed enterprise networks, cloud infrastructure, and factory equipment from one platform.

CONTACT SALES
Nobia Screenshot Map Network Security
Nobia Screenshot Map Microsoft

Discover more monitoring insights and stories

Solution illustration

Solutions for all your monitoring needs

  • OPC UA Monitoring
  • HMI Monitoring
  • Industrial IT Monitoring
Content illustration

Powerful stories from the monitoring world

  • Customer success stories - Paessler
  • Nobia gets a global view of their IT operations with PRTG
  • Customer success story: Bosch Energy and Building Solutions with PRTG
Support illustration

Resources to master your monitoring challenges

  • How can I move or migrate a PRTG installation to a different system or server?
  • Understanding Basic Concepts
  • How can I use the PRTG Application Programming Interface (API)?
Explore All Case Studies

Products

  • Paessler PRTG
    Paessler PRTGMonitor your whole IT infrastructure
    • PRTG Network Monitor
    • PRTG Enterprise Monitor
    • PRTG Hosted Monitor
    • PRTG UVexplorer
    • PRTG extensions
      Extensions for Paessler PRTGExtend your monitoring to a new level
  • Icon Features
    FeaturesExplore all monitoring features

Monitoring with PRTG

  • Network monitoring
  • Bandwidth monitoring
  • SNMP monitoring
  • Network mapping
  • Wi-Fi monitoring
  • Server monitoring
  • Network traffic analyzer
  • NetFlow monitoring
  • Syslog server

Useful Links

  • PRTG Manual
  • Knowledge Base
  • Customer Success Stories
  • About Paessler
  • Subscribe to newsletter
  • PRTG Support
  • PRTG Consulting
  • PRTG Feedback & Roadmap

Contact

Paessler GmbH
Thurn-und-Taxis-Str. 14, 
90411 Nuremberg 
Germany

[email protected]

+49 911 93775-0

  • Contact us
©2026 Paessler GmbHTerms & ConditionsPrivacy PolicyImprintReport VulnerabilityDownload & InstallSitemap
vCenter Monitoring vCenter Monitoring vCenter Monitoring