• Company
    • About Us
    • Case Studies
    • Press Center
    • Careers
    • Blog
    • Contact us
  • Contact us
  • Login
 
  • English
    • Deutsch
    • Español
    • Français
    • Italiano
    • Português
Paessler
                    - The Monitoring Experts
  • Products
    • Paessler PRTG
      Paessler PRTGMonitor your whole IT infrastructure
      • PRTG Network Monitor
      • PRTG Enterprise Monitor
      • PRTG Hosted Monitor
      • PRTG UVexplorer
      • PRTG extensionsExtensions for Paessler PRTGExtend your monitoring to a new level
    • Icon Features
      FeaturesExplore all monitoring features
      • Maps & dashboards
      • Alerts & notifications
      • Multiple user interfaces
      • Distributed monitoring
      • Customizable reporting
  • Solutions
    • By TeamFor your organization size
      • Small Business IT
      • Mid-Market IT
      • Enterprise IT
      • MSP Network Monitoring
    • Industries
      By IndustryFor your business sector
      • Industrial
      • Healthcare
      • Government
      • Education
      • Data Center
      • Finance
    • IT Topics
      By Use CaseFor every technical scenario
      • Network Monitoring
      • Server Monitoring
      • OT Monitoring
      • Distributed Monitoring
      • Network Topology Mapping
      • SNMP Monitoring
      • Bandwidth Monitoring
  • Pricing
  • Resources
    • Getting Started
      Getting StartedModules for self-paced learning
    • How-to Guides
      How-to GuidesGet the most out of PRTG
    • Videos & Webinars
      Videos & WebinarsLearn from Paessler experts
    • IT  Knowledge
      IT KnowledgeExpand your IT knowledge
    • PRTG Manual
      PRTG ManualFull documentation
    • Knowledge Base
      Knowledge BaseShare community knowledge
    • PRTG Sensor Hub
      PRTG Sensor HubGet sensors, scripts & templates
    • Trainings
      PRTG TrainingLearn how to work with PRTG
  • Partners
    • Icon Handshake
      Become a PartnerFor resellers and channel partners
    • Icon MSP
      Become an MSPDeliver monitoring as a managed service
    • icon partner
      Partner PortalLog in to your partner account
    • Deal Registration
      Deal RegistrationRegister your sales opportunities
    • icon search
      Find a PartnerFind partners selling Paessler products
    • icon technology
      Technology AlliancesSee Paessler technology partnerships
    • Partner HubTools for Your Success
  • Company
    • About Us
    • Case Studies
    • Press Center
    • Careers
    • Blog
    • Contact us
  • Contact us
  • Login
  • English
    • Deutsch
    • Español
    • Français
    • Italiano
    • Português
  • Get a quote
  • Free trial
  1. Home>
  2. Company>
  3. Case Studies>
  4. KTR Systems

No more shadow IT: how KTR Systems gained full visibility across 24 global subsidiaries with PRTG and Qbilon

Challenge: Manual IT documentation too slow and error-prone to keep pace with growth across international locations

download PDF
Logo Company KTR Systems

COMPANY
KTR Systems GmbH

INDUSTRY
Manufacturing

COMPANY SIZE
Midsized Company

COUNTRY
Germany

SCALE
1,200+ employees, 24 subsidiaries, multi-site distributed infrastructure

Icon Gauge

Emergency concept preparation effort reduced by at least 30%

Icon Server

IT landscape across 24 subsidiaries captured in a single, always-current repository

Icon Workflow

Migration planning supported by automated dependency diagrams covering direct and indirect connections

The problem

KTR Systems is an engineering company with 24 subsidiaries worldwide. As the company grew, so did the complexity of its IT landscape. Each new location added hardware, software, and dependencies that needed to be documented and monitored.

The existing documentation process was manual, time-consuming, and prone to going stale. Spreadsheets and hand-drawn diagrams couldn't keep up with the pace of change. Without an accurate picture of system dependencies, migration projects carried hidden risks.

The team needed two things working together: real-time monitoring to see what was happening now, and architecture documentation to understand how everything connected.

What changed with PRTG

KTR Systems had been using PRTG for real-time network monitoring across all sites. PRTG provided continuous visibility into servers, devices, applications, and services.

Qbilon was added to complement that monitoring with Enterprise Architecture Management. It pulls data from PRTG and other sources, building a centralized architecture repository with dependency diagrams at multiple levels of abstraction. IT documentation now updates automatically.

Together, the two platforms cover three areas that previously required heavy manual effort. Automated documentation keeps records current without extra work from admins. Dependency visualization supports migration planning by surfacing indirect connections manual processes miss. Automated reporting bundles infrastructure data into audit-ready reports, including emergency plans, without staff compiling them by hand.

Qbilon joined the Paessler Group, tightening the integration between both platforms.

The combination of PRTG and Qbilon brings great benefits for mapping our infrastructure, technical dependencies, and processes. We have been complementing our PRTG monitoring with Qbilon since 2019 – and I am 100% behind this product.

Olaf Korbanek, Head of IT Department
KTR Systems GmbH
PRTG Logo

PRTG and Qbilon give multi-site manufacturing organizations the monitoring depth and architecture clarity to manage complex IT landscapes without losing control.

CONTACT SALES
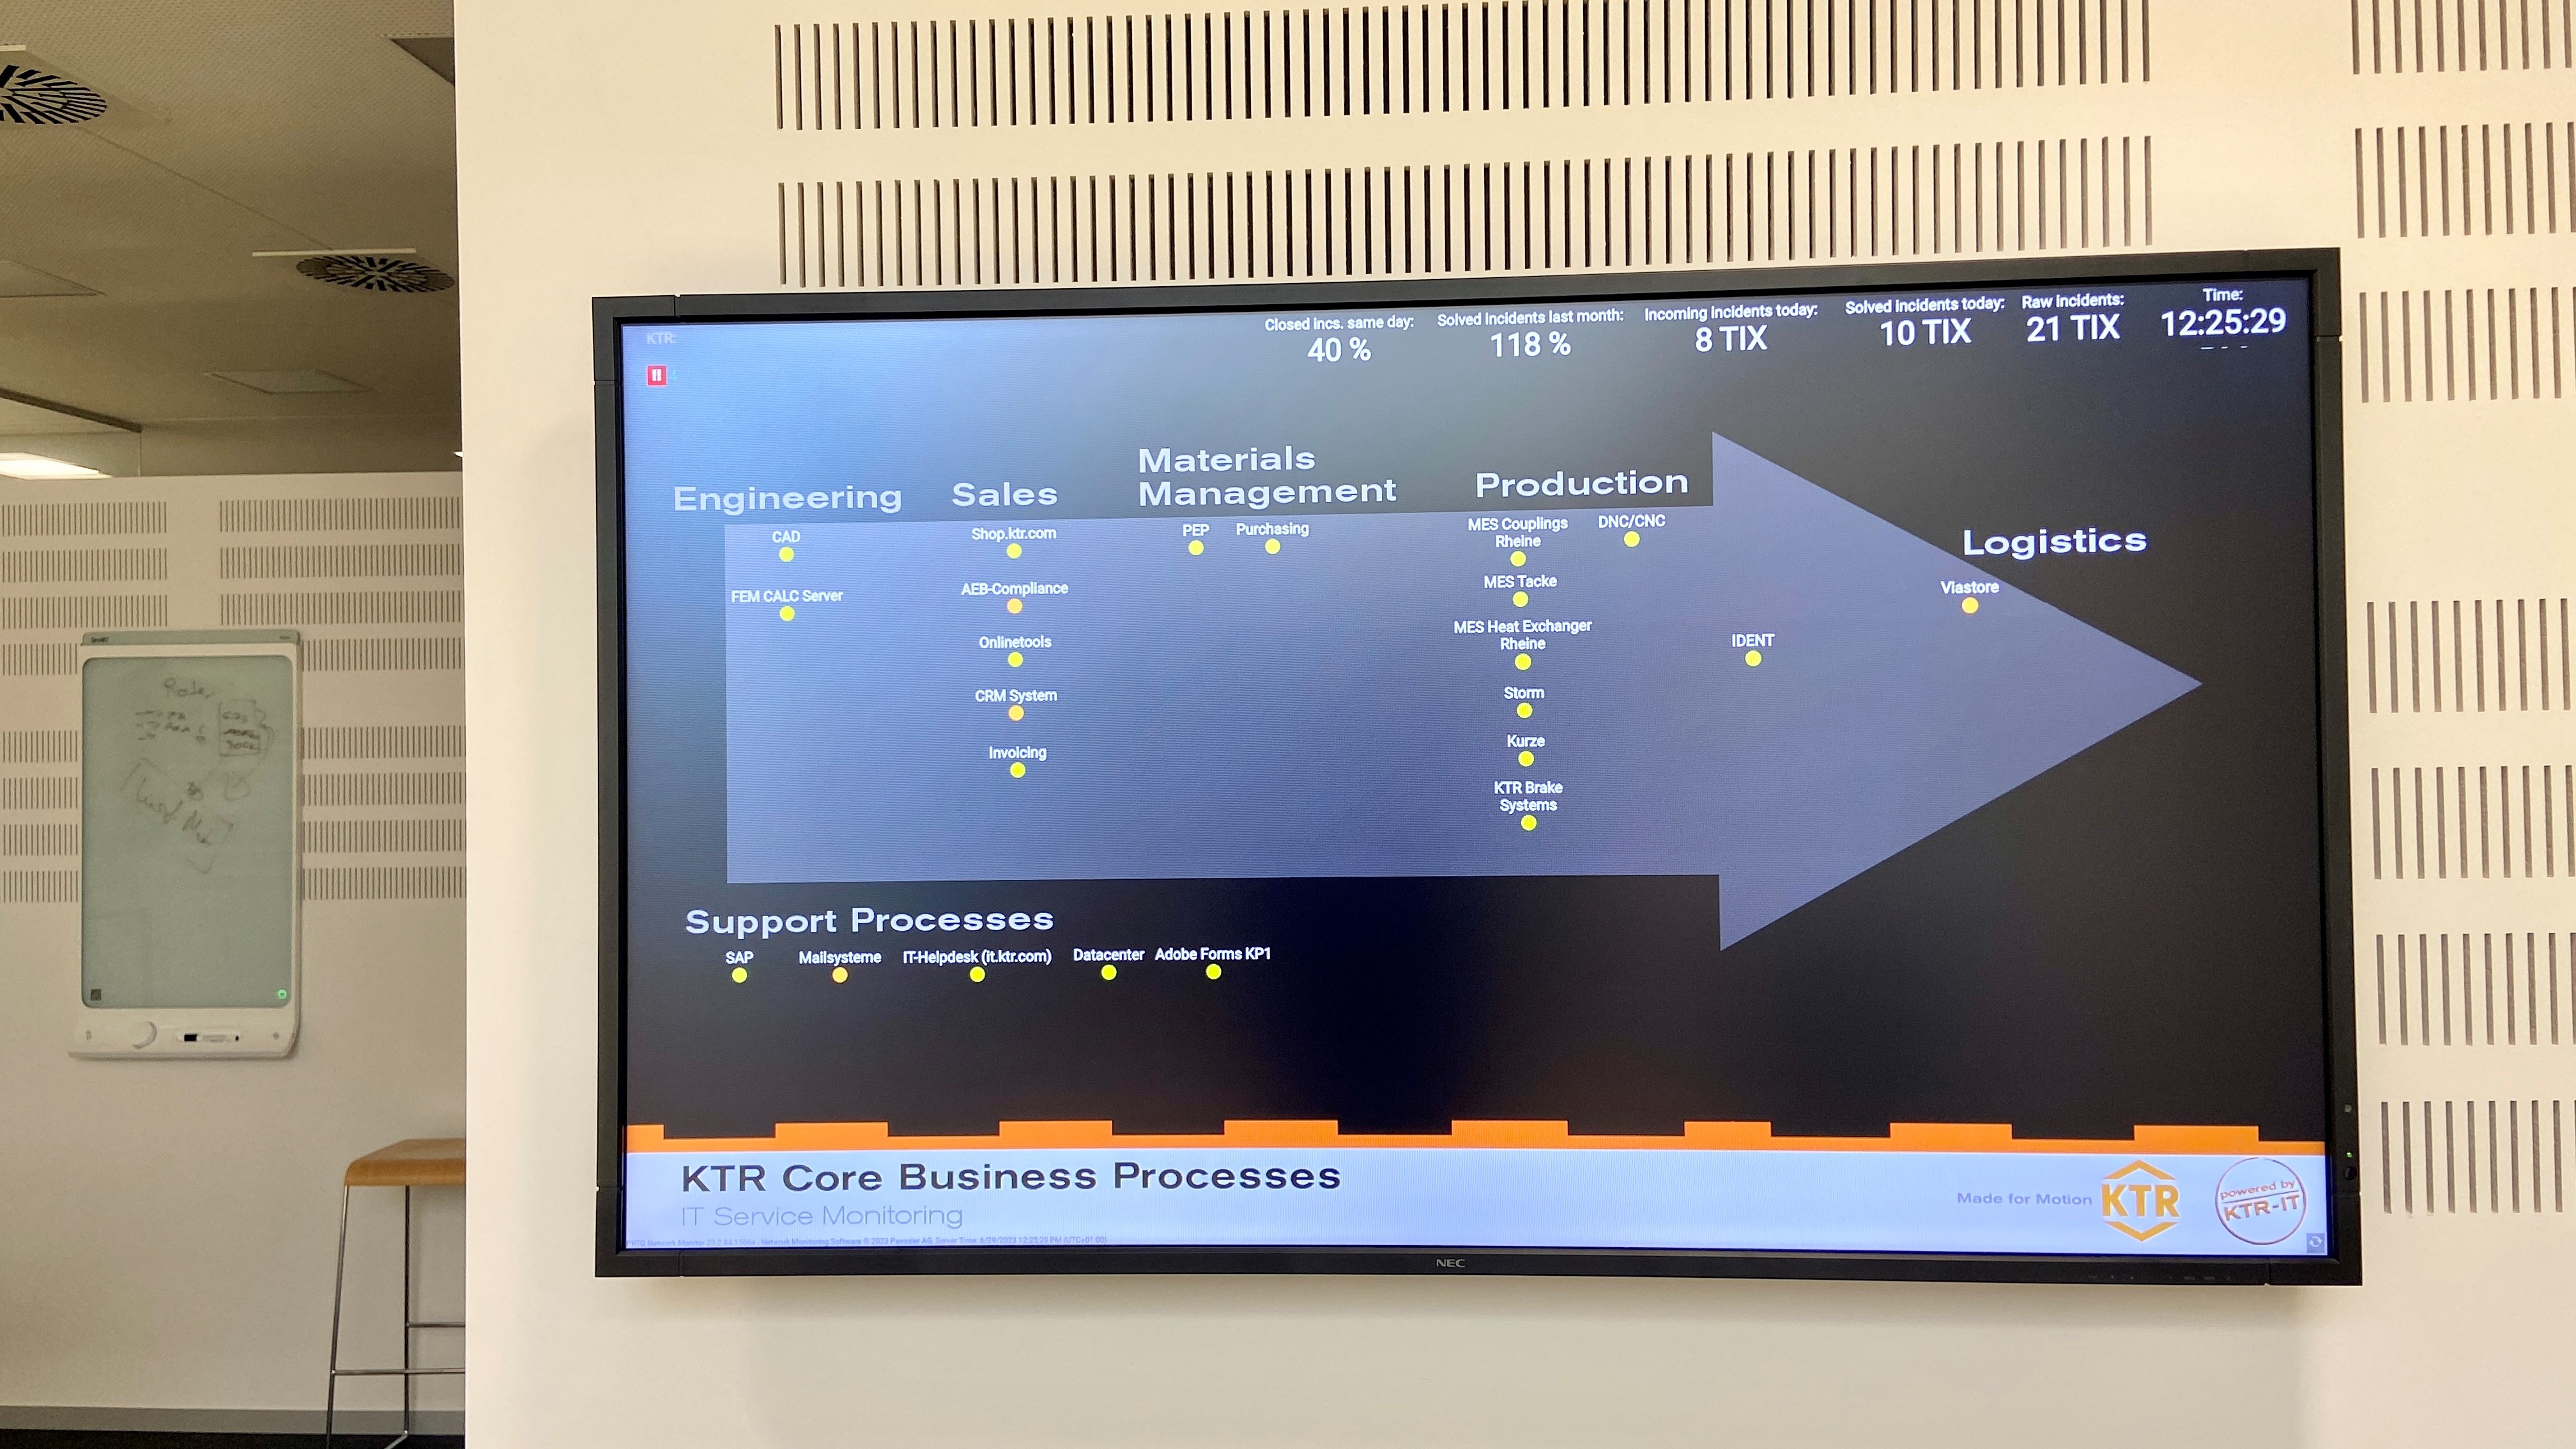
case study KTR core systems business processes
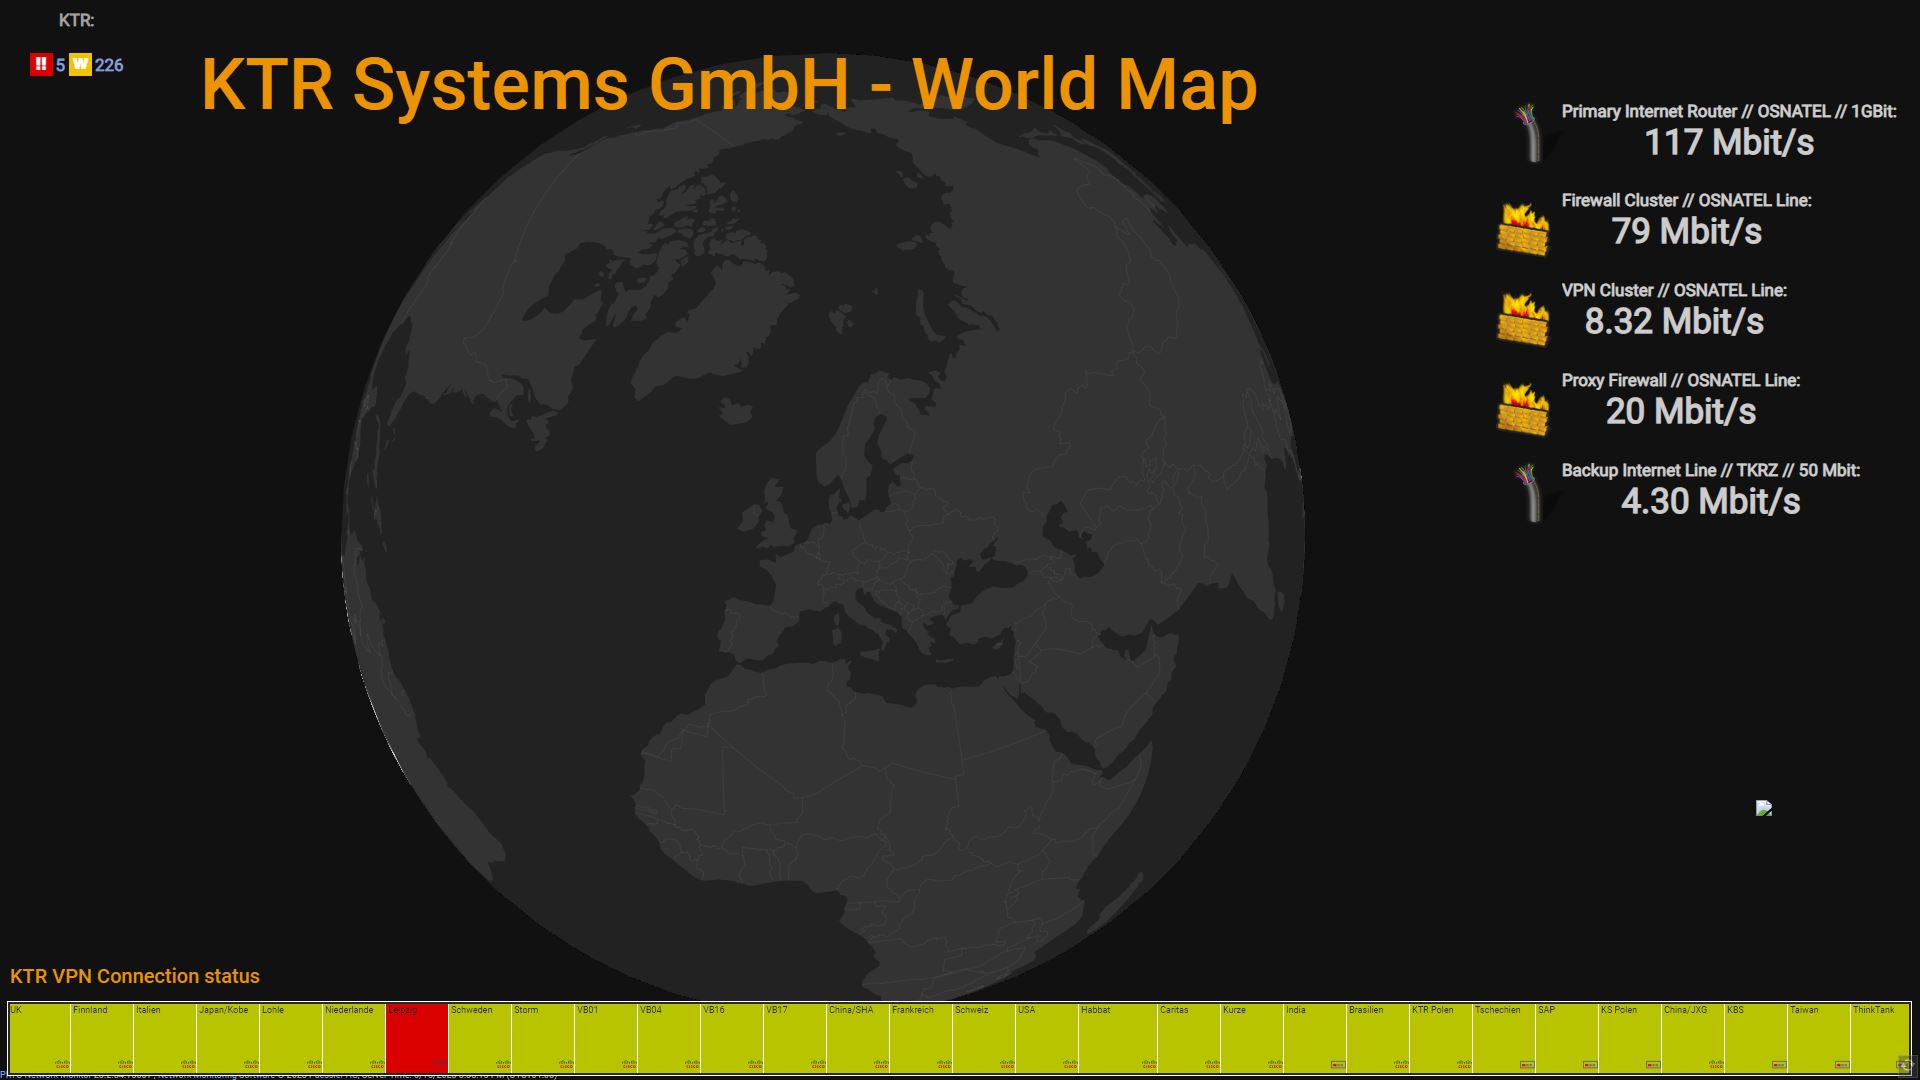
case study ktr systems world map

Discover more monitoring insights and stories

Solution illustration

Solutions for all your monitoring needs

  • SNMP Monitoring
  • NetFlow Monitoring
  • Bandwidth Monitoring
Content illustration

Powerful stories from the monitoring world

  • Customer success stories - Paessler
  • Customer success story: Bosch Energy and Building Solutions with PRTG
  • Monitoring FortiGate Firewalls with Paessler PRTG
Support illustration

Resources to master your monitoring challenges

  • PRTG Apps for Mobile Network Monitoring
  • I run PRTG on VMware. How can I obtain best performance?
  • How can I move or migrate a PRTG installation to a different system or server?
Explore All Case Studies

Products

  • Paessler PRTG
    Paessler PRTGMonitor your whole IT infrastructure
    • PRTG Network Monitor
    • PRTG Enterprise Monitor
    • PRTG Hosted Monitor
    • PRTG UVexplorer
    • PRTG extensions
      Extensions for Paessler PRTGExtend your monitoring to a new level
  • Icon Features
    FeaturesExplore all monitoring features

Monitoring with PRTG

  • Network monitoring
  • Bandwidth monitoring
  • SNMP monitoring
  • Network mapping
  • Wi-Fi monitoring
  • Server monitoring
  • Network traffic analyzer
  • NetFlow monitoring
  • Syslog server

Useful Links

  • PRTG Manual
  • Knowledge Base
  • Customer Success Stories
  • About Paessler
  • Subscribe to newsletter
  • PRTG Support
  • PRTG Consulting
  • PRTG Feedback & Roadmap

Contact

Paessler GmbH
Thurn-und-Taxis-Str. 14, 
90411 Nuremberg 
Germany

[email protected]

+49 911 93775-0

  • Contact us
©2026 Paessler GmbHTerms & ConditionsPrivacy PolicyImprintReport VulnerabilityDownload & InstallSitemap
Cisco Router Monitoring Cisco Router Monitoring Cisco Router Monitoring