

• Company
    • About Us
    • Case Studies
    • Press Center
    • Careers
    • Blog
    • Contact us
  • Contact us
  • Login
 
  • English
    • Deutsch
    • Español
    • Français
    • Italiano
    • Português
Paessler
                    - The Monitoring Experts
  • Products
    • Paessler PRTG
      Paessler PRTGMonitor your whole IT infrastructure
      • PRTG Network Monitor
      • PRTG Enterprise Monitor
      • PRTG Hosted Monitor
      • PRTG UVexplorer
      • PRTG extensionsExtensions for Paessler PRTGExtend your monitoring to a new level
    • Icon Features
      FeaturesExplore all monitoring features
      • Maps & dashboards
      • Alerts & notifications
      • Multiple user interfaces
      • Distributed monitoring
      • Customizable reporting
  • Solutions
    • By TeamFor your organization size
      • Small Business IT
      • Mid-Market IT
      • Enterprise IT
      • MSP Network Monitoring
    • Industries
      By IndustryFor your business sector
      • Industrial
      • Healthcare
      • Government
      • Education
      • Data Center
      • Finance
    • IT Topics
      By Use CaseFor every technical scenario
      • Network Monitoring
      • Server Monitoring
      • OT Monitoring
      • Distributed Monitoring
      • Network Topology Mapping
      • SNMP Monitoring
      • Bandwidth Monitoring
  • Pricing
  • Resources
    • Getting Started
      Getting StartedModules for self-paced learning
    • How-to Guides
      How-to GuidesGet the most out of PRTG
    • Videos & Webinars
      Videos & WebinarsLearn from Paessler experts
    • IT  Knowledge
      IT KnowledgeExpand your IT knowledge
    • PRTG Manual
      PRTG ManualFull documentation
    • Knowledge Base
      Knowledge BaseShare community knowledge
    • PRTG Sensor Hub
      PRTG Sensor HubGet sensors, scripts & templates
    • Trainings
      PRTG TrainingLearn how to work with PRTG
  • Partners
    • Icon Handshake
      Become a PartnerFor resellers and channel partners
    • Icon MSP
      Become an MSPDeliver monitoring as a managed service
    • icon partner
      Partner PortalLog in to your partner account
    • Deal Registration
      Deal RegistrationRegister your sales opportunities
    • icon search
      Find a PartnerFind partners selling Paessler products
    • icon technology
      Technology AlliancesSee Paessler technology partnerships
    • Partner HubTools for Your Success
  • Company
    • About Us
    • Case Studies
    • Press Center
    • Careers
    • Blog
    • Contact us
  • Contact us
  • Login
  • English
    • Deutsch
    • Español
    • Français
    • Italiano
    • Português
  • Get a quote
  • Free trial
  1. Home>
  2. Company>
  3. Case Studies>
  4. F.T.P.

IT and OT from one tool: how F.T.P. delivers monitoring-as-a-service across Italy's Motor Valley with PRTG 

Challenge: IT and OT from one tool: how F.T.P. delivers monitoring-as-a-service across Italy's Motor Valley with PRTG

download PDF
Logo F.T.P.

COMPANY
F.T.P.

INDUSTRY
Consulting, Services and MSP (Managed Service Providers)

COMPANY SIZE
SMB

COUNTRY
Italy

SCALE
MSP, 40 clients, automotive and SME, PRTG Enterprise Monitor

Icon watch

40 Italian clients monitored centrally via PRTG Enterprise Monitor in MaaS mode

Icon boost

Downed server calls dramatically reduced through preventive monitoring and early detection 

Icon monitoring dashboard

IT and OT unified in one platform, enabling industrial monitoring for automotive manufacturers

The problem

F.T.P. is an Italian system integrator and MSP based in Modena's Motor Valley, with over 20 years of experience in IT and OT consulting for automotive and SME clients. 

When F.T.P. began targeting SMEs, it found no single tool that could monitor networks, servers, storage, certificates, cameras, and connectivity while remaining agentless, mobile-accessible, and scalable across diverse customer environments. 

For its managed service model, F.T.P. needed centralized control over all clients, with monitoring probes close to each customer and a single core repository, without delegating configuration to the client. 

What changed with PRTG

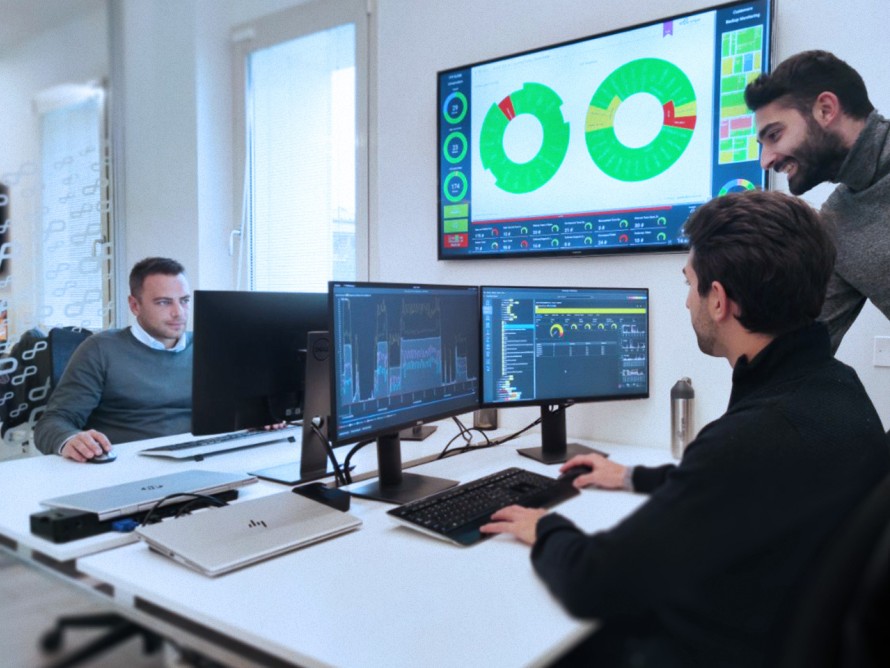
F.T.P. adopted PRTG Enterprise Monitor as its sole monitoring platform, offering it as Monitoring-as-a-Service to approximately 40 Italian clients in SME and enterprise environments. 

Monitoring layers build from uptime and RAM to bandwidth, switch and port performance, server queues, wireless availability, and backup success. Environmental sensors identify anomalies causing excessive energy consumption. Remote branch outages and security-related bandwidth events are intercepted automatically. 

A dramatic reduction in calls about downed servers followed, alongside the preventive identification of misconfigurations before they reach clients. 

F.T.P. later expanded into OT, monitoring production lines at an Italian automotive manufacturer. PRTG's ability to span IT and OT in one platform made F.T.P. the first Paessler Industrial Partner in Italy.

In addition to continuing our collaboration with Paessler in the enterprise sector, F.T.P’s future projects include using PRTG in the implementation of services to support the industrial world. The major advantage of PRTG lies in its ability to offer a single tool for both the IT and OT domains. This is our added value, along with our promise of providing high-quality combined offerings.

Stefano Talami, CEO
F.T.P.
PRTG Logo

PRTG gives MSPs and IT consultants the single platform they need to deliver Monitoring-as-a-Service across IT and OT environments.

free TRIAL
case-study-ftp-office

Discover more monitoring insights and stories

Solution illustration

Solutions for all your monitoring needs

  • FTP Monitoring
  • Monitoring Technologies
  • File Server Monitoring
Content illustration

Powerful stories from the monitoring world

  • Customer success stories - Paessler
  • Customer success story Bechtle
  • Customer success story Noblecom
Support illustration

Resources to master your monitoring challenges

  • FTP connection refused socket error #10061 - Paessler Helpdesk
  • PRTG Manual: FTP Sensor - Paessler
  • PRTG Manual: sFlow Sensor - Paessler
Explore All Case Studies

Products

  • Paessler PRTG
    Paessler PRTGMonitor your whole IT infrastructure
    • PRTG Network Monitor
    • PRTG Enterprise Monitor
    • PRTG Hosted Monitor
    • PRTG UVexplorer
    • PRTG extensions
      Extensions for Paessler PRTGExtend your monitoring to a new level
  • Icon Features
    FeaturesExplore all monitoring features

Monitoring with PRTG

  • Network monitoring
  • Bandwidth monitoring
  • SNMP monitoring
  • Network mapping
  • Wi-Fi monitoring
  • Server monitoring
  • Network traffic analyzer
  • NetFlow monitoring
  • Syslog server

Useful Links

  • PRTG Manual
  • Knowledge Base
  • Customer Success Stories
  • About Paessler
  • Subscribe to newsletter
  • PRTG Support
  • PRTG Consulting
  • PRTG Feedback & Roadmap

Contact

Paessler GmbH
Thurn-und-Taxis-Str. 14, 
90411 Nuremberg 
Germany

[email protected]

+49 911 93775-0

  • Contact us
©2026 Paessler GmbHTerms & ConditionsPrivacy PolicyImprintReport VulnerabilityDownload & InstallSitemap
-Cisco Monitoring -Cisco Monitoring -Cisco Monitoring


