• Company
    • About Us
    • Press Center
    • Careers
    • Blog
    • IT Knowledge
    • Contact us
  • Contact us
  • Login
 
  • English
    • Deutsch
    • Español
    • Français
    • Italiano
    • Português
Paessler
                    - The Monitoring Experts
  • Products
    • Paessler PRTG
      Paessler PRTGMonitor your whole IT infrastructure
      • PRTG Network Monitor
      • PRTG Enterprise Monitor
      • PRTG Hosted Monitor
      • PRTG UVexplorer
      • PRTG extensionsExtensions for Paessler PRTGExtend your monitoring to a new level
    • Icon Features
      FeaturesExplore all monitoring features
      • Maps & dashboards
      • Alerts & notifications
      • Multiple user interfaces
      • Distributed monitoring
      • Customizable reporting
  • Solutions
    • By TeamFor your organization size
      • Small Business IT
      • Mid-Market IT
      • Enterprise IT
      • MSP Network Monitoring
    • Industries
      By IndustryFor your business sector
      • Industrial
      • Healthcare
      • Energy
      • Government
      • Education
      • Data Center
      • Finance
    • IT Topics
      By Use CaseFor every technical scenario
      • Network Monitoring
      • Server Monitoring
      • OT Monitoring
      • Distributed Monitoring
      • Network Topology Mapping
      • SNMP Monitoring
      • Bandwidth Monitoring
  • Pricing
  • Resources
    • Getting Started
      Getting StartedModules for self-paced learning
    • How-to Guides
      How-to GuidesGet the most out of PRTG
    • Videos & Webinars
      Videos & WebinarsLearn from Paessler experts
    • Case StudiesProven results across industries
    • PRTG Manual
      PRTG ManualFull documentation
    • Knowledge Base
      Knowledge BaseShare community knowledge
    • PRTG Sensor Hub
      PRTG Sensor HubGet sensors, scripts & templates
    • Trainings
      PRTG TrainingLearn how to work with PRTG
  • Partners
    • Icon Handshake
      Become a PartnerFor resellers and channel partners
    • Icon MSP
      Become an MSPDeliver monitoring as a managed service
    • icon partner
      Partner PortalLog in to your partner account
    • Deal Registration
      Deal RegistrationRegister your sales opportunities
    • icon search
      Find a PartnerFind partners selling Paessler products
    • icon technology
      Technology AlliancesSee Paessler technology partnerships
    • Partner HubTools for Your Success
  • Company
    • About Us
    • Press Center
    • Careers
    • Blog
    • IT Knowledge
    • Contact us
  • Contact us
  • Login
  • English
    • Deutsch
    • Español
    • Français
    • Italiano
    • Português
  • Get a quote
  • Free trial
  1. Home>
  2. Company>
  3. Case Studies>
  4. Carbon Drawdown Inititative

Measuring CO₂ in arable soil: how the Carbon Drawdown Initiative monitors climate research with PRTG 

Challenge: Measuring CO₂ absorption in arable soil at scale requires automated sensor data collection

download PDF
Logo Carbon Drawdown Initiative

COMPANY
Carbon Drawdown Initiative 

INDUSTRY
Energy & Utilities

COMPANY SIZE
Small and mid-sized installation

COUNTRY
Germany

SCALE
4 fields in Europe, hundreds of buried sensors, LoRaWAN

Icon Sensor

~40,000 data points collected daily from buried sensors across four European field sites 

Icon monitoring dashboard

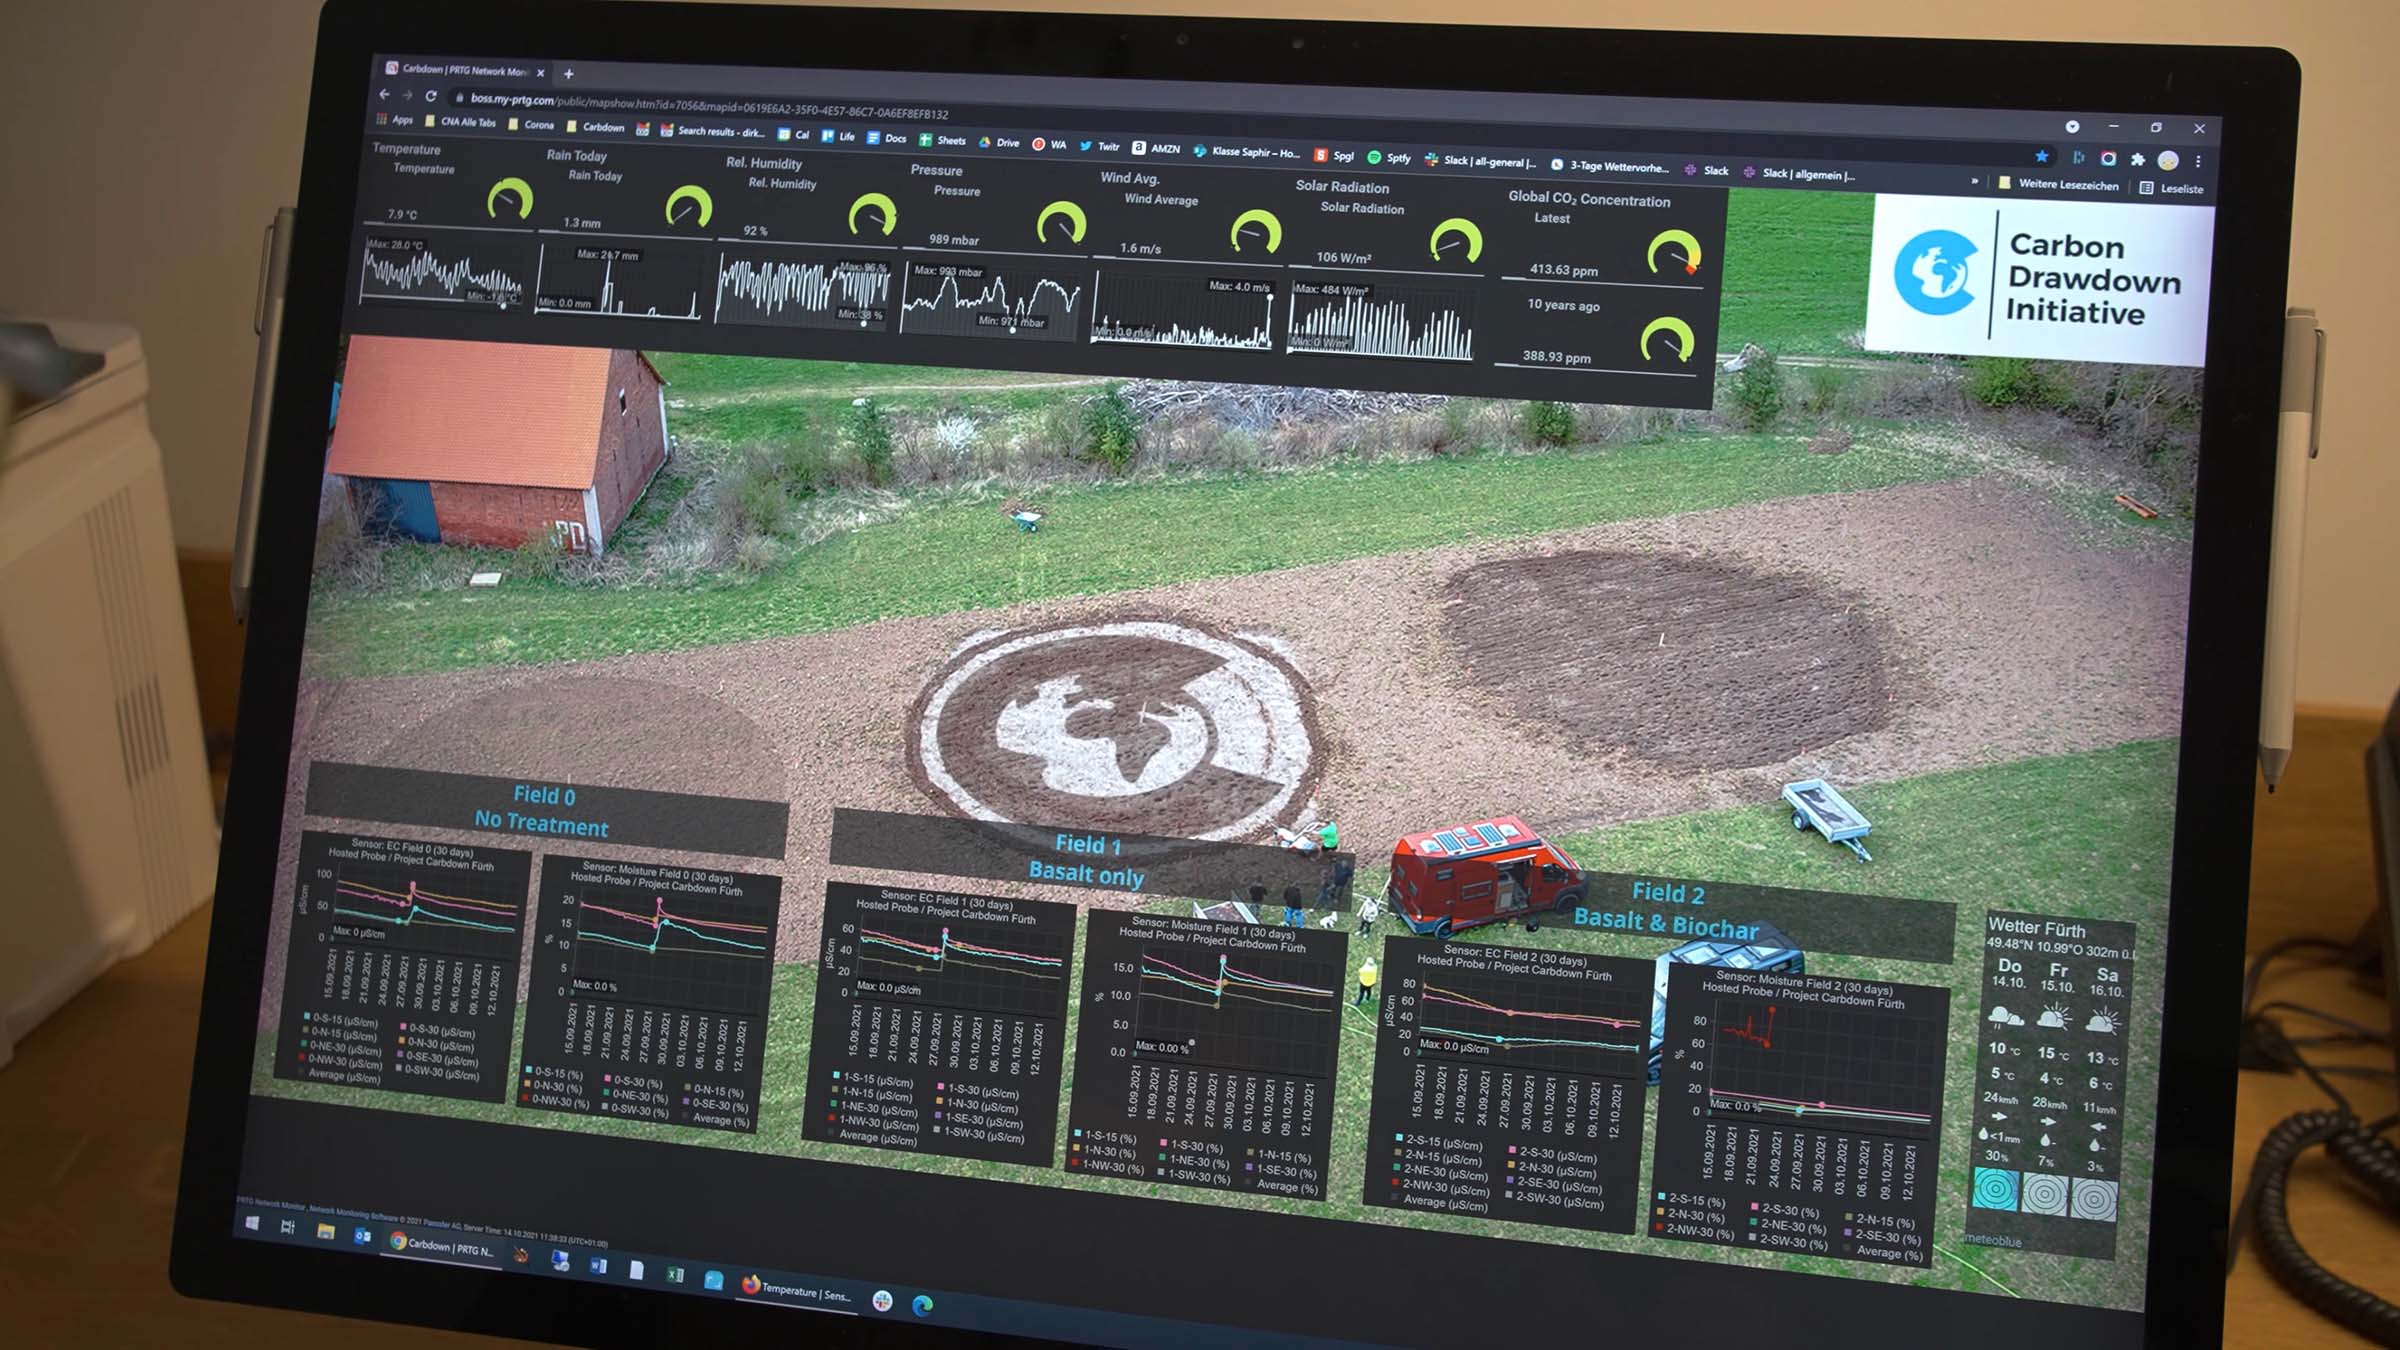
pH, conductivity, moisture, temperature, and solar radiation unified in one PRTG dashboard

Icon Statistics

Full historical data exportable for integration with laboratory analysis

The problem

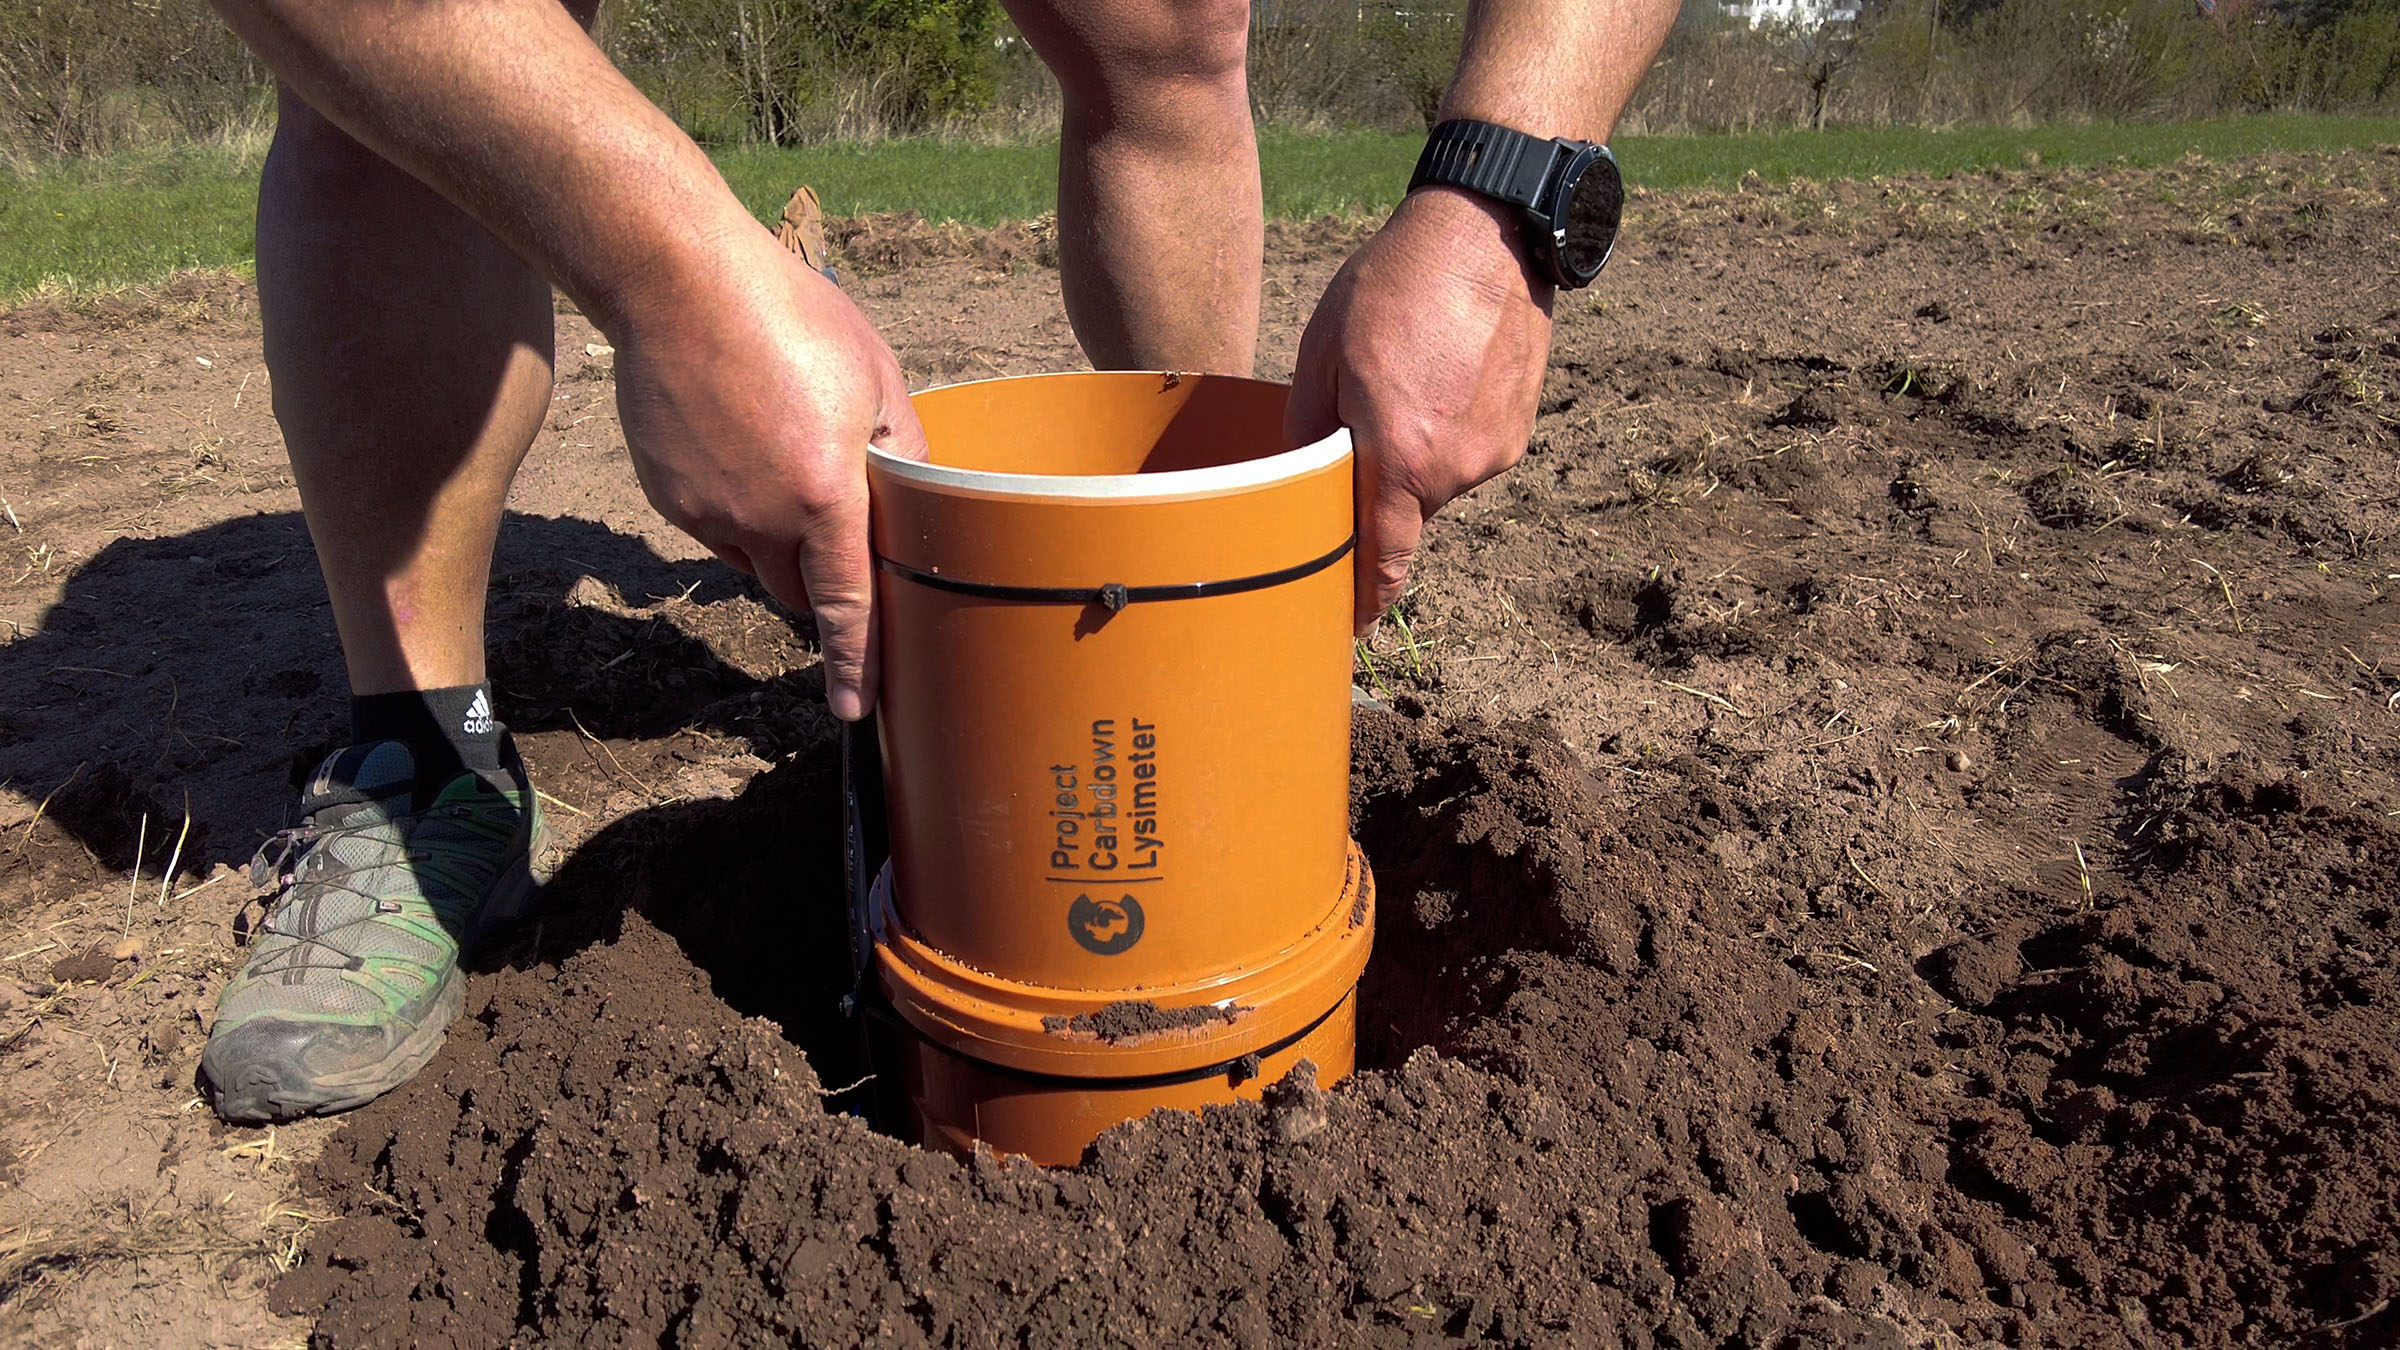
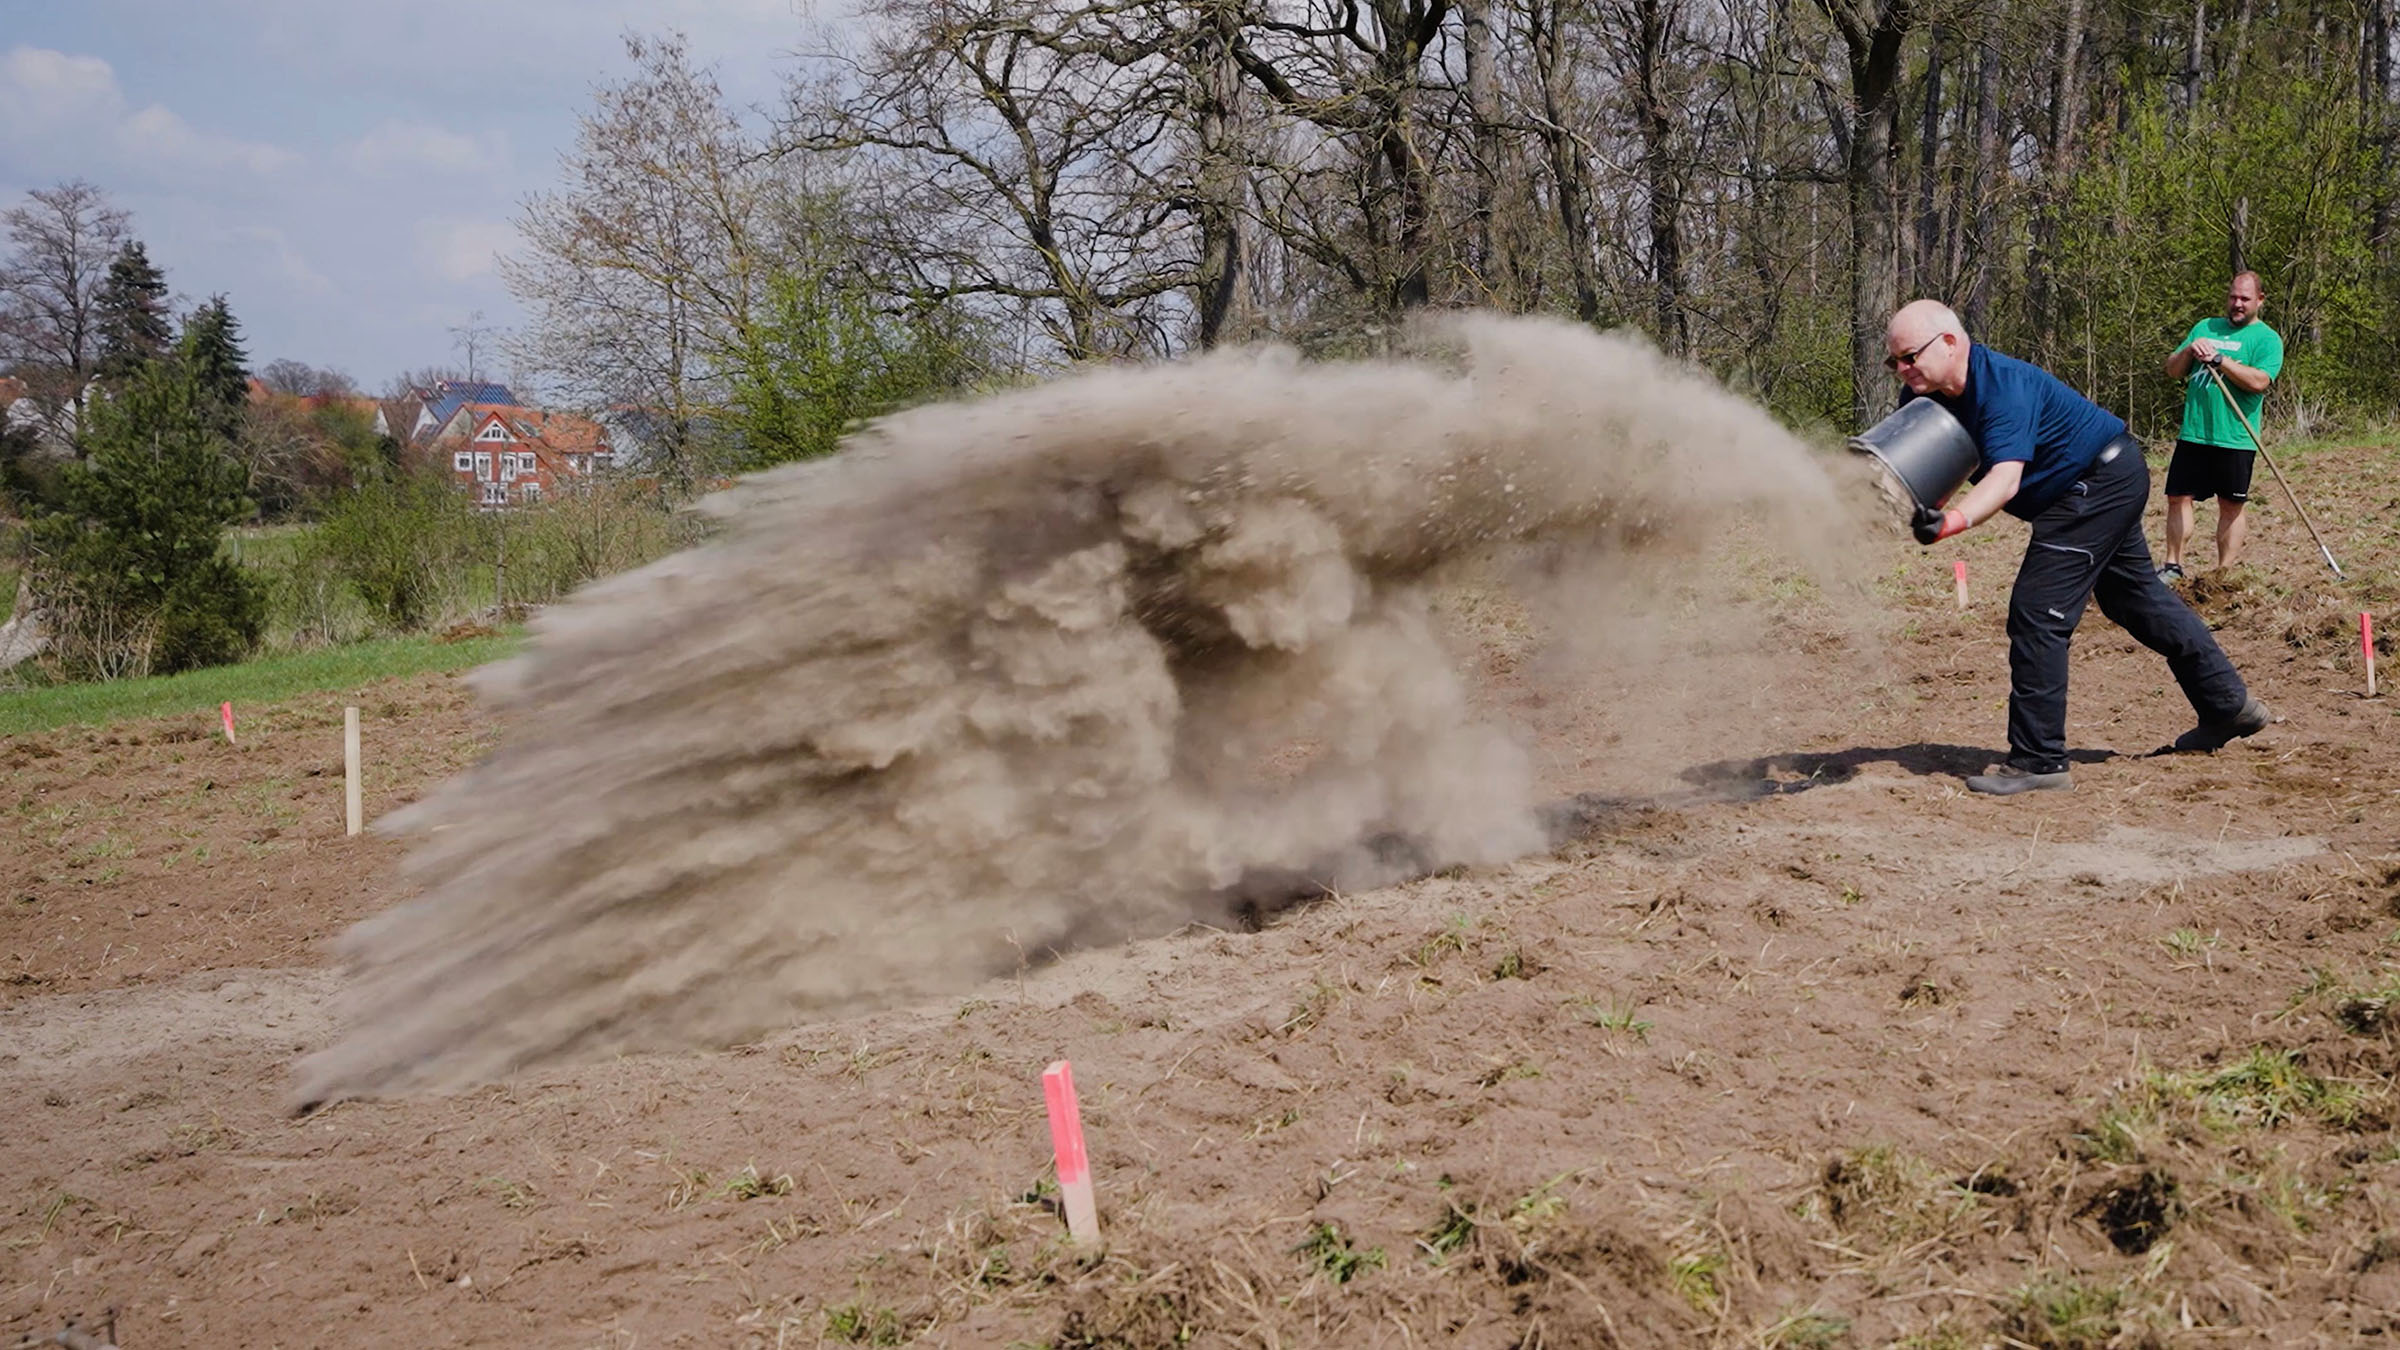
The Carbon Drawdown Initiative is a German research organization focused on negative emissions: removing CO₂ from the atmosphere and storing it long-term. Its flagship Project Carbdown spreads ground basalt and olivine rock on arable fields, where the rock flour reacts with CO₂ in the soil. Natural weathering takes thousands of years; the project explores methods to accelerate this at agricultural scale. 

To prove a field is sequestering carbon and to issue CO₂ removal certificates to farmers, precise and continuous monitoring across many fields is required. Manual laboratory methods cannot scale. 

What changed with PRTG

PRTG Hosted Monitor collects data every twenty minutes from hundreds of sensors buried across four European field sites. Middleware decodes LoRaWAN data streams and forwards them to PRTG. Soil and weather readings are consolidated in one dashboard: pH value, conductivity, moisture, temperature, precipitation, wind speed, solar radiation, and air pressure. 

Data can be exported at any time, including full historical records, for analysis alongside laboratory results. 

PRTG Hosted Monitor was chosen because the other measuring systems are cloud-based, making integration seamless. Approximately 40,000 data points are collected each day. Automated monitoring is the only viable path to scaling the project across hundreds or thousands of fields in the future. 

PRTG Hosted Monitor provides us with a good overview of the reactions and products of those reactions in the soil by displaying soil and weather data from connected sensors. It also incorporates data transmitted from other measuring systems and laboratory data. Initial learnings have already been derived from this data pool: The biggest challenge in measuring weathering – which can easily be done in a laboratory – is the high variability of natural and environmental influences in an outdoor area.

Dirk Paessler, Founder and CEO
Carbon Drawdown Initiative GmbH
PRTG Logo

PRTG Hosted Monitor gives research organizations the scalable data collection platform they need to move from laboratory to field.

free TRIAL
case study Project Carbon Drawdown Ground Basalt
case study carbon drawdown lysimeter
case study carbon drawdown prtg hosted monitor

Discover more monitoring insights and stories

Solution illustration

Solutions for all your monitoring needs

  • NetFlow Monitoring
  • Server Monitoring
  • LAN Monitoring
Content illustration

Powerful stories from the monitoring world

  • Customer success stories - Paessler
  • Who Else Can Remember Netscape? A Brief History of the Internet
  • Easter Eggs: Here's Our List of Internet's Best (Hidden) Gems And ...
Support illustration

Resources to master your monitoring challenges

  • Quick Start Guide
  • How can I use the PRTG Application Programming Interface (API)?
  • How can I move or migrate a PRTG installation to a different system or server?
Explore All Case Studies

Products

  • Paessler PRTG
    Paessler PRTGMonitor your whole IT infrastructure
    • PRTG Network Monitor
    • PRTG Enterprise Monitor
    • PRTG Hosted Monitor
    • PRTG UVexplorer
    • PRTG extensions
      Extensions for Paessler PRTGExtend your monitoring to a new level
  • Icon Features
    FeaturesExplore all monitoring features

Monitoring with PRTG

  • Network monitoring
  • Bandwidth monitoring
  • SNMP monitoring
  • Network mapping
  • Wi-Fi monitoring
  • Server monitoring
  • Network traffic analyzer
  • NetFlow monitoring
  • Syslog server

Useful Links

  • PRTG Manual
  • Knowledge Base
  • Customer Success Stories
  • About Paessler
  • Subscribe to newsletter
  • PRTG Support
  • PRTG Consulting
  • PRTG Feedback & Roadmap

Contact

Paessler GmbH
Thurn-und-Taxis-Str. 14, 
90411 Nuremberg 
Germany

[email protected]

+49 911 93775-0

  • Contact us
©2026 Paessler GmbHTerms & ConditionsPrivacy PolicyImprintTrust CenterDownload & InstallSitemap
Contact Contact Contact