• Company
    • About Us
    • Case Studies
    • Press Center
    • Careers
    • Blog
    • Contact us
  • Contact us
  • Login
 
  • English
    • Deutsch
    • Español
    • Français
    • Italiano
    • Português
Paessler
                    - The Monitoring Experts
  • Products
    • Paessler PRTG
      Paessler PRTGMonitor your whole IT infrastructure
      • PRTG Network Monitor
      • PRTG Enterprise Monitor
      • PRTG Hosted Monitor
      • PRTG UVexplorer
      • PRTG extensionsExtensions for Paessler PRTGExtend your monitoring to a new level
    • Icon Features
      FeaturesExplore all monitoring features
      • Maps & dashboards
      • Alerts & notifications
      • Multiple user interfaces
      • Distributed monitoring
      • Customizable reporting
  • Solutions
    • By TeamFor your organization size
      • Small Business IT
      • Mid-Market IT
      • Enterprise IT
      • MSP Network Monitoring
    • Industries
      By IndustryFor your business sector
      • Industrial
      • Healthcare
      • Government
      • Education
      • Data Center
      • Finance
    • IT Topics
      By Use CaseFor every technical scenario
      • Network Monitoring
      • Server Monitoring
      • OT Monitoring
      • Distributed Monitoring
      • Network Topology Mapping
      • SNMP Monitoring
      • Bandwidth Monitoring
  • Pricing
  • Resources
    • Getting Started
      Getting StartedModules for self-paced learning
    • How-to Guides
      How-to GuidesGet the most out of PRTG
    • Videos & Webinars
      Videos & WebinarsLearn from Paessler experts
    • IT  Knowledge
      IT KnowledgeExpand your IT knowledge
    • PRTG Manual
      PRTG ManualFull documentation
    • Knowledge Base
      Knowledge BaseShare community knowledge
    • PRTG Sensor Hub
      PRTG Sensor HubGet sensors, scripts & templates
    • Trainings
      PRTG TrainingLearn how to work with PRTG
  • Partners
    • Icon Handshake
      Become a PartnerFor resellers and channel partners
    • Icon MSP
      Become an MSPDeliver monitoring as a managed service
    • icon partner
      Partner PortalLog in to your partner account
    • Deal Registration
      Deal RegistrationRegister your sales opportunities
    • icon search
      Find a PartnerFind partners selling Paessler products
    • icon technology
      Technology AlliancesSee Paessler technology partnerships
    • Partner HubTools for Your Success
  • Company
    • About Us
    • Case Studies
    • Press Center
    • Careers
    • Blog
    • Contact us
  • Contact us
  • Login
  • English
    • Deutsch
    • Español
    • Français
    • Italiano
    • Português
  • Get a quote
  • Free trial
  1. Home>
  2. Company>
  3. Case Studies>
  4. Banca Profilo

From Reactive to Proactive: How Banca Profilo Gained Full Visibility with PRTG

Challenge: No dedicated monitoring tool; purely reactive operations in a regulated, zero-downtime environment

download PDF
Logo Company Banca Profilo

COMPANY
Banca Profilo

INDUSTRY
Financial Services

COMPANY SIZE
SMB

COUNTRY
Italy

SCALE
On-premises data center, disaster recovery site, 6 branches

Icon Devices

300 devices monitored across data center, branches, and outsourcer connections

Icon User

Deployed in hours by a team of 4

Icon Alarm

Proactive alerting prevents failures from reaching end users

Icon Protection

Link integrity monitoring guards against typosquatting attacks 

The problem

Banca Profilo is a private and investment bank listed on the Italian stock exchange. It operates as a market maker on IDEM, the Italian derivatives market. When the exchange is open, trading systems must be online. Downtime is a compliance issue.

A 4-person IT team manages an on-premises data center, a disaster recovery site, six branches, and outsourcer connections. Before PRTG, there were no dedicated monitoring tools.

The team responded to failures after they occurred. They tried open-source monitoring, but configuration overhead quickly overwhelmed a team that size.

What changed with PRTG

PRTG deployed in hours. Starting with simple sensors, the team expanded to cover 300 devices across the full infrastructure.

Trading systems are monitored continuously. Branch network devices are tracked for uptime and downtime. Microsoft 365 runs through a dedicated sensor.

Under Bank of Italy and Consob regulations, the bank's website must meet strict availability requirements. PRTG monitors uptime and link integrity, detecting redirect changes that could signal a typosquatting attack.

The annual data center power-down previously required engineers to verify every device on restart. PRTG now flags anomalies automatically, replacing manual walkthroughs with targeted fixes.

Alerts fire via email and Teams. When thresholds near critical levels, the team acts before users are affected.

Adopting PRTG has been like going from being in the dark to being in the light. Before, we had limited visibility into what was happening in the infrastructure and in the network. Now, however, thanks to the comprehensive dashboard and real-time notifications, we receive constant updates on the status of facilities and services, and our way of working has gone from passive to proactive.

Luca Meneghesso, senior IT infrastructure and security specialist
Banca Profilo
PRTG Logo

PRTG monitors networks, servers, cloud services, and websites from one platform. 

free TRIAL
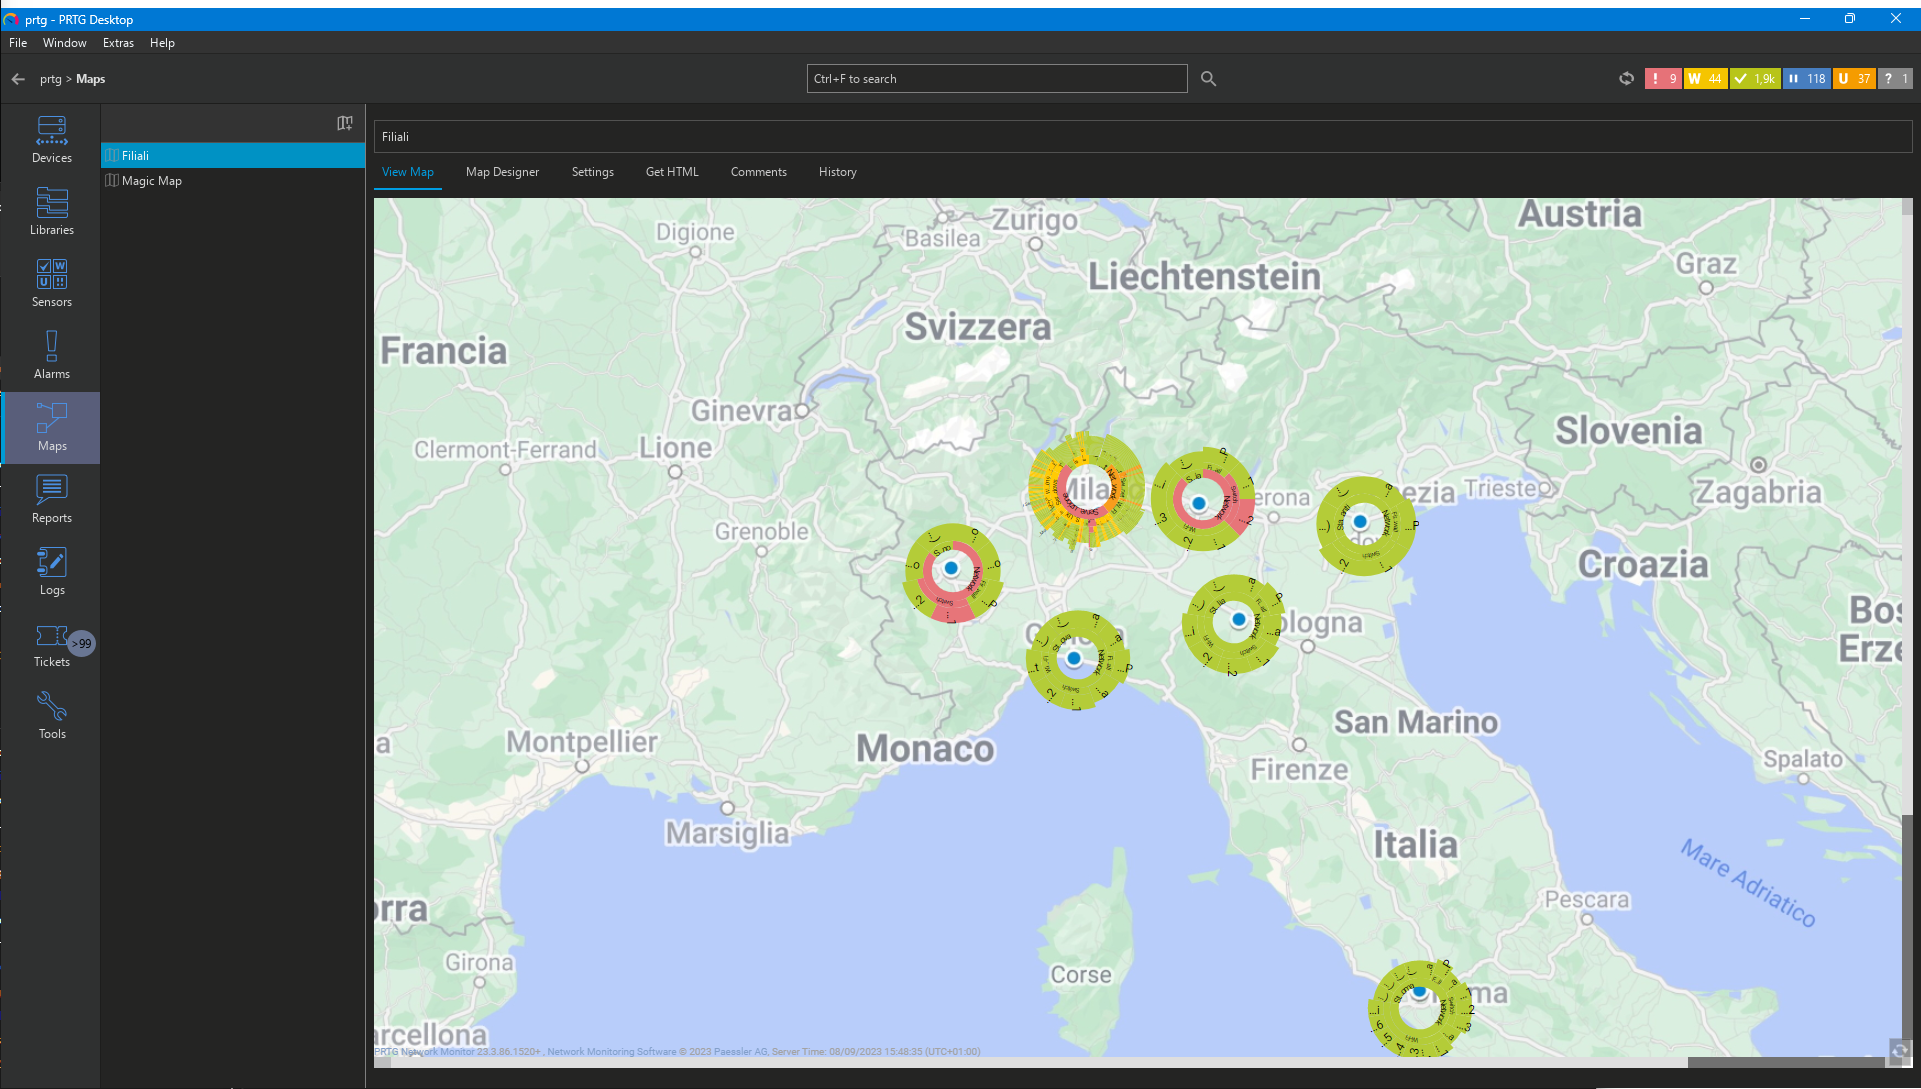
Banca Profilo Screenshot Geomap
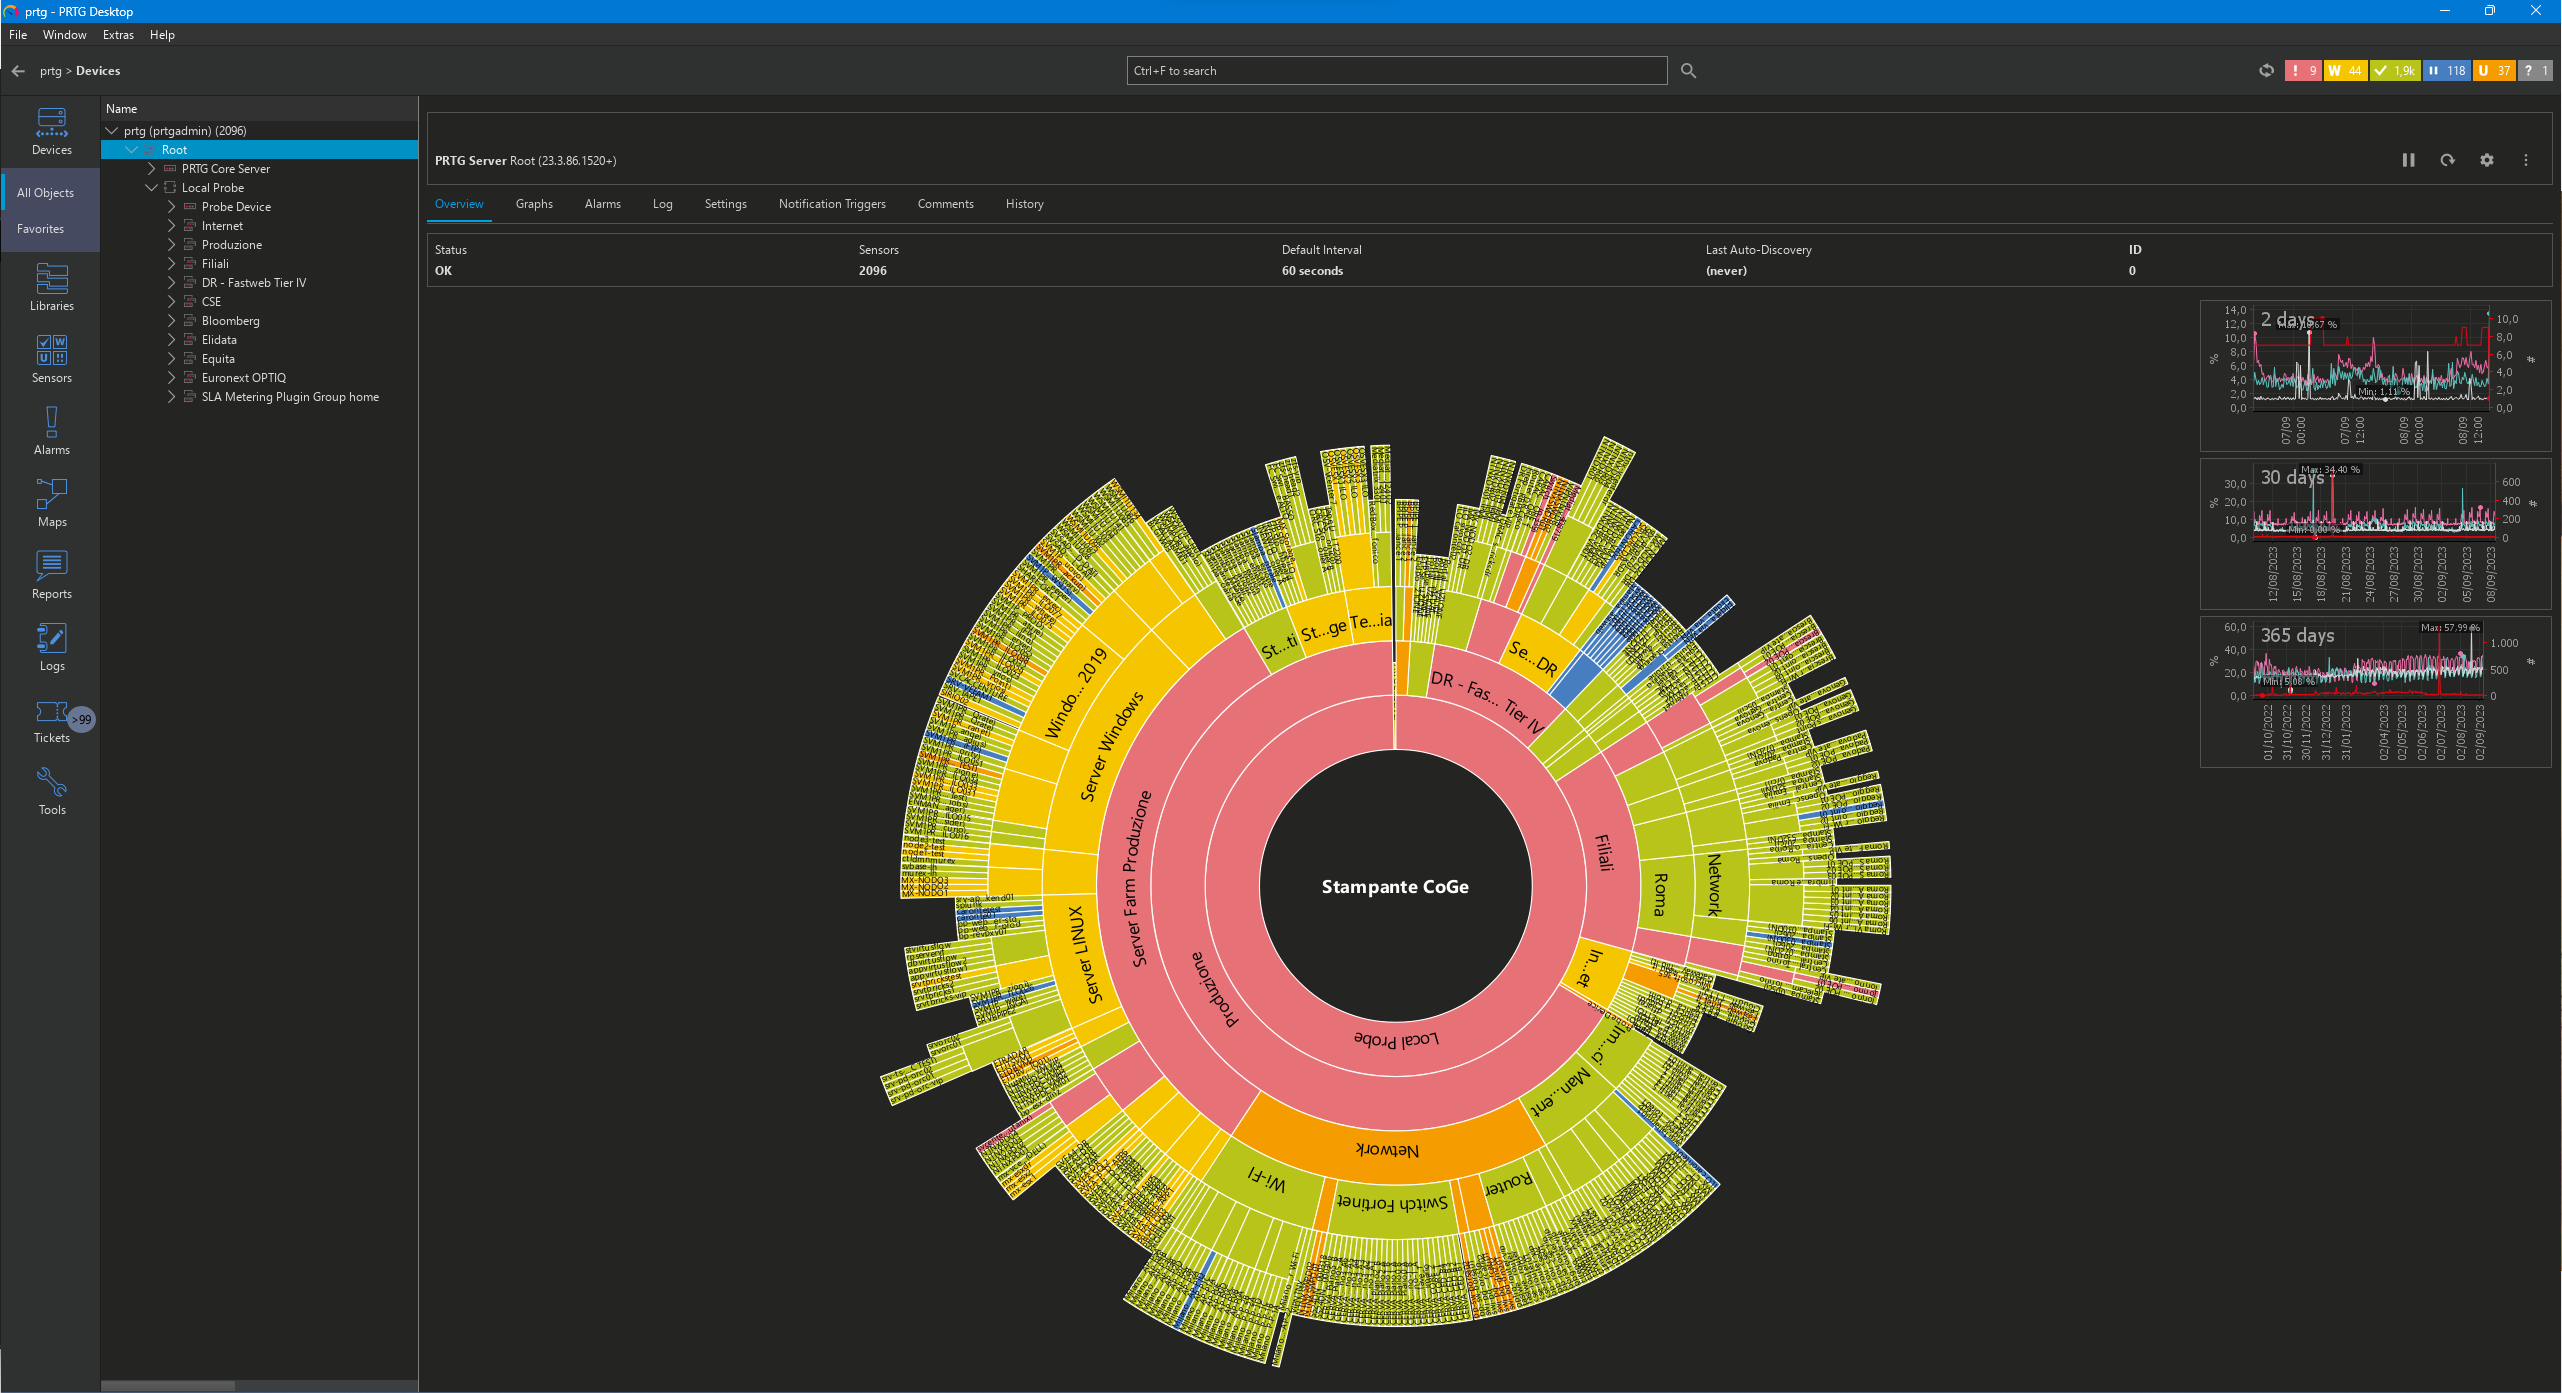
Banca Profilo: screenshot sunburst view

Discover more monitoring insights and stories

Solution illustration

Solutions for all your monitoring needs

  • Finance IT Monitoring
  • Agentless Monitoring
  • Business Process Monitoring
Content illustration

Powerful stories from the monitoring world

  • Customer success stories - Paessler
  • How to enable SNMP on your operating system
  • Video: Making the lives of sysadmins easier
Support illustration

Resources to master your monitoring challenges

  • How can I speed up PRTG—especially for large installations?
  • Device and Sensor Setup
  • I run PRTG on VMware. How can I obtain best performance?
Explore All Case Studies

Products

  • Paessler PRTG
    Paessler PRTGMonitor your whole IT infrastructure
    • PRTG Network Monitor
    • PRTG Enterprise Monitor
    • PRTG Hosted Monitor
    • PRTG UVexplorer
    • PRTG extensions
      Extensions for Paessler PRTGExtend your monitoring to a new level
  • Icon Features
    FeaturesExplore all monitoring features

Monitoring with PRTG

  • Network monitoring
  • Bandwidth monitoring
  • SNMP monitoring
  • Network mapping
  • Wi-Fi monitoring
  • Server monitoring
  • Network traffic analyzer
  • NetFlow monitoring
  • Syslog server

Useful Links

  • PRTG Manual
  • Knowledge Base
  • Customer Success Stories
  • About Paessler
  • Subscribe to newsletter
  • PRTG Support
  • PRTG Consulting
  • PRTG Feedback & Roadmap

Contact

Paessler GmbH
Thurn-und-Taxis-Str. 14, 
90411 Nuremberg 
Germany

[email protected]

+49 911 93775-0

  • Contact us
©2026 Paessler GmbHTerms & ConditionsPrivacy PolicyImprintReport VulnerabilityDownload & InstallSitemap
Paessler PRTG Paessler PRTG Paessler PRTG