• Company
    • About Us
    • Case Studies
    • Press Center
    • Careers
    • Blog
    • Contact us
  • Contact us
  • Login
 
  • English
    • Deutsch
    • Español
    • Français
    • Italiano
    • Português
Paessler
                    - The Monitoring Experts
  • Products
    • Paessler PRTG
      Paessler PRTGMonitor your whole IT infrastructure
      • PRTG Network Monitor
      • PRTG Enterprise Monitor
      • PRTG Hosted Monitor
      • PRTG UVexplorer
      • PRTG extensionsExtensions for Paessler PRTGExtend your monitoring to a new level
    • Icon Features
      FeaturesExplore all monitoring features
      • Maps & dashboards
      • Alerts & notifications
      • Multiple user interfaces
      • Distributed monitoring
      • Customizable reporting
  • Solutions
    • By TeamFor your organization size
      • Small Business IT
      • Mid-Market IT
      • Enterprise IT
      • MSP Network Monitoring
    • Industries
      By IndustryFor your business sector
      • Industrial
      • Healthcare
      • Government
      • Education
      • Data Center
      • Finance
    • IT Topics
      By Use CaseFor every technical scenario
      • Network Monitoring
      • Server Monitoring
      • OT Monitoring
      • Distributed Monitoring
      • Network Topology Mapping
      • SNMP Monitoring
      • Bandwidth Monitoring
  • Pricing
  • Resources
    • Getting Started
      Getting StartedModules for self-paced learning
    • How-to Guides
      How-to GuidesGet the most out of PRTG
    • Videos & Webinars
      Videos & WebinarsLearn from Paessler experts
    • IT  Knowledge
      IT KnowledgeExpand your IT knowledge
    • PRTG Manual
      PRTG ManualFull documentation
    • Knowledge Base
      Knowledge BaseShare community knowledge
    • PRTG Sensor Hub
      PRTG Sensor HubGet sensors, scripts & templates
    • Trainings
      PRTG TrainingLearn how to work with PRTG
  • Partners
    • Icon Handshake
      Become a PartnerFor resellers and channel partners
    • Icon MSP
      Become an MSPDeliver monitoring as a managed service
    • icon partner
      Partner PortalLog in to your partner account
    • Deal Registration
      Deal RegistrationRegister your sales opportunities
    • icon search
      Find a PartnerFind partners selling Paessler products
    • icon technology
      Technology AlliancesSee Paessler technology partnerships
    • Partner HubTools for Your Success
  • Company
    • About Us
    • Case Studies
    • Press Center
    • Careers
    • Blog
    • Contact us
  • Contact us
  • Login
  • English
    • Deutsch
    • Español
    • Français
    • Italiano
    • Português
  • Get a quote
  • Free trial
  1. Home>
  2. Company>
  3. Case Studies>
  4. DKV Mobility

Fleet telemetry runs 24/7: how DKV Mobility monitors microservices at scale with PRTG

Challenge: Growing complexity across telemetry and microservices, no time to build or maintain a custom monitoring tool

download PDF
Logo Company DKV Mobility

COMPANY
DKV Mobility

INDUSTRY
Travel & Transportation

COMPANY SIZE
Enterprise

COUNTRY
Germany

SCALE
Cloud-based fleet mobility platform, microservices architecture, developer-led IT team

Icon Sensor

3,000 to 4,000 custom PowerShell script sensors monitoring microservices

Icon Restart

Automated restarts resolve 99% of incidents without manual intervention

Icon Monitoring

Redundant monitoring via sensor distribution across multiple servers

The problem

DKV Mobility's DKV LIVE platform handles fuel management, live vehicle tracking, and route planning for fleets across Europe. A device in each vehicle streams telemetry data to the cloud continuously. That platform must be available around the clock.

The team is developer-led, not traditional ops. They evaluated Grafana, Prometheus, Nagios, and Splunk. Building a custom tool was possible, but maintenance would consume time they didn't have.

They needed something that covered standard infrastructure out of the box and supported custom scripts for microservices.

What changed with PRTG

PRTG delivered both. Preconfigured sensors handle routers, firewalls, switches, databases, and servers. For everything custom, the team wrote PowerShell scripts as sensors, covering Galera, Cassandra, Docker, and MQTT environments.

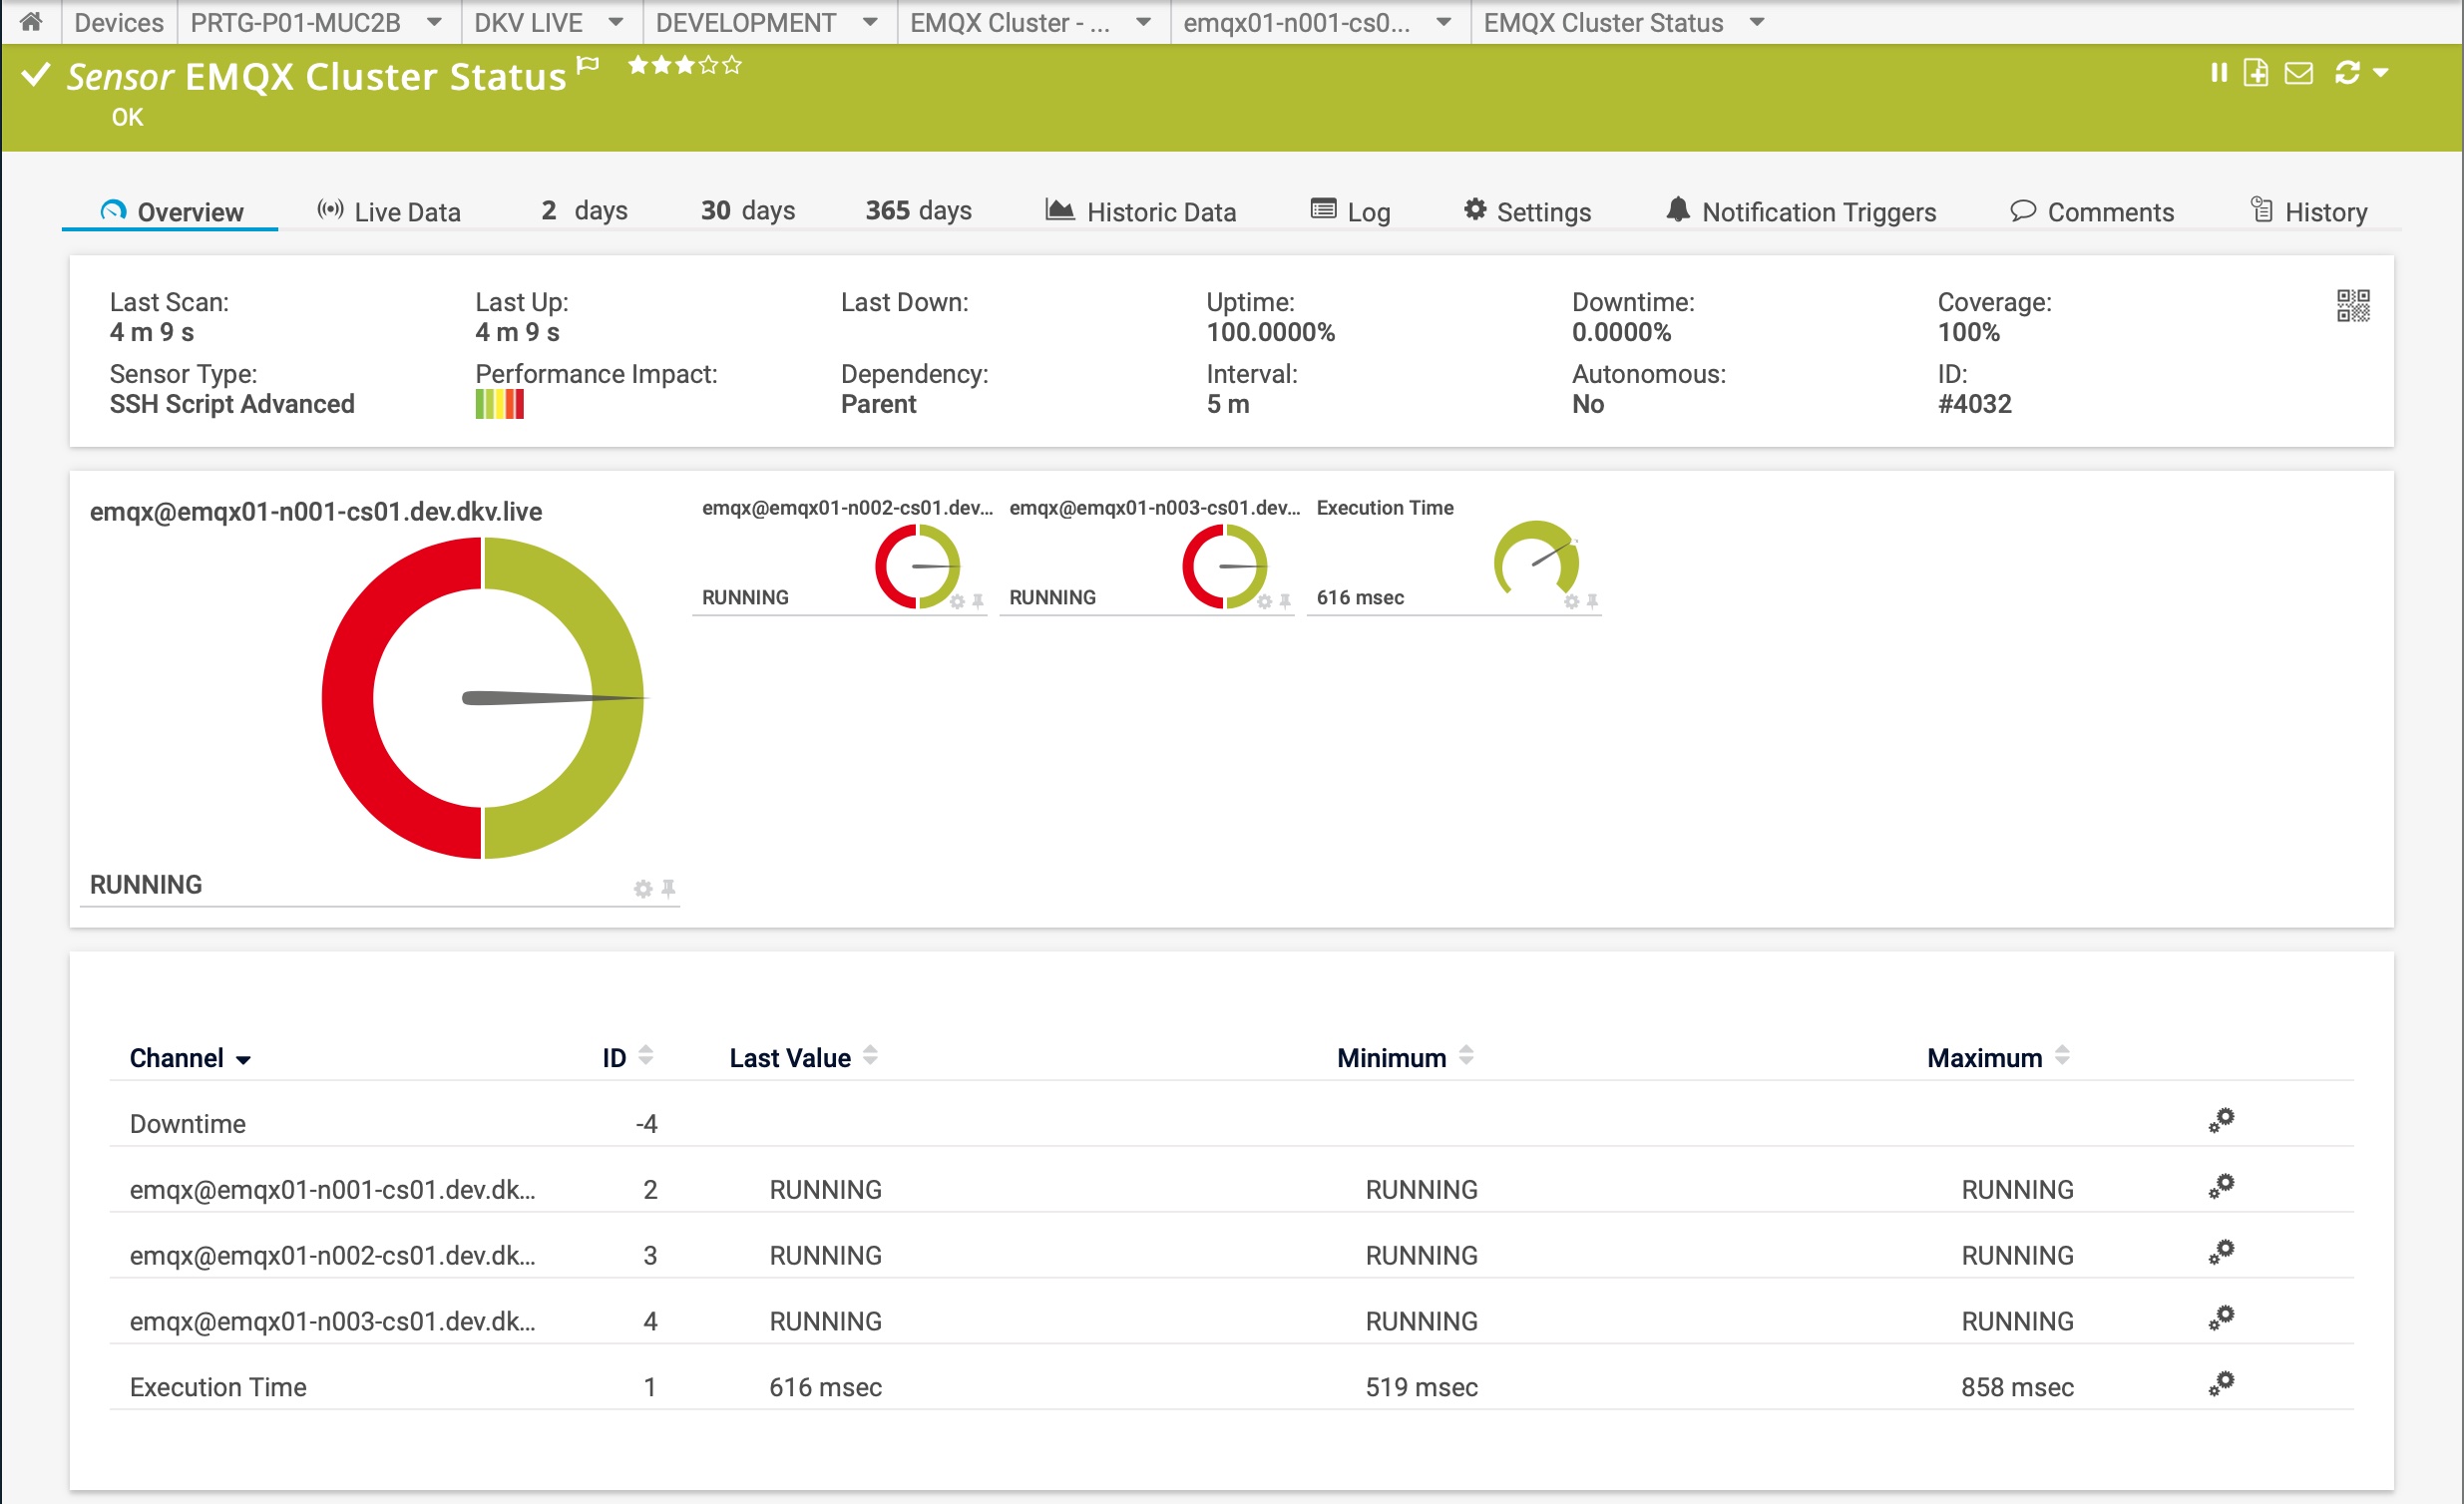
The MQTT backend, where DKV LIVE Boxes communicate with the platform, runs through PRTG MQTT sensors. New microservices expose status pages that PRTG queries automatically.

When something fails, PRTG triggers a restart script. That resolves the issue 99% of the time. If not, a push notification reaches the on-call engineer immediately.

One central dashboard covers infrastructure, network, microservices, and telemetry at a glance. Help desk gets a detailed view; management gets a condensed one. Both built by drag-and-drop.

As needs grew, the team moved to PRTG Enterprise Monitor, distributing script sensors across servers to avoid performance bottlenecks.

So far, our experience with Paessler support has been great – however, we’ve only had one or two minor questions. The software is so easy to use and the documentationso thorough that we simply don’t need a lot of support.

Christian Rossner, Head of the DKV LIVE team
DKV Mobility Live
PRTG Logo

PRTG gives developer-led teams like DKV Mobility the flexibility to monitor any infrastructure without building tooling from scratch.

CONTACT SALES
case study dkv mobility
case study dkv mobility multi server dashboard
case study dkv mobility mqtt emqx cluster state

Discover more monitoring insights and stories

Solution illustration

Solutions for all your monitoring needs

  • Network Telemetry
  • Bandwidth Monitoring
  • Network Mapping
Content illustration

Powerful stories from the monitoring world

  • Customer success stories - Paessler
  • DKV Mobility Live secures its telemetry solution with PRTG
  • Easy ways to quickly test your bandwidth
Support illustration

Resources to master your monitoring challenges

  • Device and Sensor Setup
  • I run PRTG on VMware. How can I obtain best performance?
  • How can I speed up PRTG—especially for large installations?
Explore All Case Studies

Products

  • Paessler PRTG
    Paessler PRTGMonitor your whole IT infrastructure
    • PRTG Network Monitor
    • PRTG Enterprise Monitor
    • PRTG Hosted Monitor
    • PRTG UVexplorer
    • PRTG extensions
      Extensions for Paessler PRTGExtend your monitoring to a new level
  • Icon Features
    FeaturesExplore all monitoring features

Monitoring with PRTG

  • Network monitoring
  • Bandwidth monitoring
  • SNMP monitoring
  • Network mapping
  • Wi-Fi monitoring
  • Server monitoring
  • Network traffic analyzer
  • NetFlow monitoring
  • Syslog server

Useful Links

  • PRTG Manual
  • Knowledge Base
  • Customer Success Stories
  • About Paessler
  • Subscribe to newsletter
  • PRTG Support
  • PRTG Consulting
  • PRTG Feedback & Roadmap

Contact

Paessler GmbH
Thurn-und-Taxis-Str. 14, 
90411 Nuremberg 
Germany

[email protected]

+49 911 93775-0

  • Contact us
©2026 Paessler GmbHTerms & ConditionsPrivacy PolicyImprintReport VulnerabilityDownload & InstallSitemap
-Network Device Scanner -Network Device Scanner -Network Device Scanner