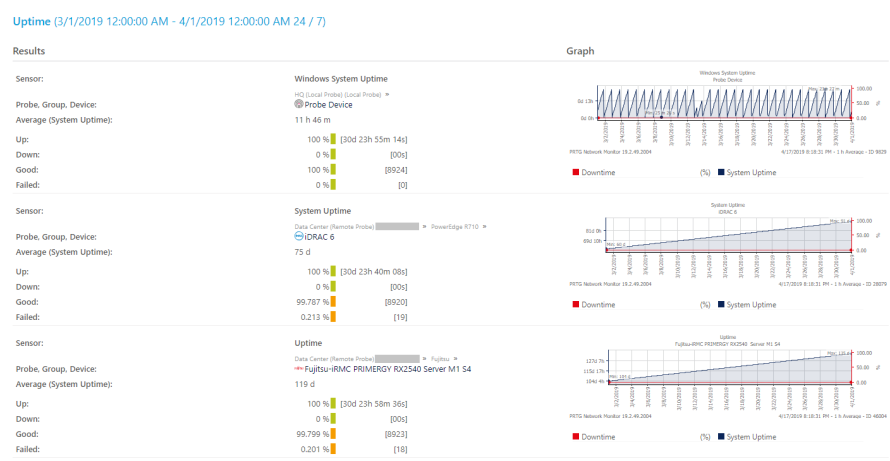
Your PRTG installation is up and running. You built and configured the device tree and organized all monitoring objects in accordance with your network infrastructure. You set up email, SMS, and push notifications and configured the respective notification triggers so that PRTG alerts you if there are issues.
Now the CIO also wants regular reports about the uptime and availability of a critical application or service that you provide to end users. The CIO plans to share these reports with the rest of the executive team as well, so that you need to keep the reports high level. Where do you start?
Get full visibility with real-time dashboards, alerts, and customizable sensors
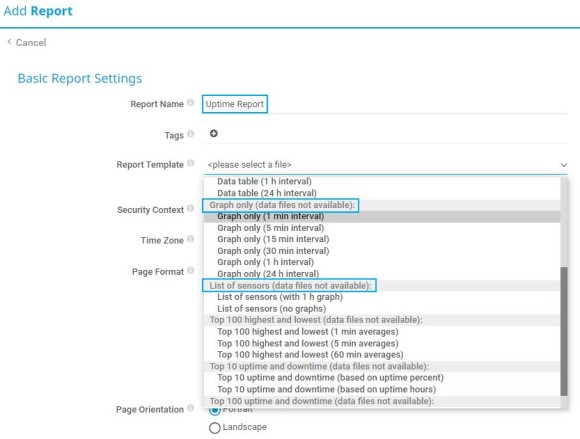
Take the following steps to create a new report:
Reports show monitoring results based on sensor data that PRTG collected during a specific time span. Take the following steps to include sensors in the report by tag and to define the report period:
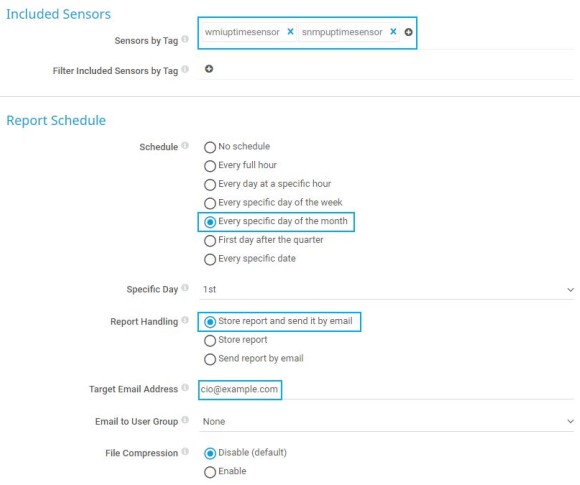
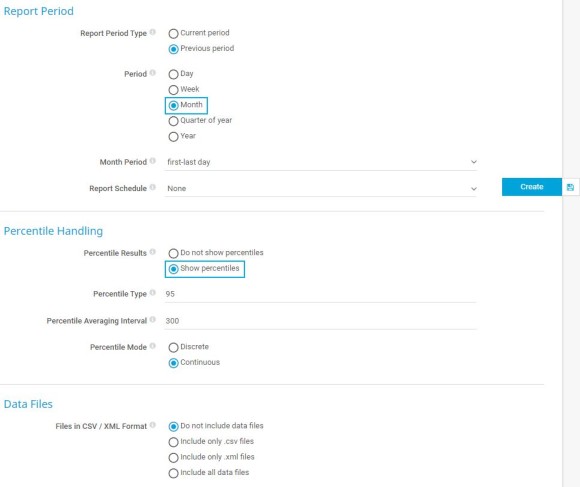
Next, define the time span that the report covers as well as additional settings, for example, define if you want to include percentiles and data files in your report.
Custom alerts and data visualization let you quickly identify and prevent all kinds of issues
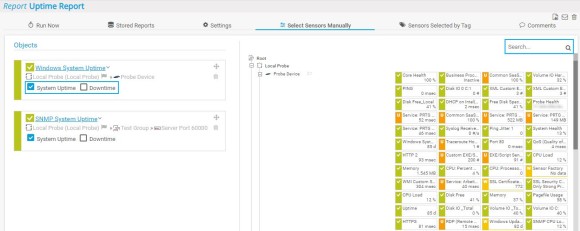
After you created the report, the Select Sensors Manually tab opens where you can manually add or remove entire probes, groups, devices, or individual sensors in addition to the sensors that you selected by tag.
You can search for specific sensors or keywords in the search box on the top-right corner of the device tree. Use drag-and-drop to add sensors to your report on the left.
If you select sensors manually, you have the option to focus only on specific channels of a selected sensor. Enable or disable the check box in front of a channel name to include or exclude the channel.
Go to the Sensors Selected by Tag tab to see a list of all sensors that you added by tag. To change tags, go back to the Settings tab.
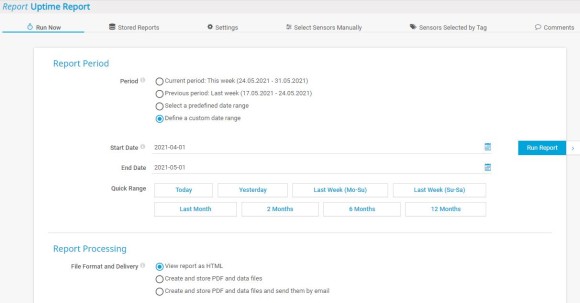
Now you can directly run the actual report. Take the following steps:
