- English
- Deutsch
- Español
- Français
- Italiano
- Português
Good remote desktop monitoring software does more than check if a port responds. The full functionality covers the entire stack your users depend on: service availability, host resource headroom, Windows service states, patch compliance, and the network underneath it all. When any of those layers goes wrong, sessions degrade or drop, and your IT Management team is the last to know.
Paessler PRTG monitors remote desktop environments agentlessly from a probe. Depending on your network segmentation and sites, you can use additional remote probes to reach on‑prem, hybrid, and cloud-hosted Windows systems. That includes RDP services and Terminal Services (RDSH), Windows service states such as TermService and related dependencies, CPU and RAM on Windows Server RDS hosts and workstations, Windows Update status via Microsoft Update or WSUS, and network interfaces via SNMP.

RDP availability is easy to take for granted until a session stops responding. PRTG's RDP sensor performs regular checks to verify RDP reachability and response time. If availability degrades or the endpoint stops responding, you get an alert so you can investigate the RDP layer early before it becomes a complaint.
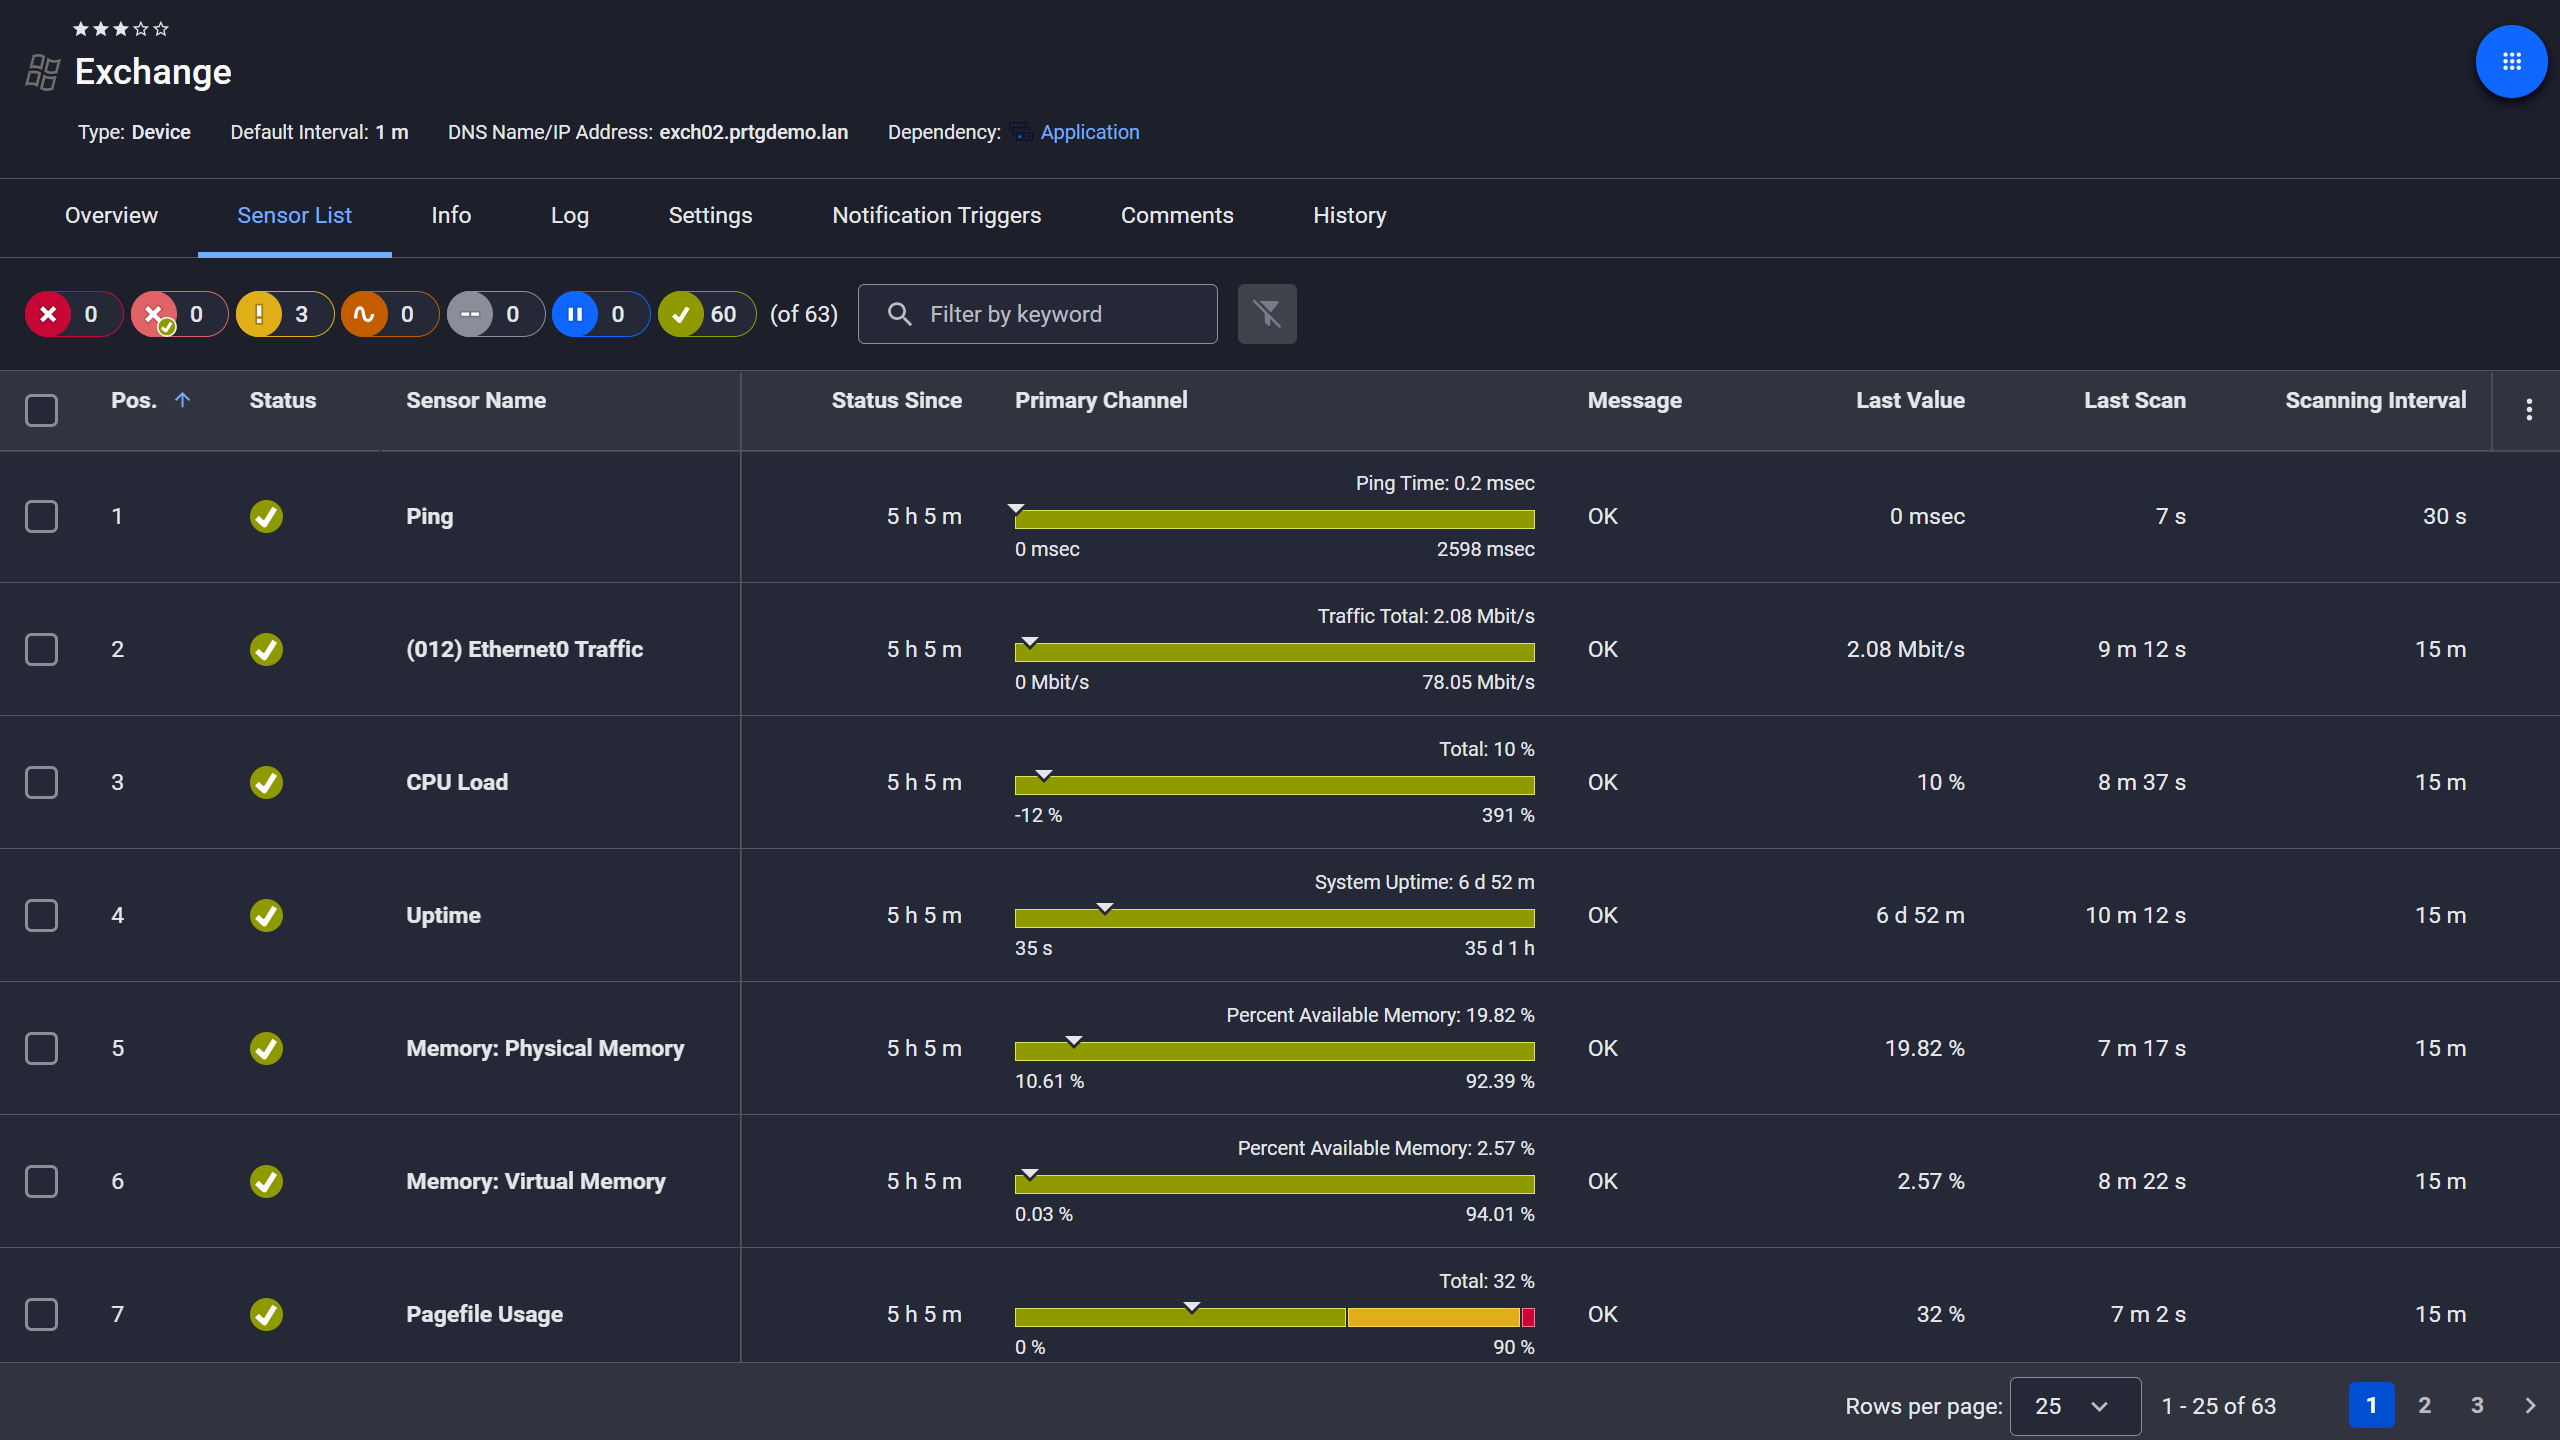
Exchange server, fully under control
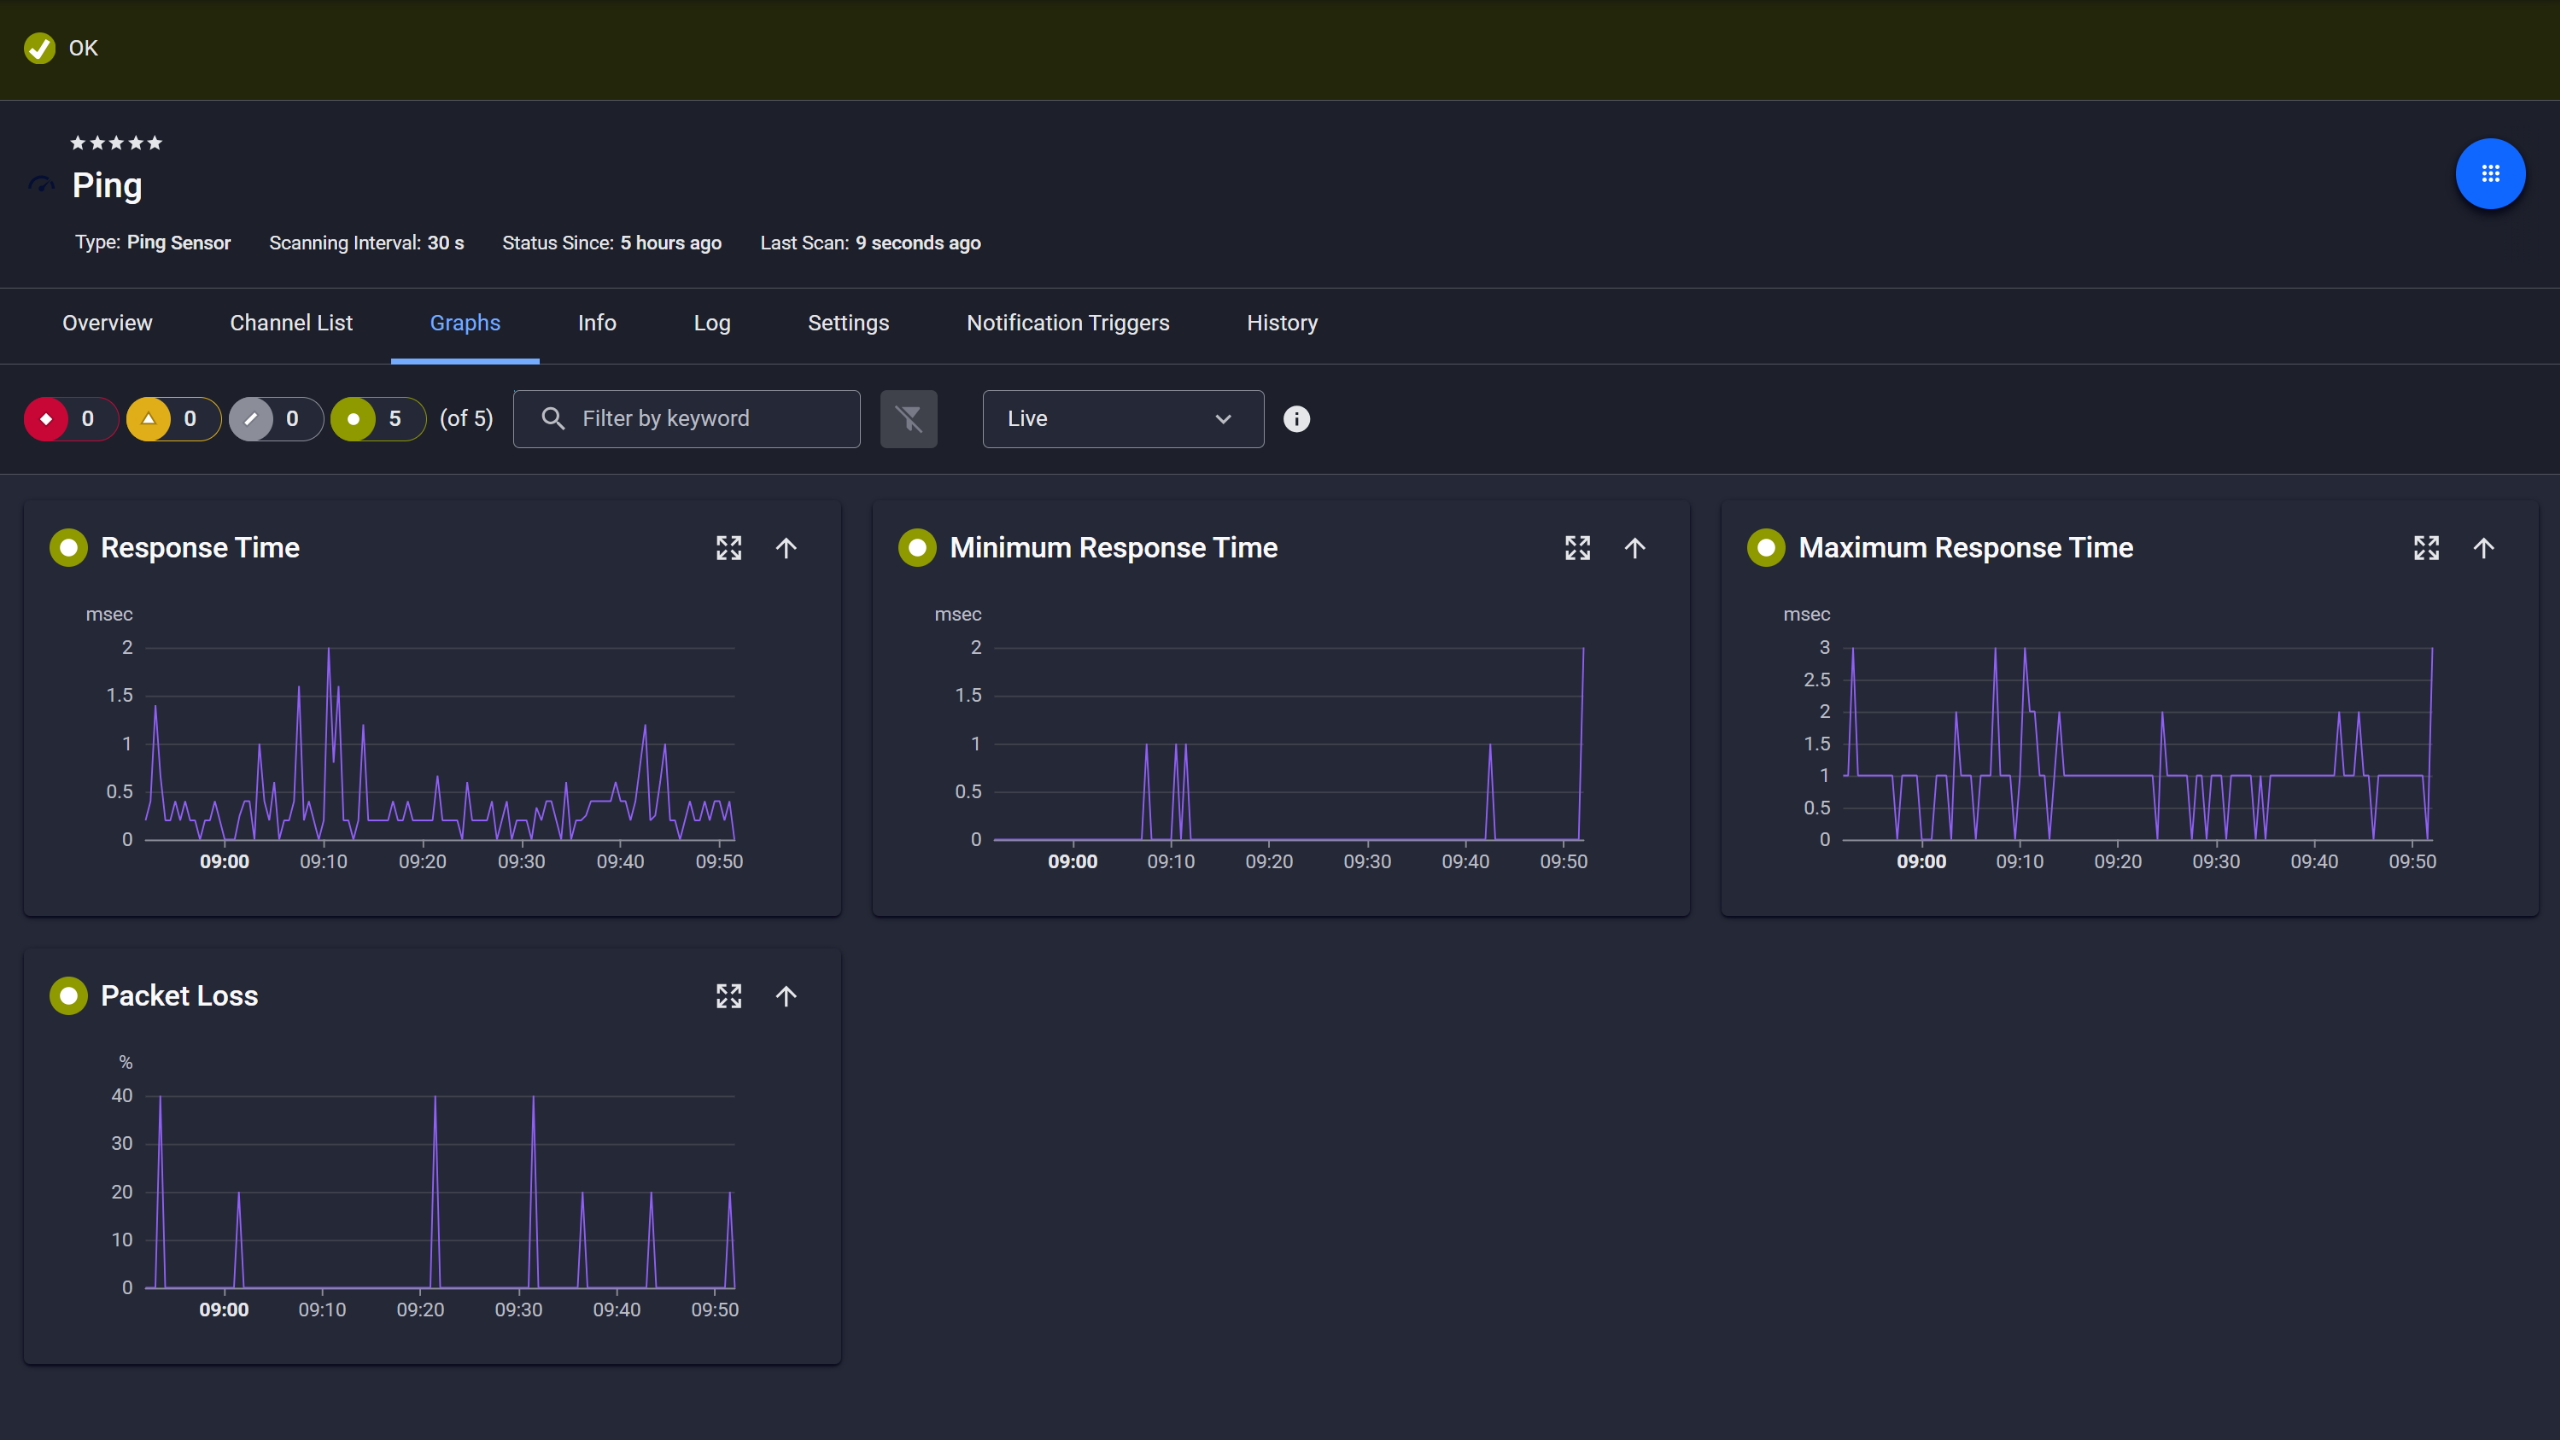
Ping response and packet loss

Live graphs, real-time performance data
RDS host saturation affects every active session at once, making capacity headroom one of the most important things to track on shared remote desktop infrastructure. PRTG monitors CPU load via the Windows CPU Load sensor and memory via WMI on your Windows Server RDS hosts, Terminal Servers, and workstations across Windows operating systems. Configurable thresholds alert you when the server is approaching its limits, before sessions actually degrade.
Start monitoring your infrastructure in minutes. No professional services, no complex configuration, no risk.
Keeping patch status current across distributed remote computers is straightforward when you have continuous visibility. The Windows Updates Status (PowerShell) sensor queries each remote computer via Remote PowerShell and reports exactly what's installed, what's missing, and what's hidden, categorized by severity against Microsoft Update or your local WSUS server.
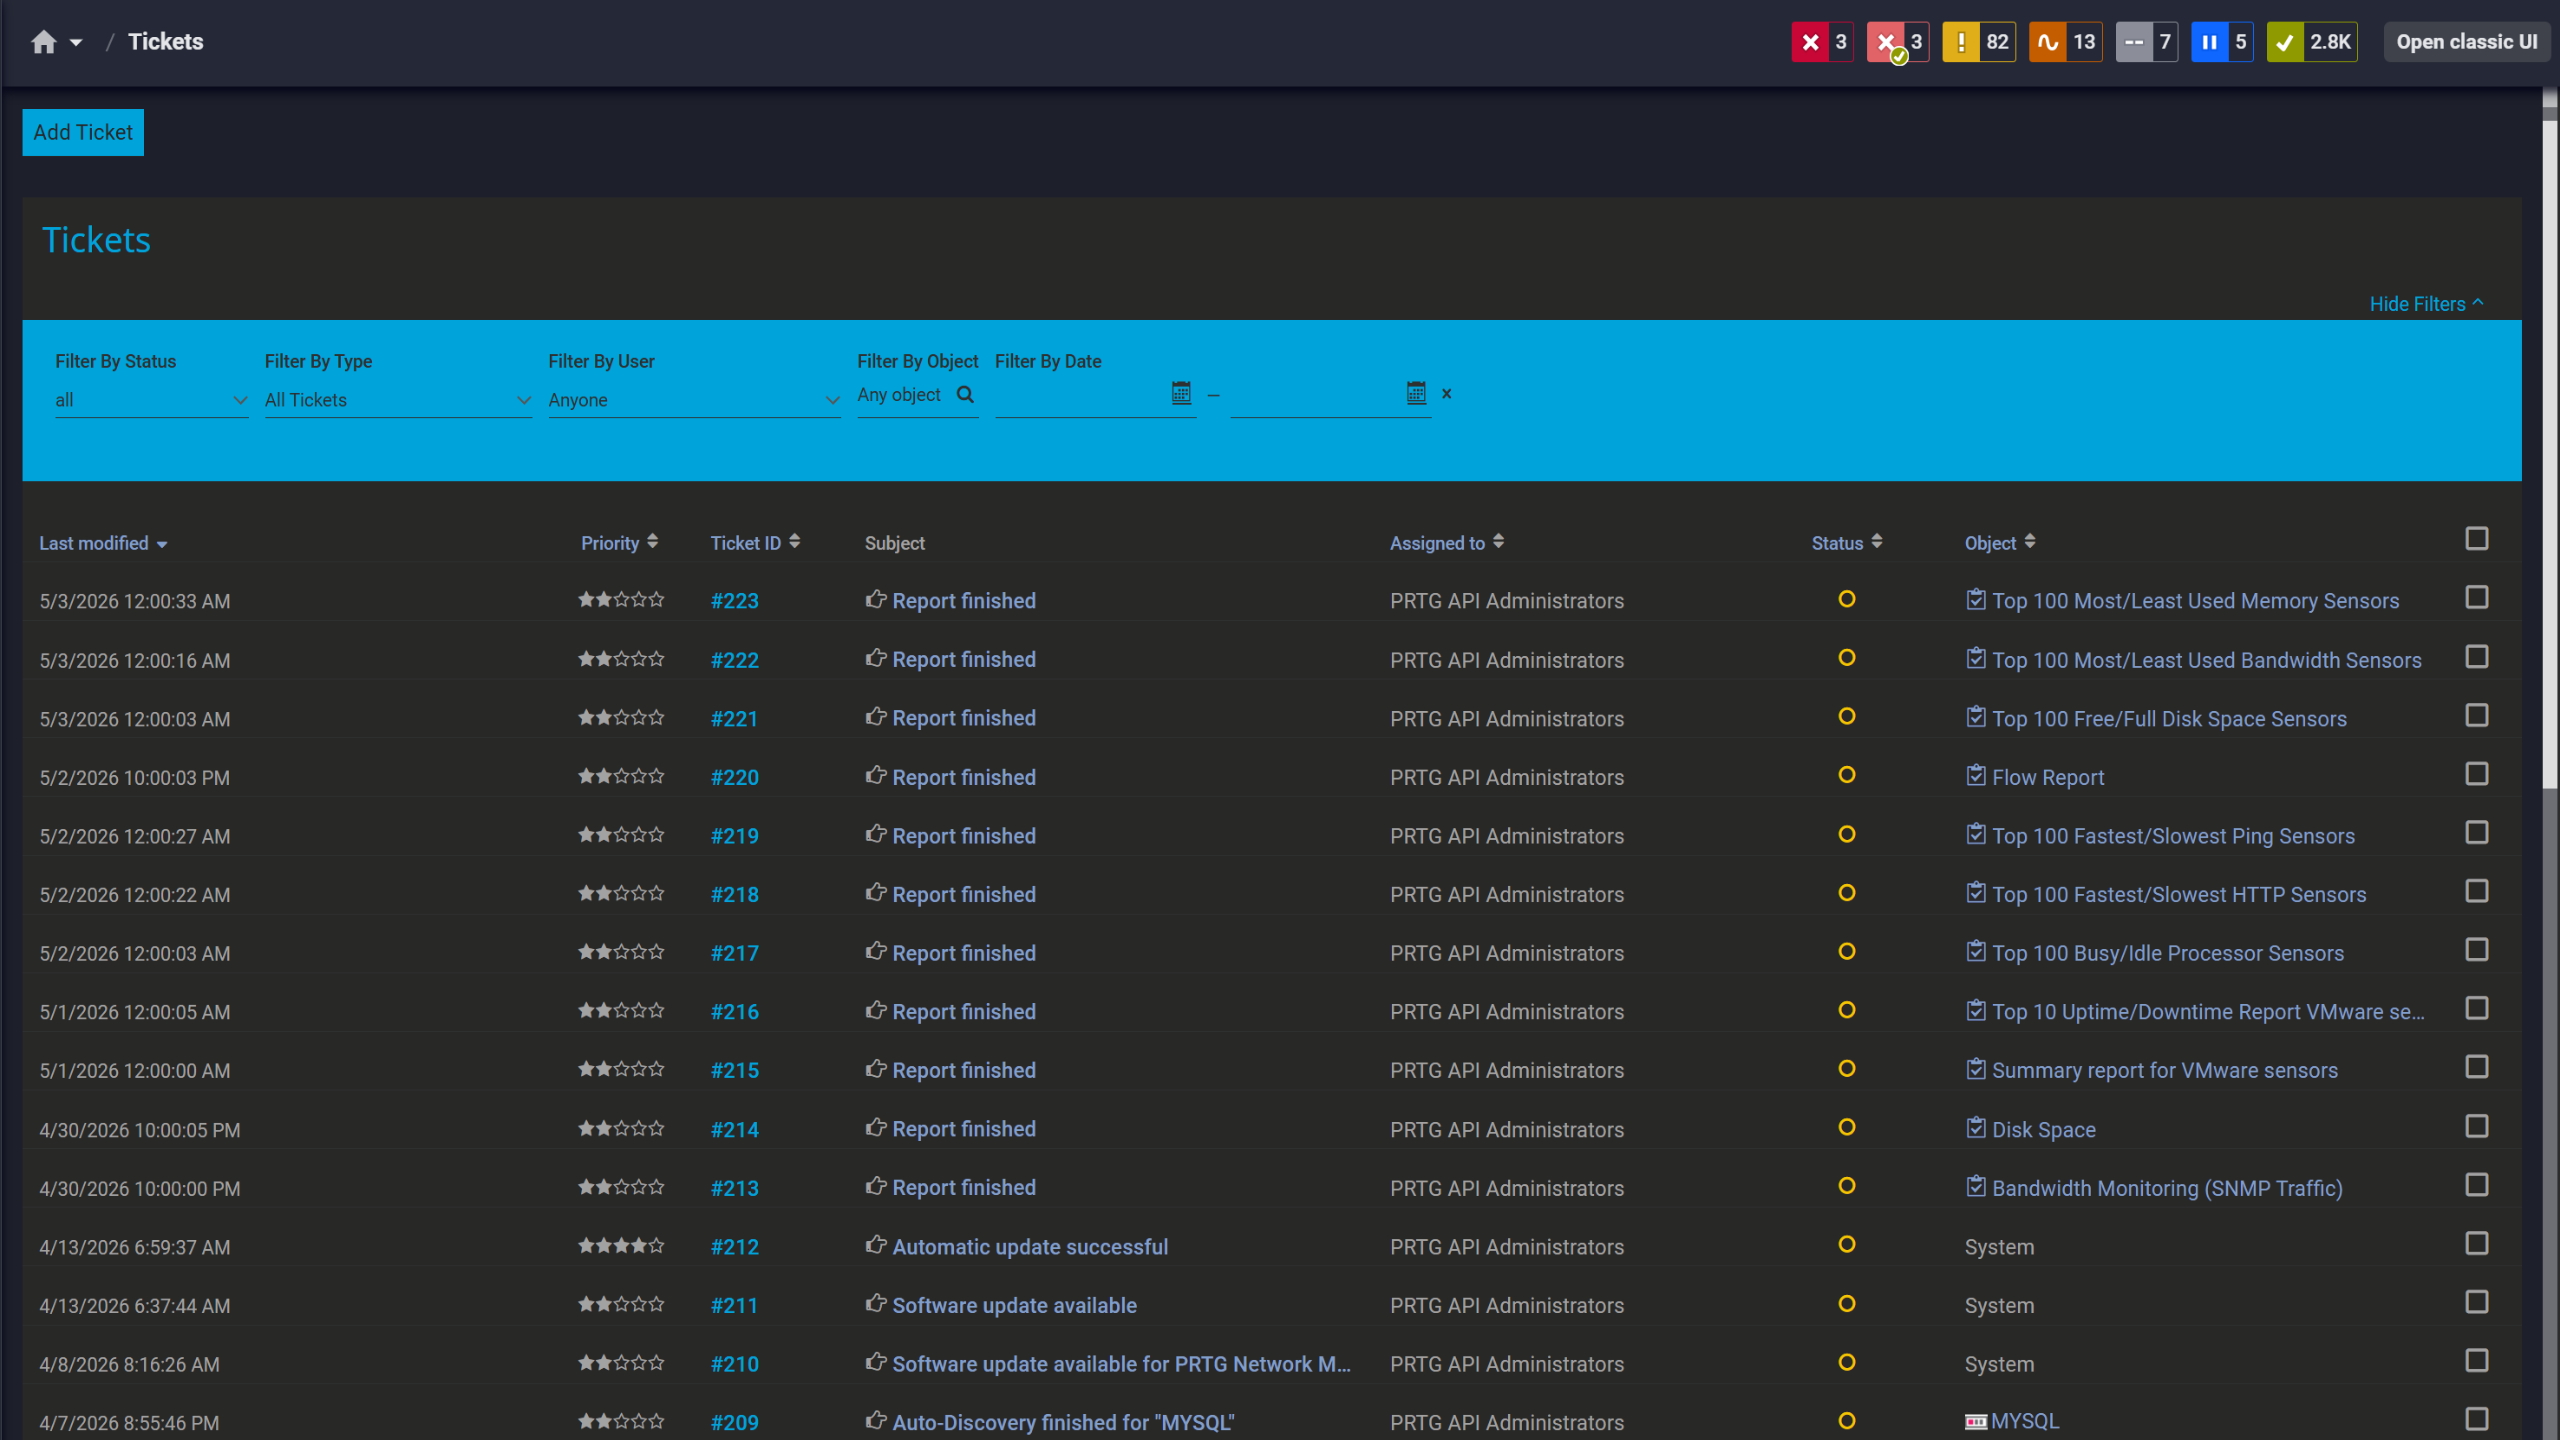
Tickets keep your team aligned

Scheduled reports, always on time

Full device list, instant overview
Sluggish sessions are one of the most common RDP complaints, and the right data makes them diagnosable fast. PRTG's SNMP Traffic sensor monitors bandwidth utilization per network interface. Pair that with CPU and RAM metrics from your RDS host, and you have the data to optimize your troubleshooting, pinpointing which layer the issue is on without the back-and-forth.
PRTG uses agentless network monitoring methods to cover Windows services, remote access connectivity, and network infrastructure from a single probe, with no software to deploy on every monitored system.
TASK | Without a monitoring tool Without a monitoring tool | With PRTG With PRTG |
|---|---|---|
RDP availability check | Without a monitoring tool Waiting for user reports or manual port checks | With PRTG Regular automated checks, immediate alert on first failure |
Patch status across remote computers | Without a monitoring tool Logging into machines individually or running ad hoc scripts | With PRTG Centralized per-device report, updated on schedule, sorted by severity |
RDS host resource load | Without a monitoring tool Checking Task Manager when performance drops | With PRTG Continuous CPU/RAM tracking with proactive threshold alerts |
Windows service states | Without a monitoring tool Discovered only when RDP stops working | With PRTG Alert when a critical service stops, while the host is still reachable |
Network link saturation | Without a monitoring tool Separate tool or manual interface queries | With PRTG SNMP-based bandwidth data alongside all other network monitoring metrics |
Choose the PRTG Network Monitor subscription that's best for you.
| License Name | License description | Price | License Details | Get started | Pricing Details | |
|---|---|---|---|---|---|---|
| PRTG 500 | $200 | per month paid annually | Buy nowBuy now | Enough to monitor multiple aspects of 50 devices | ||
| PRTG 1000 | $358 | per month paid annually | Buy nowBuy now | Enough to monitor multiple aspects of 100 devices | ||
| PRTG 2500 | $742 | per month paid annually | Buy nowBuy now | Enough to monitor multiple aspects of 250 devices | ||
| PRTG 5000 | $1,300 | per month paid annually | Buy nowBuy now | Enough to monitor multiple aspects of 500 devices | ||
| PRTG 10000 | $1,642 | per month paid annually | Buy nowBuy now | Enough to monitor multiple aspects of 1000 devices |

Unlike basic remote desktop monitoring tools that only check port availability, PRTG covers the full stack: RDP service availability and response time, the Windows services RDP depends on, CPU and RAM on your RDS hosts and workstations, patch status across remote computers, and the network links carrying session traffic. The goal is to catch problems in any of those layers before your users do.
No. PRTG monitors Windows operating systems agentlessly via WMI and Remote PowerShell using authentication credentials configured at the probe. The only prerequisite for patch monitoring is that Remote PowerShell is enabled on the target, no software deployment needed.
Yes. PRTG monitors Windows Server hosts running RDS, including CPU load, memory, and the Windows services that RDP depends on. It works on Terminal Server environments as well.
The Windows Updates Status (PowerShell) sensor connects to each remote computer via Remote PowerShell and queries update status against Microsoft Update or a local WSUS server. It reports installed, missing, and hidden updates by severity category, and alerts when remote computers fall behind. Prerequisites: Remote PowerShell enabled, PowerShell 3.0+ on both probe and target, .NET 4.7.2+ on the probe.
Yes, as long as the PRTG probe has network connectivity to the target systems. PRTG monitors cloud-hosted Windows environments (such as Azure VMs or AWS EC2 instances running Windows) via WMI, the RDP sensor, and SNMP the same way it monitors on-premises hosts. It doesn't use cloud-provider APIs; it works through standard protocols over your network.
The most common use cases include ensuring RDP availability across distributed office locations, monitoring Terminal Server capacity before session quality degrades, maintaining patch compliance on workstations and servers that handle sensitive data, and streamlining troubleshooting workflows for slow RDP sessions. PRTG fits IT Management teams running lean as well as MSPs overseeing remote infrastructure for multiple clients.
Yes. PRTG's probe architecture and scalability make it well-suited for MSP environments. Remote probes let you organize monitoring by client, site, or environment, each with independent devices, sensors, and alert thresholds. Dashboards and notifications can be scoped per client, and the mobile app keeps IT teams on top of alerts wherever they are.
Network Monitoring Software – Version 26.1.116.1532 (February 9th, 2026)
Download for Windows and cloud-based version PRTG Hosted Monitor available
English, German, Spanish, French, Portuguese, Dutch, Russian, Japanese, and Simplified Chinese
Network devices, bandwidth, servers, applications, virtual environments, remote systems, IoT, and more
Choose the PRTG Network Monitor subscription that's best for you


