
- English
- Deutsch
- Español
- Français
- Italiano
- Português
PDU problems rarely announce themselves clearly. Load creeps up gradually, a branch circuit approaches its limit across days or weeks, and the first obvious signal is often a tripped breaker or a hardware shutdown. Metered PDUs give you aggregate rack-level data. Monitored PDUs expose outlet-level metrics, environmental sensors, and status information. The difference matters when you're trying to pinpoint where a problem started.
Paessler PRTG connects to your power distribution units via SNMP and pulls near real-time data on voltage, current, power usage, and temperature across both PDU types. Configure thresholds per sensor, define your notification rules, and polling runs on your set interval from there. For distributed sites, remote probes cover rack power across locations through the same web interface, with no separate on-site tools needed. Supported manufacturers include APC, Raritan, ServerTech, Vertiv, Eaton, Tripp Lite, CyberPower, and any SNMP-enabled PDU.

When you're managing dozens or hundreds of racks, a single overloaded branch circuit can take down critical IT equipment. Without continuous visibility into power distribution, you're troubleshooting in the dark, often after the damage is done.
PRTG monitors power consumption across your PDUs and alerts you when loads approach capacity. Set thresholds for amperage, voltage, and power usage at the rack level, and receive notifications via email, SMS, or push alerts before overloads occur. Historical data shows usage trends over time, helping you spot gradual increases before they become emergencies.
Key benefits:
Most data center energy conversations start and end with the utility bill. That number tells you what you spent, not where it went. And without rack-level data, cost reduction stays a goal rather than a project.
PRTG pulls power draw data from metered and monitored PDUs continuously. Slice it by rack, by location, by time period. Inefficiencies that were invisible in aggregate become obvious when you can compare two racks side by side and one is pulling significantly more for the same workload. For PUE reporting, the inputs are already there, you're not estimating anymore.
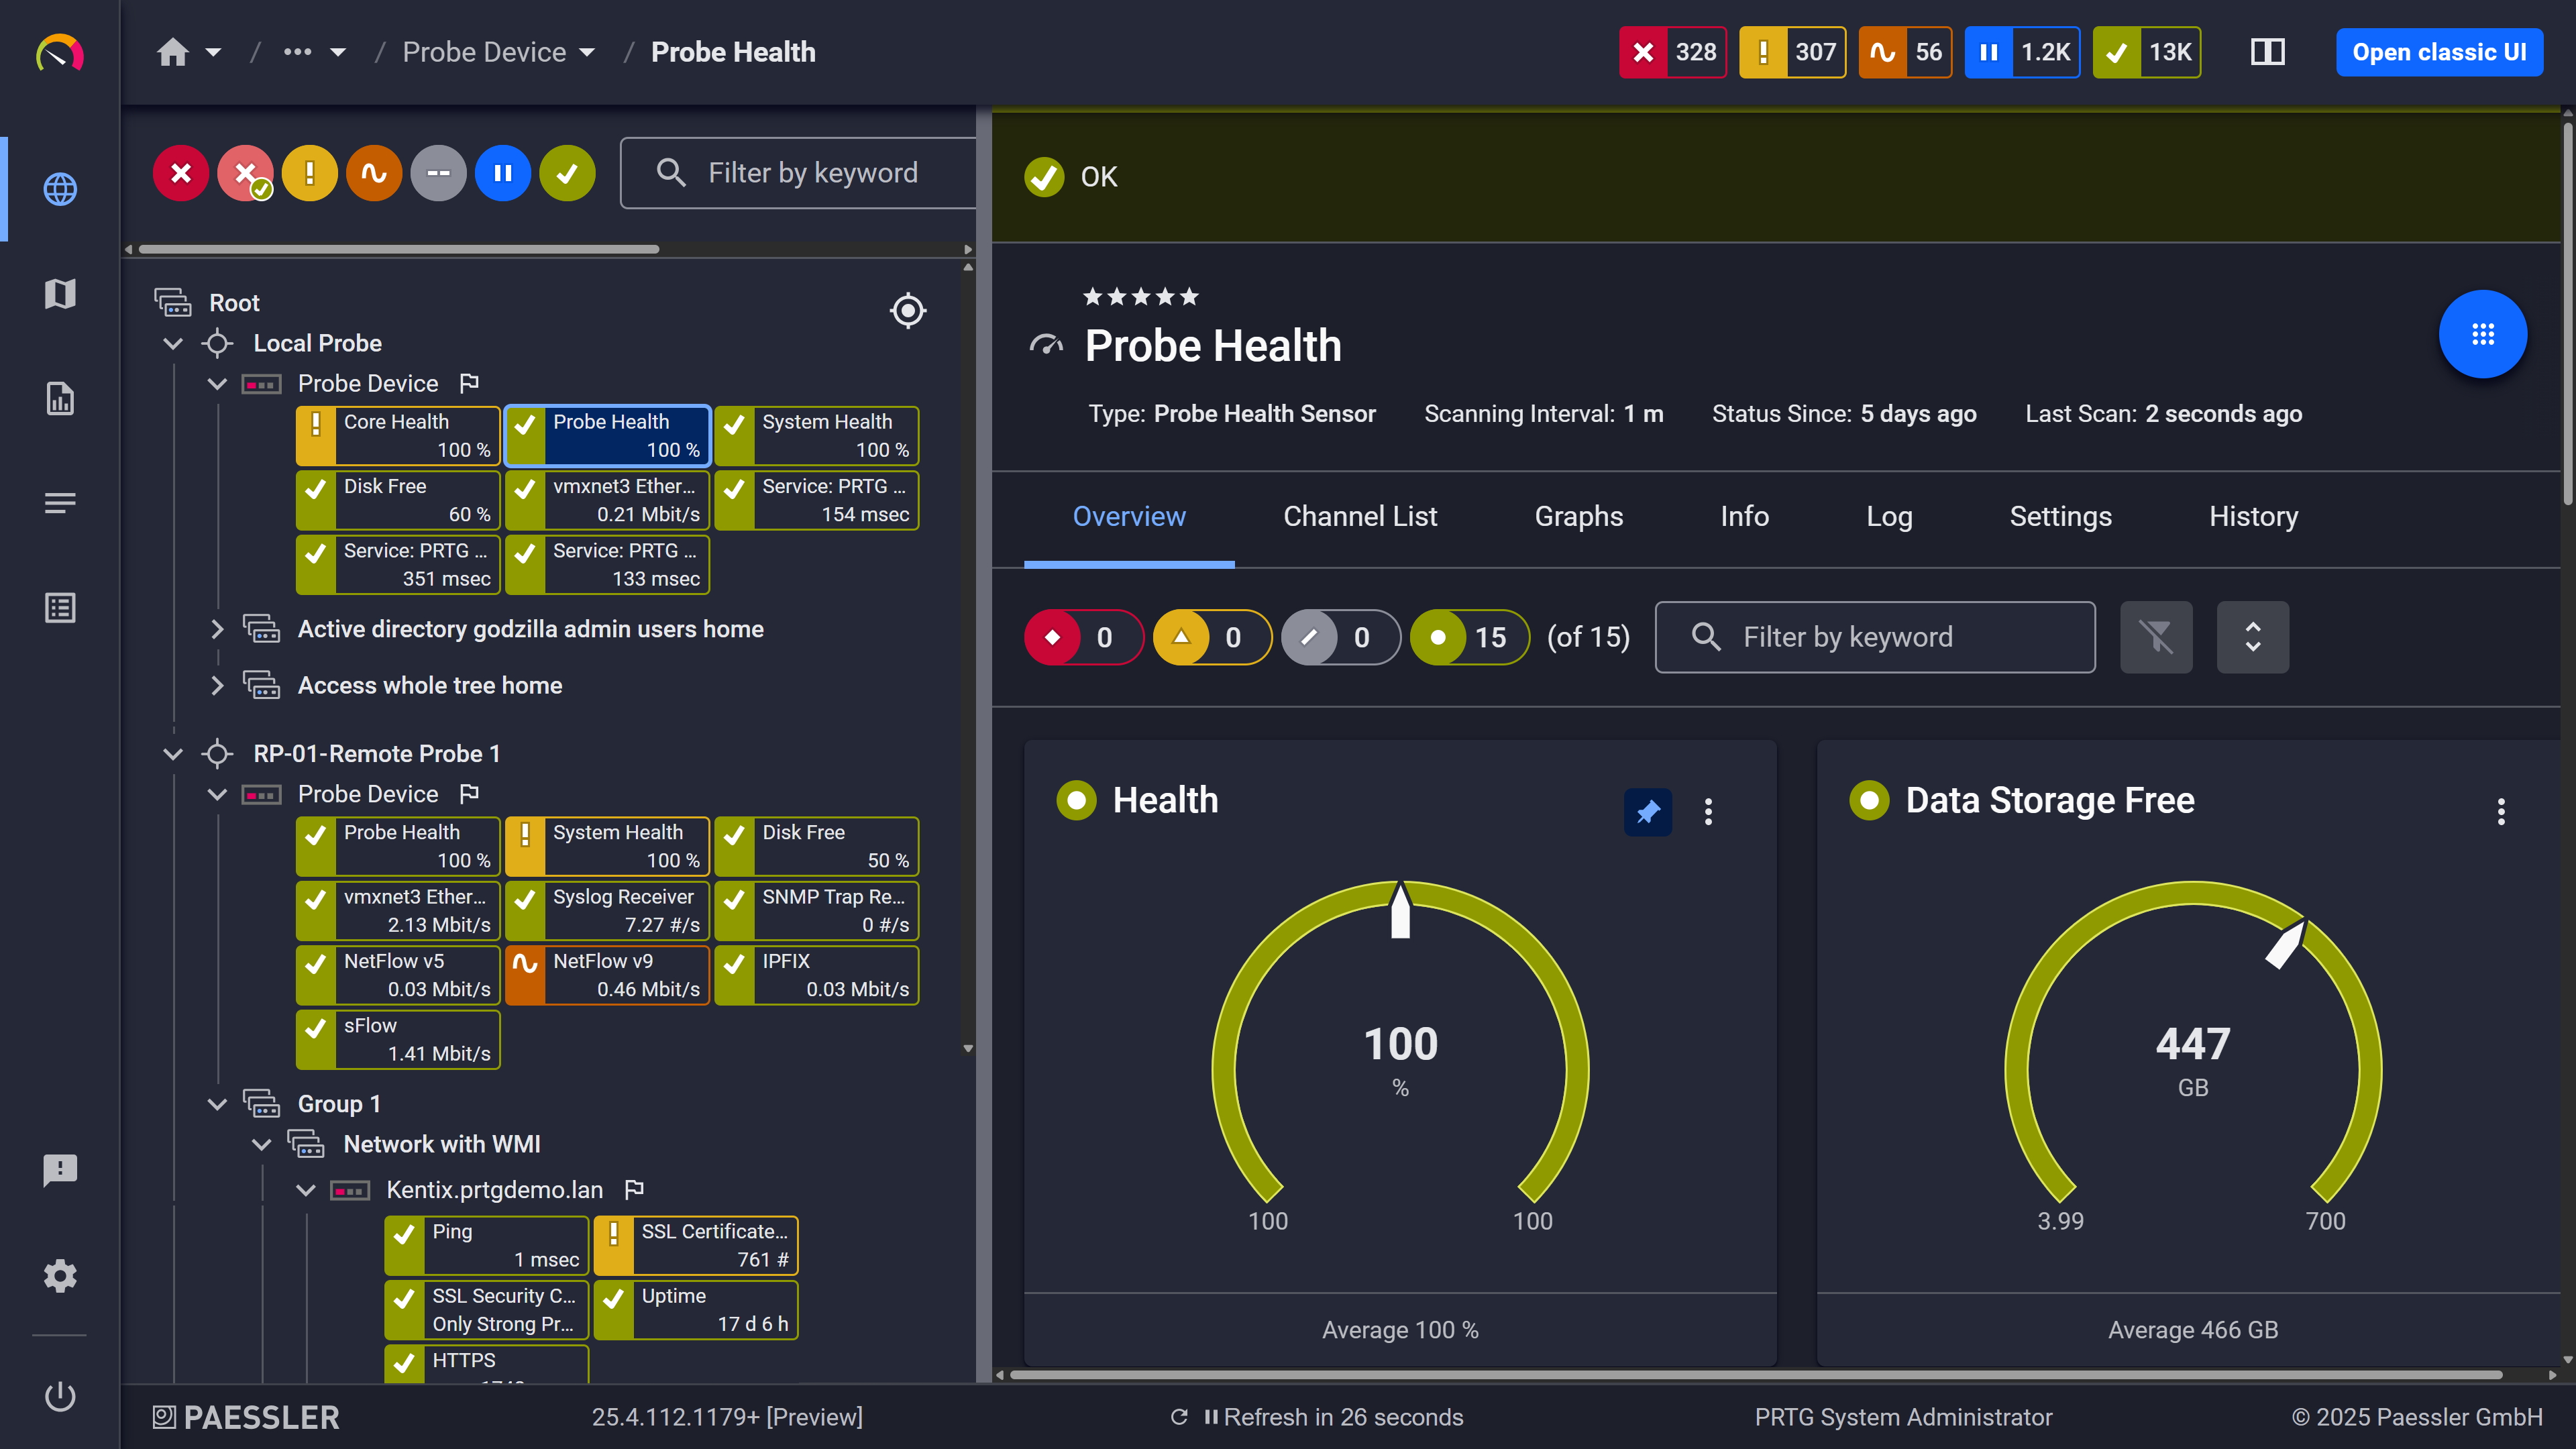
Probe health at a glance

Live graphs, real-time performance data
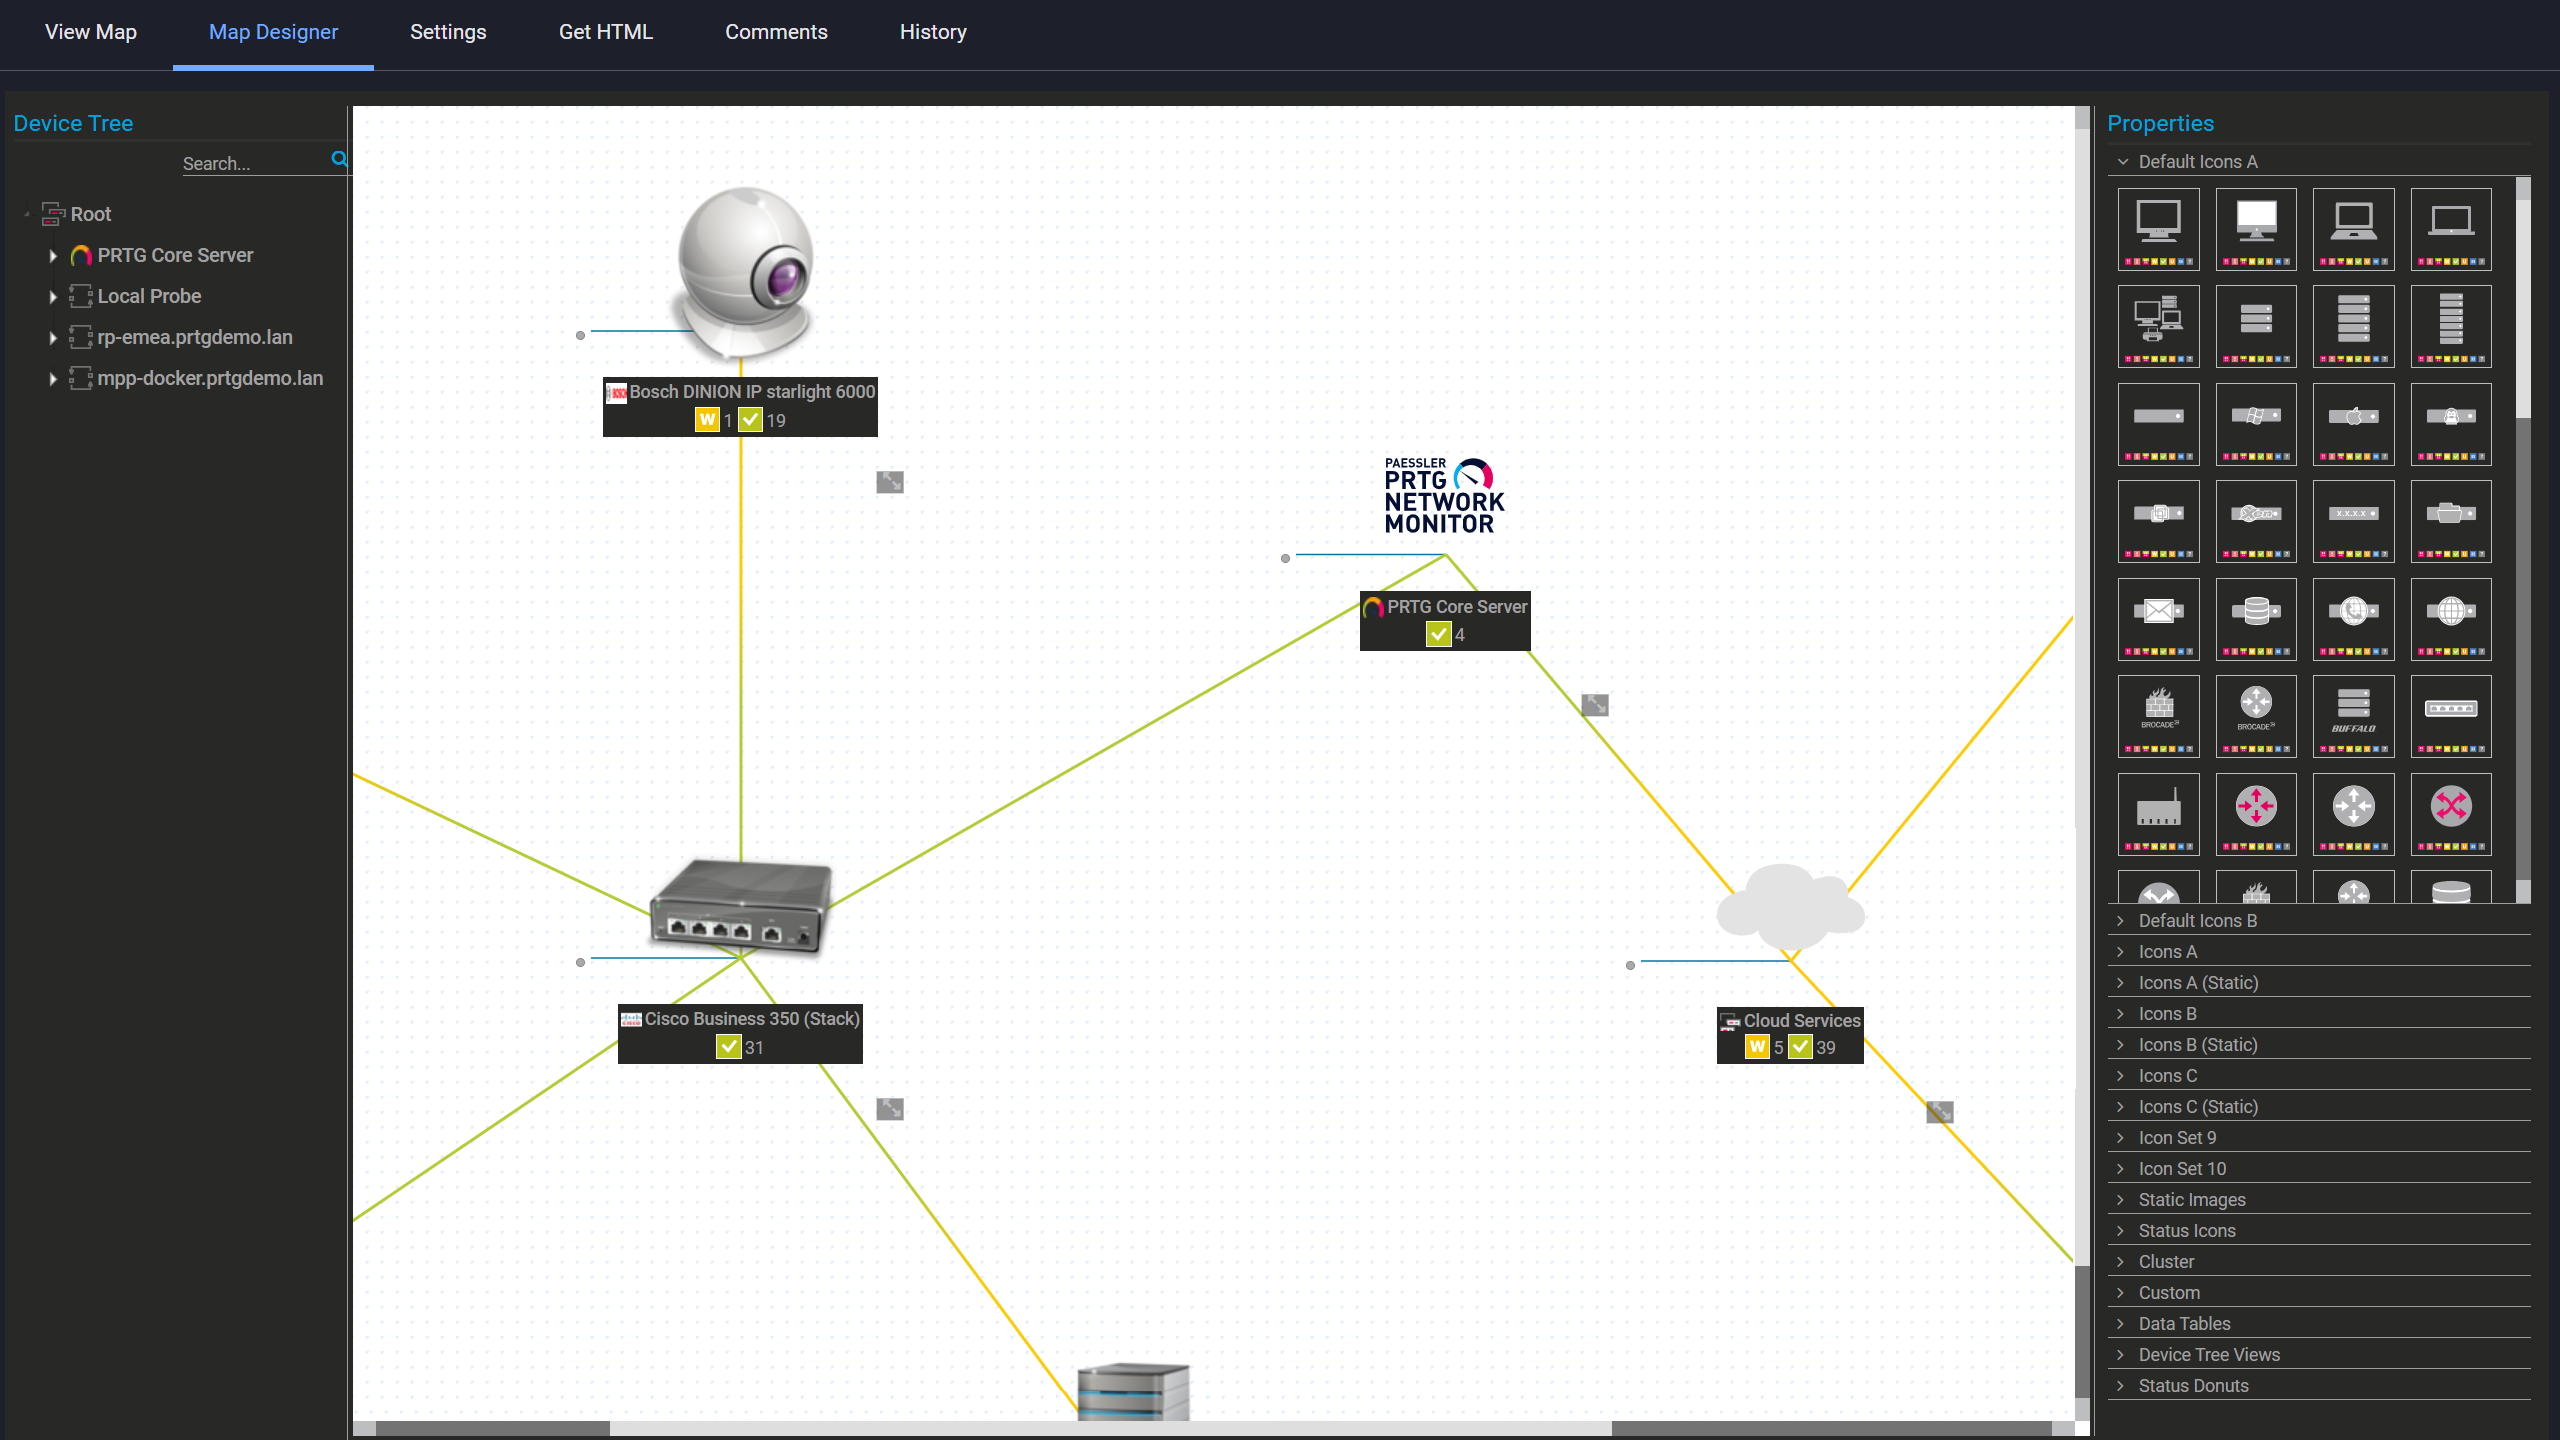
Custom maps with live status
Capacity planning without accurate power data is guesswork. You assume a rack has headroom, you deploy new hardware, and then you find out mid-project that the branch circuit is already at 80%. At that point the options are expensive.
PRTG monitors rack power continuously. Current draw, available capacity, utilization percentages per PDU are all visible without sending someone on-site. For monitored PDUs that expose outlet-level metrics via SNMP you can go further and track individual outlets to see exactly where power is allocated across a rack. That level of detail changes how you approach hardware refreshes and consolidation planning.
Start monitoring your infrastructure in minutes. No professional services, no complex configuration, no risk.
Full infrastructure coverage means tracking the physical conditions your hardware runs in, not just the network traffic it generates. PRTG pulls data from environmental sensors integrated with your PDUs, tracking temperature, humidity, and other conditions alongside your power metrics. Set thresholds that reflect your facility's actual operating requirements and get notified when conditions drift. Because power and environmental data sit in the same platform, you have full context when something needs attention, not two separate tools telling half the story each.
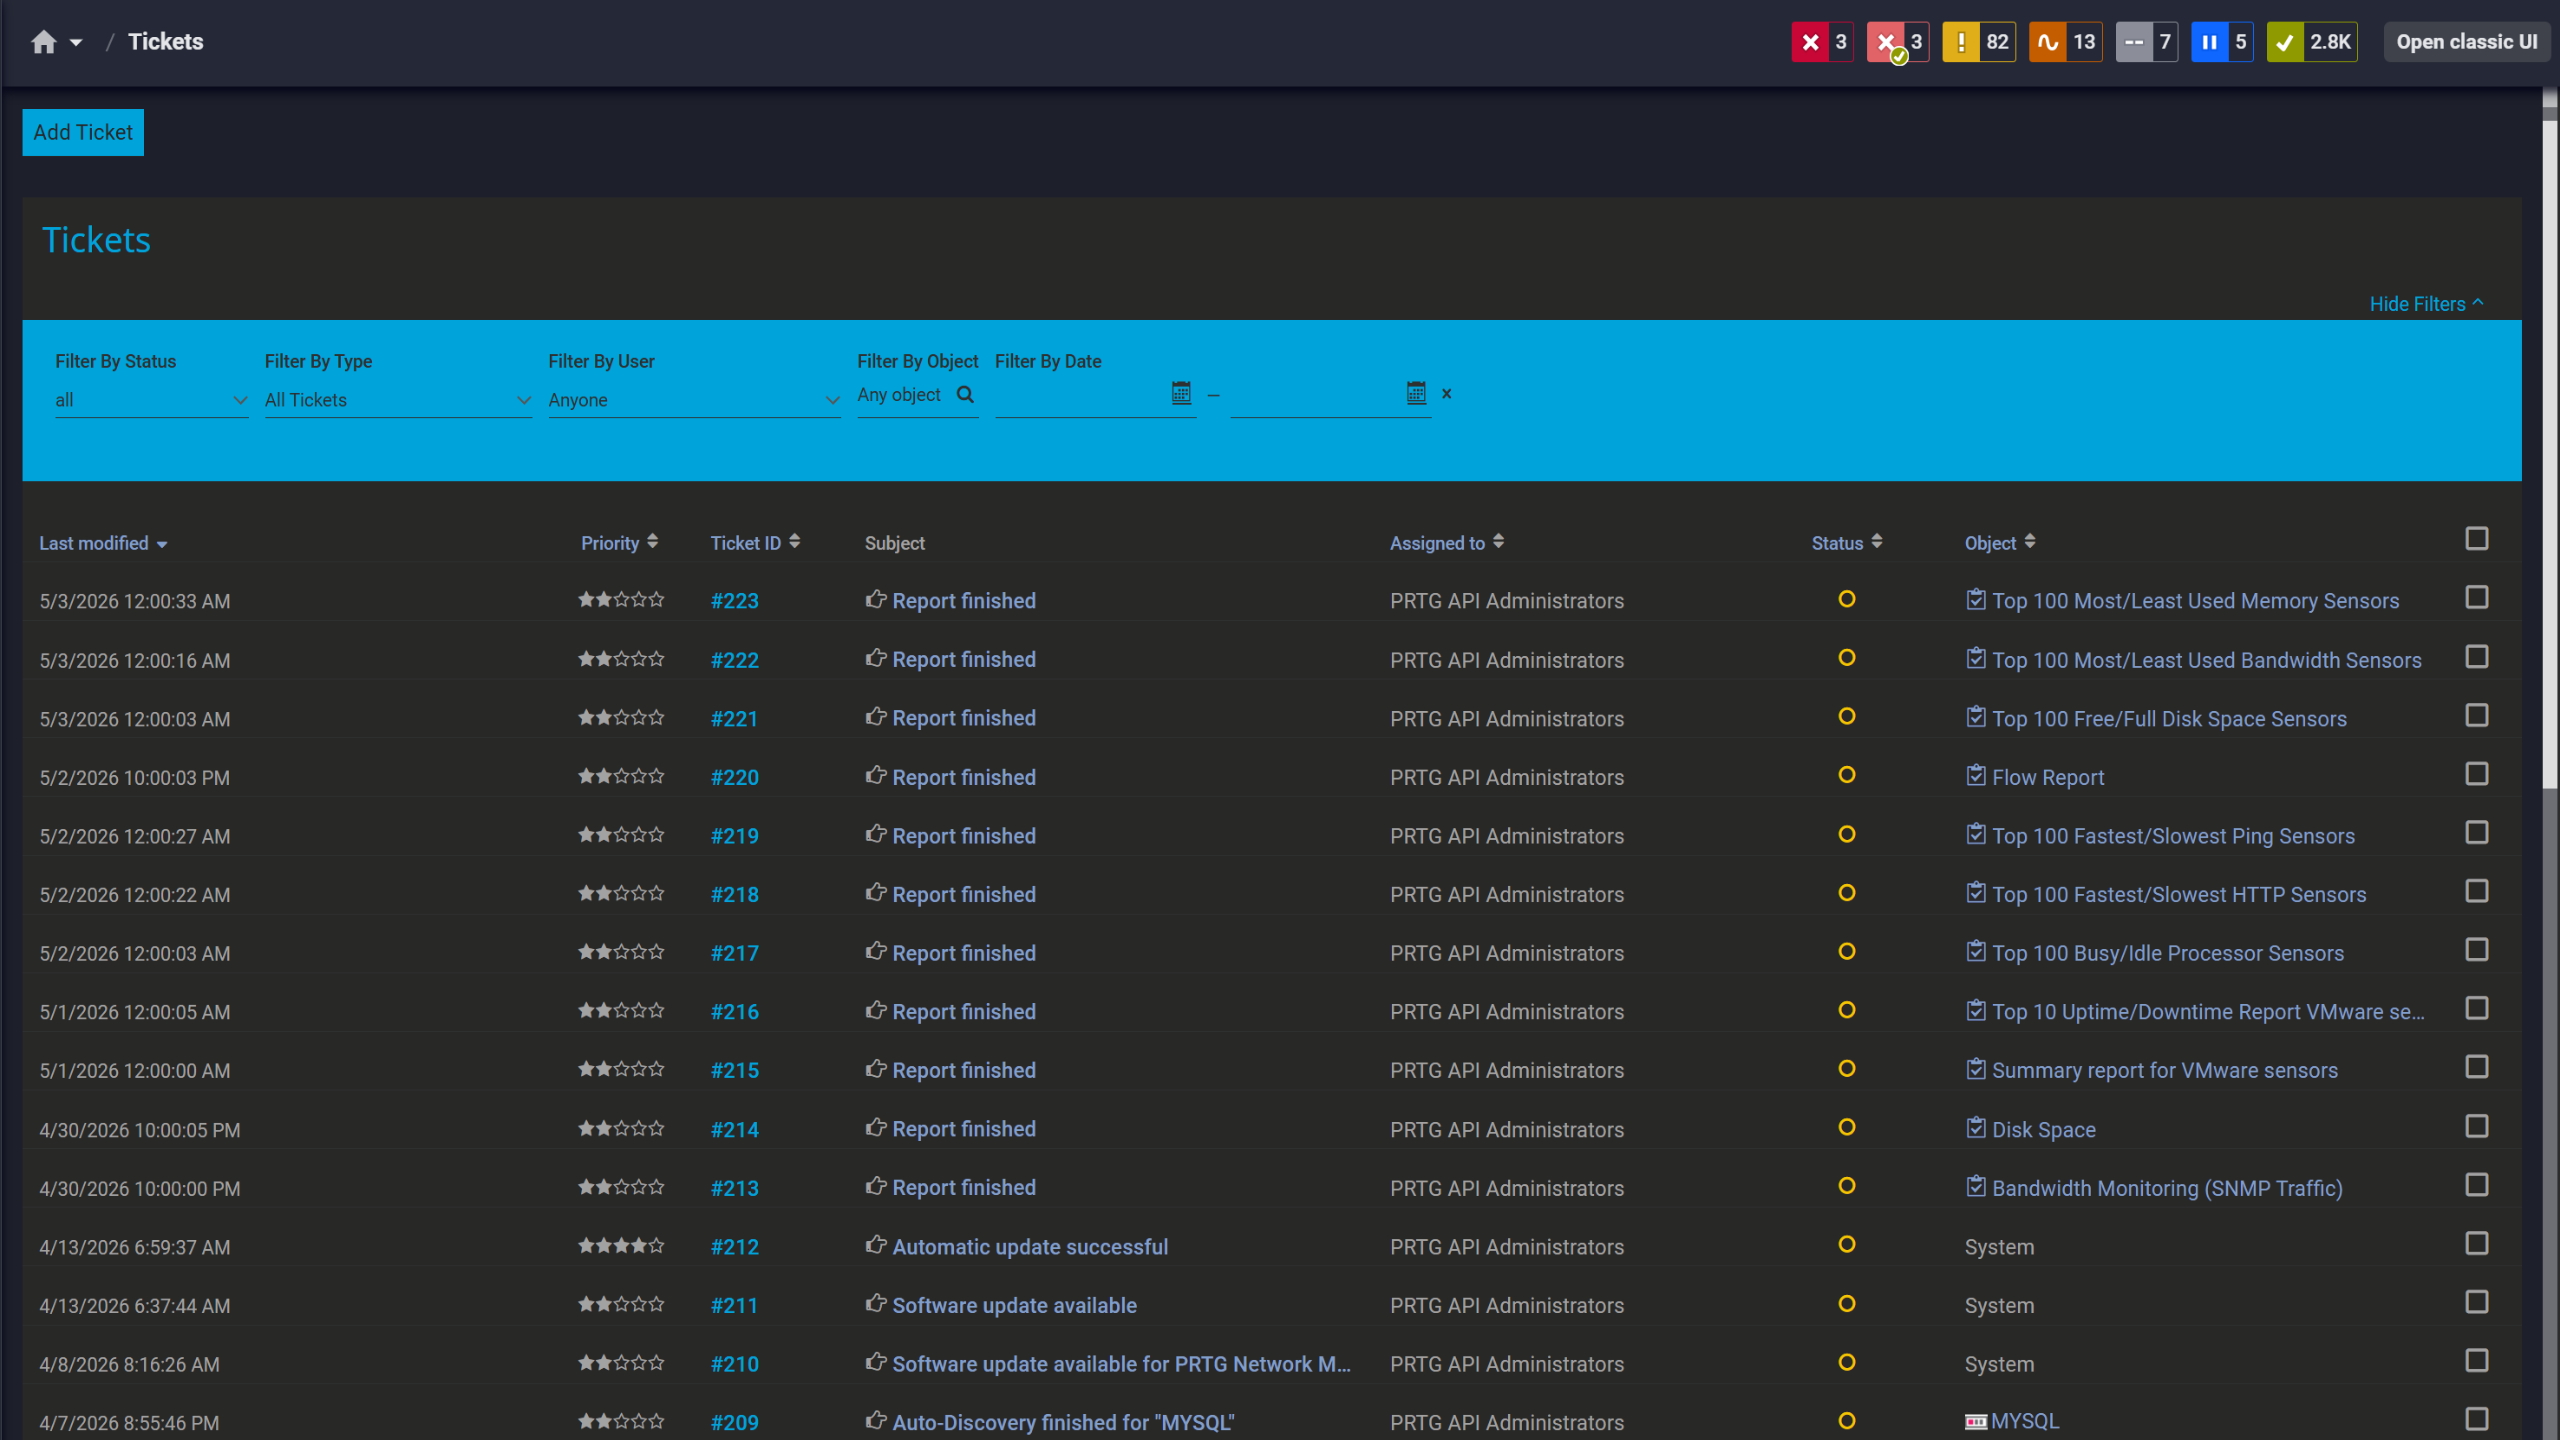
Tickets keep your team aligned

Scheduled reports, always on time

Full device list, instant overview
When your infrastructure spans multiple sites (branch offices, remote cabinets, or geographically distributed data centers), keeping tabs on power distribution becomes a logistical nightmare. You shouldn't need separate tools or on-site staff to monitor rack power.
PRTG uses remote probes to monitor PDUs across distributed locations, consolidating all power monitoring data into a single web interface. Each PDU communicates via SNMP over your existing Ethernet infrastructure. No proprietary software or additional hardware required. Check metrics and adjust thresholds from anywhere, with role-based access control for your team.
PDU monitoring only works if the data is actually there when you need it. That means correct SNMP configuration, consistent polling, and outlet-level metrics actually being collected, not assumed. Here's how PRTG collects, surfaces, and keeps that data current across your infrastructure.
Task | Without PRTG Without PRTG | With PRTG With PRTG |
|---|---|---|
Check power load on 50 rack PDUs | Without PRTG Log into each PDU's web interface individually. Takes 1-2 hours and only shows current values at that moment. | With PRTG PRTG polls all PDUs via SNMP at configurable intervals (commonly every 60 seconds) and displays live metrics in one interface. Check everything in under 2 minutes. |
Detect approaching capacity limits | Without PRTG Manual checks only show snapshots, so you miss gradual load increases and only discover problems after circuits trip or equipment shuts down. | With PRTG PRTG's threshold alerts notify you when power consumption reaches 80% or 90% of capacity, giving you time to rebalance loads or upgrade infrastructure before downtime occurs. |
Monitor PDUs at 10 remote sites | Without PRTG No visibility unless you're on-site or VPN into each location. Remote troubleshooting is nearly impossible without truck rolls. | With PRTG PRTG's remote probes monitor PDUs at every site and send data to your central server, giving you instant visibility across all locations from one interface. |
Track historical power trends | Without PRTG Export CSV logs manually from each PDU, then build spreadsheets to analyze trends. Time-consuming and error-prone. | With PRTG PRTG automatically stores all power metrics and generates historical graphs with a few clicks. Export reports in seconds for capacity planning or audits. |
Get alerted when power issues occur | Without PRTG No automated alerts. You discover problems when users report outages or during your next manual check. | With PRTG PRTG sends email, SMS, or push notifications the moment thresholds are breached, so you can respond before downtime impacts users. |
Choose the PRTG Network Monitor subscription that's best for you.
| License Name | License description | Price | License Details | Get started | Pricing Details | |
|---|---|---|---|---|---|---|
| PRTG 500 | $200 | per month paid annually | Buy nowBuy now | Enough to monitor multiple aspects of 50 devices | ||
| PRTG 1000 | $358 | per month paid annually | Buy nowBuy now | Enough to monitor multiple aspects of 100 devices | ||
| PRTG 2500 | $742 | per month paid annually | Buy nowBuy now | Enough to monitor multiple aspects of 250 devices | ||
| PRTG 5000 | $1,300 | per month paid annually | Buy nowBuy now | Enough to monitor multiple aspects of 500 devices | ||
| PRTG 10000 | $1,642 | per month paid annually | Buy nowBuy now | Enough to monitor multiple aspects of 1000 devices |

Anything with an IP address and SNMP enabled. That covers metered PDUs, which give you aggregate rack-level data, and monitored PDUs, which expose per-outlet metrics, environmental sensors, and status information. Rack PDUs, cabinet PDUs, single-phase and three-phase installations all work. Vendor support includes APC, Raritan, ServerTech, Vertiv, Eaton, and others. If it responds to SNMP queries, PRTG can monitor it.
Monitoring only. PRTG collects power metrics, environmental data, and status information, and alerts when thresholds are exceeded. Outlet switching is not something PRTG does. For remote power control you'd use the PDU's native web interface or a dedicated power management system. PRTG sits at the visibility and alerting layer, not the control layer. Worth being clear about that before deployment.
Depends on the PDU. For monitored PDUs that expose per-outlet data via SNMP, yes. PRTG queries the OIDs in the device's MIB and if current, voltage, or power per outlet is available it will display it. Metered PDUs typically don't expose that granularity. They report aggregate figures for the whole rack. Check your PDU's documentation or run an SNMP walk against the device before assuming outlet-level data is available. That step saves a lot of confusion later.
PRTG exports scheduled reports in PDF, HTML, CSV, and XML. If you're pulling data programmatically into a DCIM or analytics platform, the API returns JSON. Most teams use PRTG as the monitoring and alerting foundation and feed power, environmental, and uptime data into their DCIM or capacity planning tools from there. It's not a DCIM replacement. The two serve different functions and they work well alongside each other.
PRTG licensing is sensor-based, not device-based. Each monitored metric counts as one sensor. A metered PDU typically runs 5-10 sensors. A monitored PDU with outlet-level data and environmental sensors can reach 20-50 depending on how granular you go. Pricing is based on total sensor count across your entire PRTG installation, so adding a PDU means adding however many sensors you configure for it, no separate per-device fee on top.
Yes, and this is where the probe architecture actually earns its place. On Windows systems, classic remote probes handle local SNMP polling. On Linux (Debian, Ubuntu, RHEL) you deploy the multi-platform probe instead. Either way, processed data goes back to your central PRTG server rather than raw polling traffic across the WAN. If the connection drops the probe keeps running and syncs when it reconnects. No complex firewall rules, no VPN tunnel to every individual PDU.
A notification goes out through whatever channel you've configured: email, SMS, push via the PRTG mobile app, syslog, or a custom HTTP action. The alert includes the current value, your threshold settings, and a historical graph. You can also set escalation rules, warning email at 80% load, on-call page at 90% for example. The person receiving it has enough context to act without logging into anything else first.
Scan intervals are configurable per sensor. For most sensor types the minimum is 10 seconds, though some sensor types have a 60-second floor so it's worth checking for your specific setup. For critical metrics like amperage and voltage most teams set 30-60 second intervals. PRTG evaluates each result immediately after the scan completes and triggers the alert within seconds of a threshold breach. How fast you catch a problem depends on the interval you've set, so be deliberate about that configuration for your highest-risk PDUs.
Network Monitoring Software – Version 26.3.124.1727 (September 16, 2026)
Download for Windows and cloud-based version PRTG Hosted Monitor available
English, German, Spanish, French, Portuguese, Dutch, Russian, Japanese, and Simplified Chinese
Network devices, bandwidth, servers, applications, virtual environments, remote systems, IoT, and more
Choose the PRTG Network Monitor subscription that's best for you



