
Last reviewed: 10/2026


SolarWinds Observability Self-Hosted licenses by nodes in subscription editions; PRTG licenses by sensors, and every license includes the complete feature set. One sensor monitors one aspect of one device, such as the traffic on a switch port or the CPU load of a server, and license sizes differ only by the number of sensors you deploy. As a rule of thumb, plan 5 to 10 sensors per device, or one per switch port. Since deep monitoring uses more sensors than basic availability checks, the most reliable sizing method is the free 30-day trial, which runs without sensor or device restrictions.
This is where the packaging models part ways: SolarWinds distributes these capabilities across separate modules and edition tiers, while PRTG ships everything in one product. PRTG monitors network devices, servers, applications, databases, traffic, and cloud services with flow analysis (NetFlow v5 and v9, sFlow, jFlow, IPFIX), packet sniffing, and QoS measurements included in every license. Everything lands in one device tree, one alerting engine, and one set of maps and dashboards. According to our 2026 survey of 1,088 IT teams, 60.2% of midmarket respondents chose PRTG primarily to cover their whole infrastructure with one tool. One boundary to know: PRTG monitors route changes with the Traceroute Hop Count sensor and measures line quality between locations with its QoS sensors, but it does not provide a visual hop-by-hop path analysis view.
Scaling works differently in the two products: SolarWinds adds capacity through Additional Polling Engines, included in its Enterprise editions, while PRTG scales through remote probes that are part of every license. Remote probes collect monitoring data from branch offices, DMZs, and separated networks; independent PRTG instances per site keep a plant, hospital, or regional office autonomous with its data local. For very large or multi-server environments, PRTG Enterprise Monitor adds central oversight. Paessler publishes sizing recommendations per installation, and large deployments are planned around them.
Use case | PRTG PRTG | SolarWinds |
|---|---|---|
Cover network, servers, applications, and databases with one license | PRTG every PRTG license includes all monitoring features | Limited: split across the NPM and SAM modules or the Observability Self-Hosted tiers |
Analyze bandwidth and traffic flows without an add-on | PRTG NetFlow, sFlow, jFlow, IPFIX, and packet sniffing included | Limited: requires the separate NTA module |
Monitor virtualization and storage without extra products | PRTG VMware, Microsoft Hyper-V, and storage sensor types (NetApp, Dell EMC, HPE, and more) included | Limited: requires the VMAN and SRM modules |
Monitor cloud and hybrid environments | PRTG sensor types for Microsoft Azure, Amazon Web Services, and REST APIs included | part of the SolarWinds Observability Self-Hosted subscription tiers |
Bring IT and OT into one view | PRTG Modbus TCP, OPC UA, and MQTT sensor types alongside SNMP and WMI; niche protocols via custom sensors | Limited: no OT-specific products in the published product lineup |
Trace network paths hop by hop | PRTG Limited: route-change alerts (Traceroute Hop Count sensor) and QoS measurements; no visual path analysis view | NetPath, part of the NPM module |
Map topology, back up configs, keep inventory | PRTG Limited: covered by PRTG UVexplorer, a separate product providing topology, inventory, and config backup via scheduled discoveries, with the data surfaced inside PRTG | split across NPM maps, the NCM module, and the UDT module |
Alert the right people when something breaks | PRTG threshold-based alerting with notifications via email, SMS, push, and more; receives SNMPv1 and v2c traps | platform alert engine across modules |
Report uptime and SLAs for audits and leadership | PRTG scheduled reports on historic monitoring data | platform reporting |
Add monitoring locations without extra license costs | PRTG remote probes included in every license | Limited: additional polling engines require the Enterprise license tier |
Run monitoring without a separate database server | PRTG single Windows server installation with built-in data storage | Limited: requires a Microsoft SQL Server database |
In a PRTG Network Monitor vs. SolarWinds cost comparison, the model itself is the biggest difference: every PRTG license includes the complete feature set, and you choose a size by the number of sensors instead of assembling separate products per monitoring domain. You pay for what you actually monitor, and the price stays predictable as your environment grows. The current license sizes and prices are below.
| License Name | License description | Price | License Details | Get started | Pricing Details | |
|---|---|---|---|---|---|---|
| PRTG 500 | $200 | per month paid annually | Buy nowBuy now | Enough to monitor multiple aspects of 50 devices | ||
| PRTG 1000 | $358 | per month paid annually | Buy nowBuy now | Enough to monitor multiple aspects of 100 devices | ||
| PRTG 2500 | $742 | per month paid annually | Buy nowBuy now | Enough to monitor multiple aspects of 250 devices | ||
| PRTG 5000 | $1,300 | per month paid annually | Buy nowBuy now | Enough to monitor multiple aspects of 500 devices | ||
| PRTG 10000 | $1,642 | per month paid annually | Buy nowBuy now | Enough to monitor multiple aspects of 1000 devices |
“With SolarWinds, Cacti, and SNMPC we needed three different monitoring systems to gain overview about all our systems and devices. None of these offered mobile apps which ended up being the reason why we moved to PRTG. Finding out that PRTG was able to replace all three tools was a huge additional benefit for us and helps us to save a lot of time and money.”
PRTG shows your entire infrastructure in one hierarchical device tree, with a traffic-light state for every sensor. Drill down from a site to a device to a single monitored value in two clicks, or turn the same data into dashboards for your NOC screen and management. Here are four views you will work with daily.
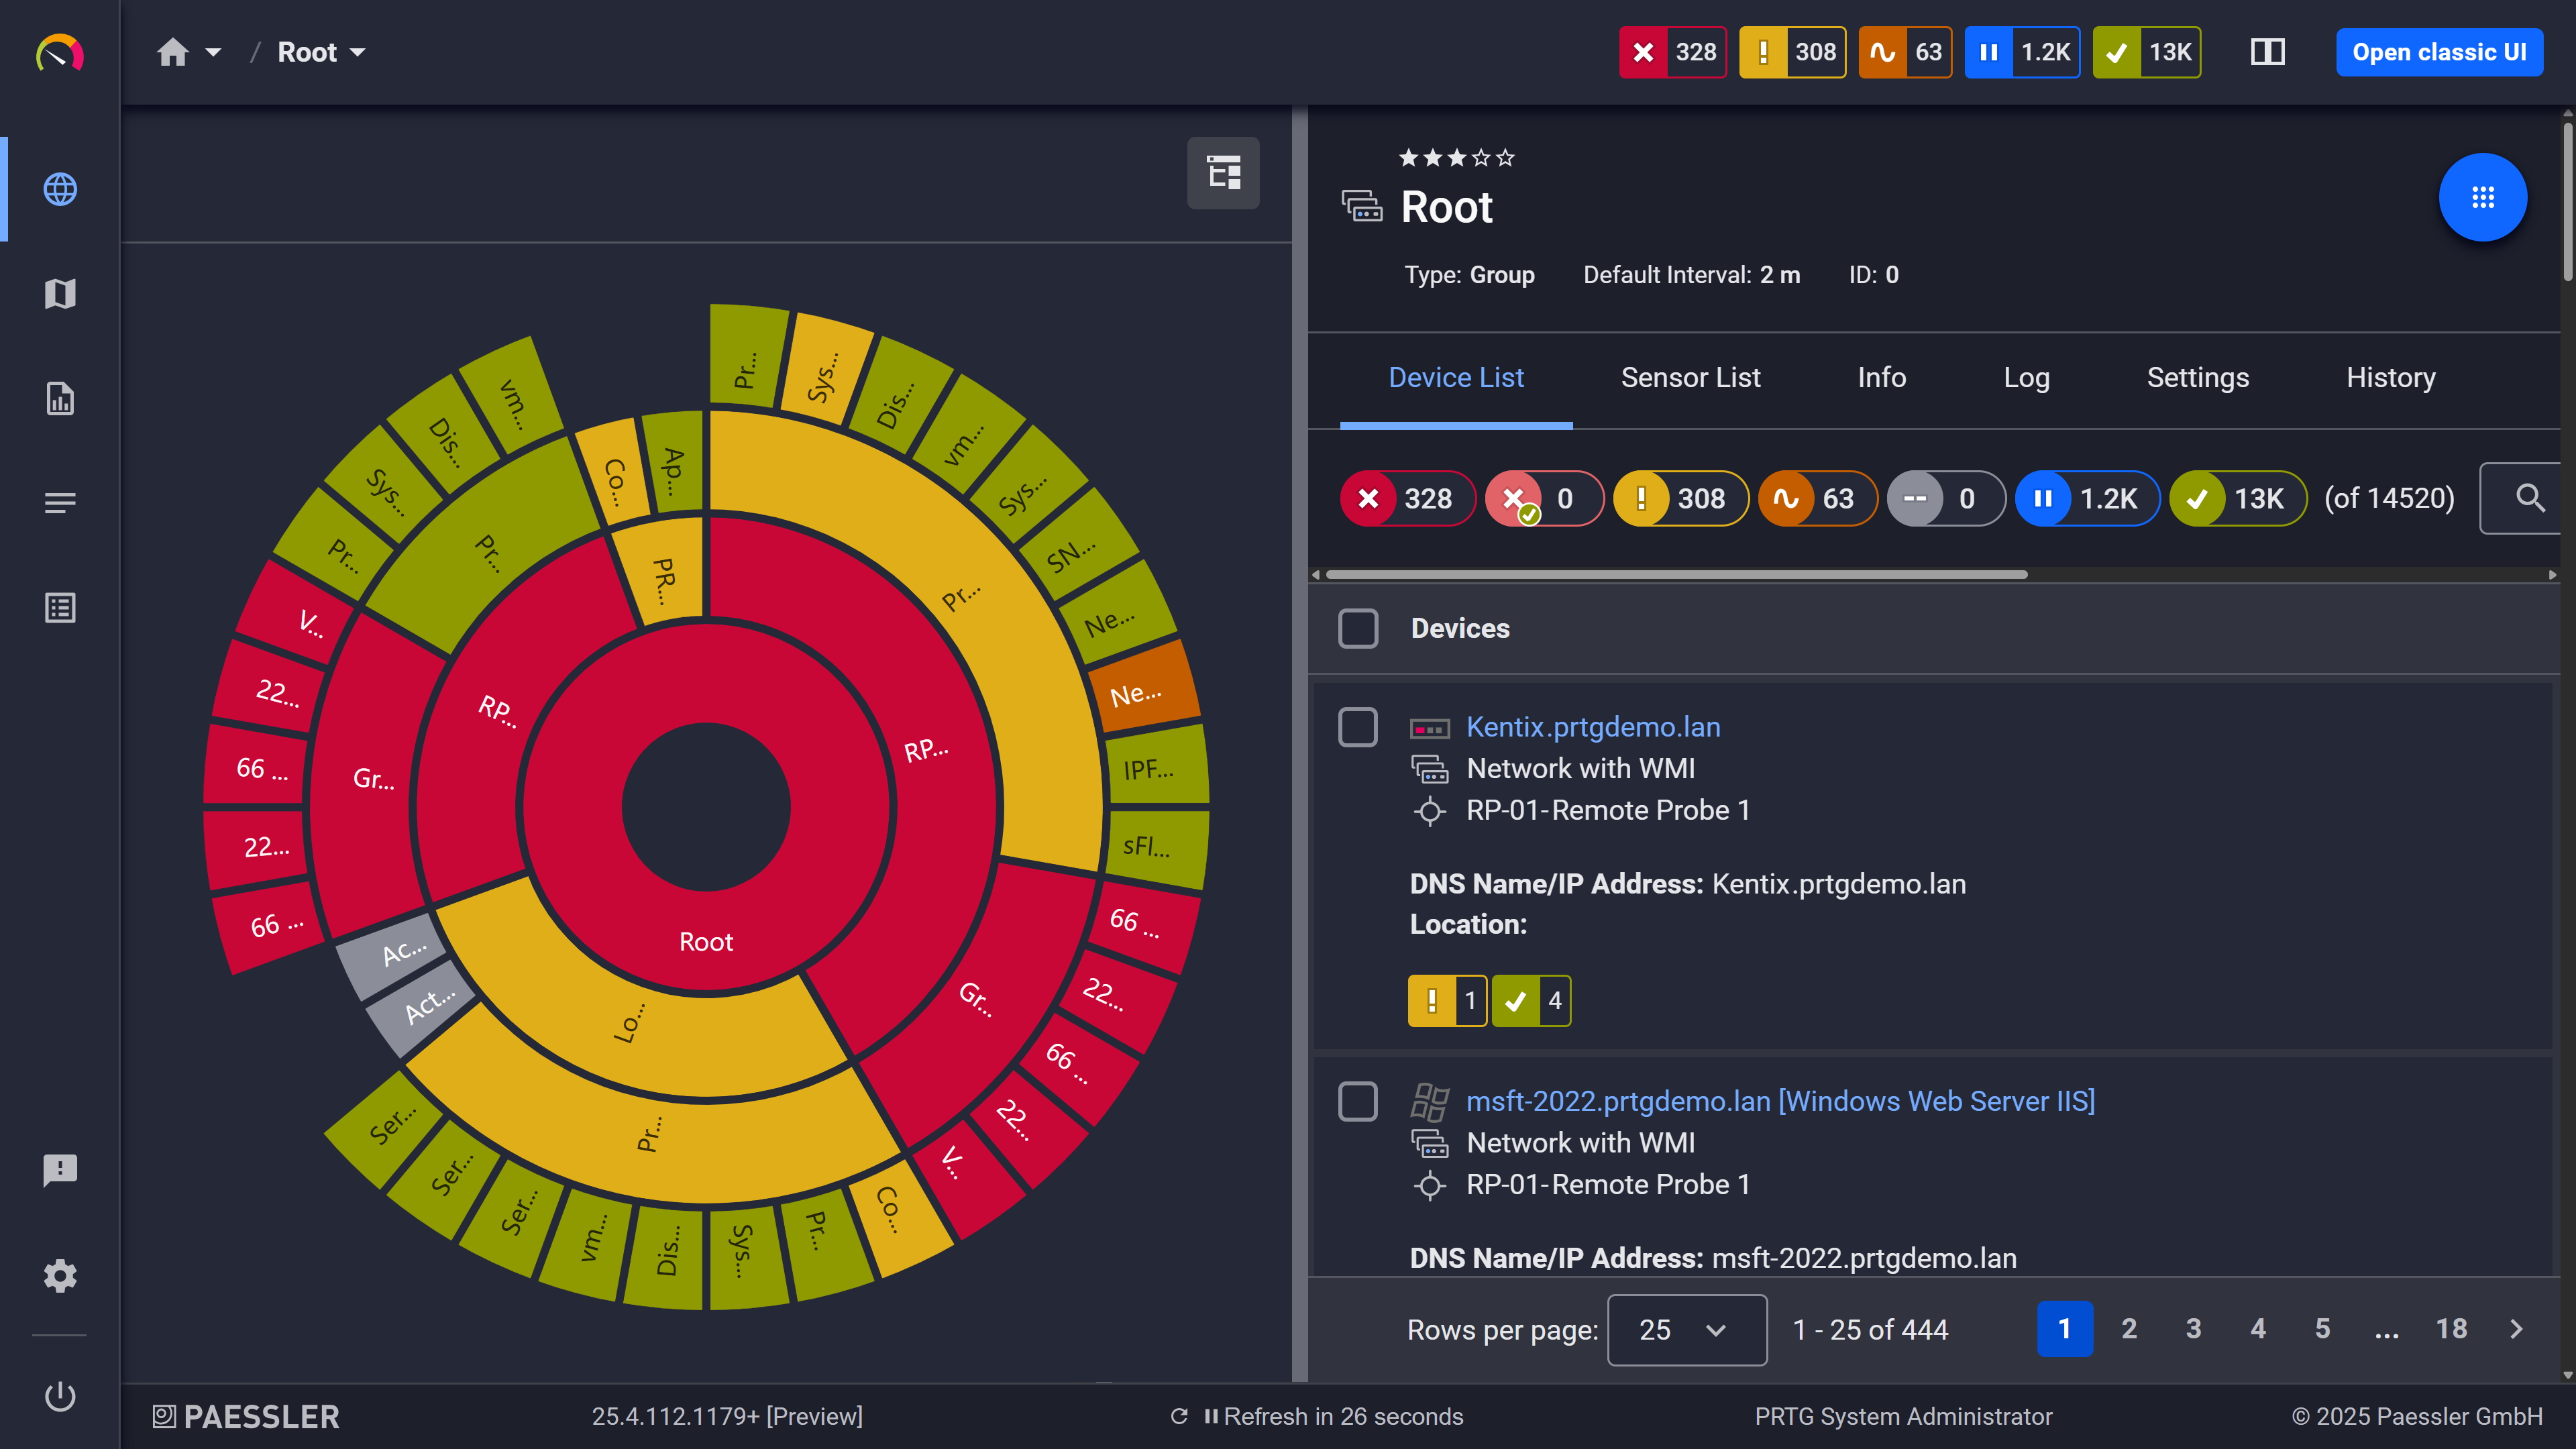
Custom dashboard: your easy-to-grasp overview built from your own sensors
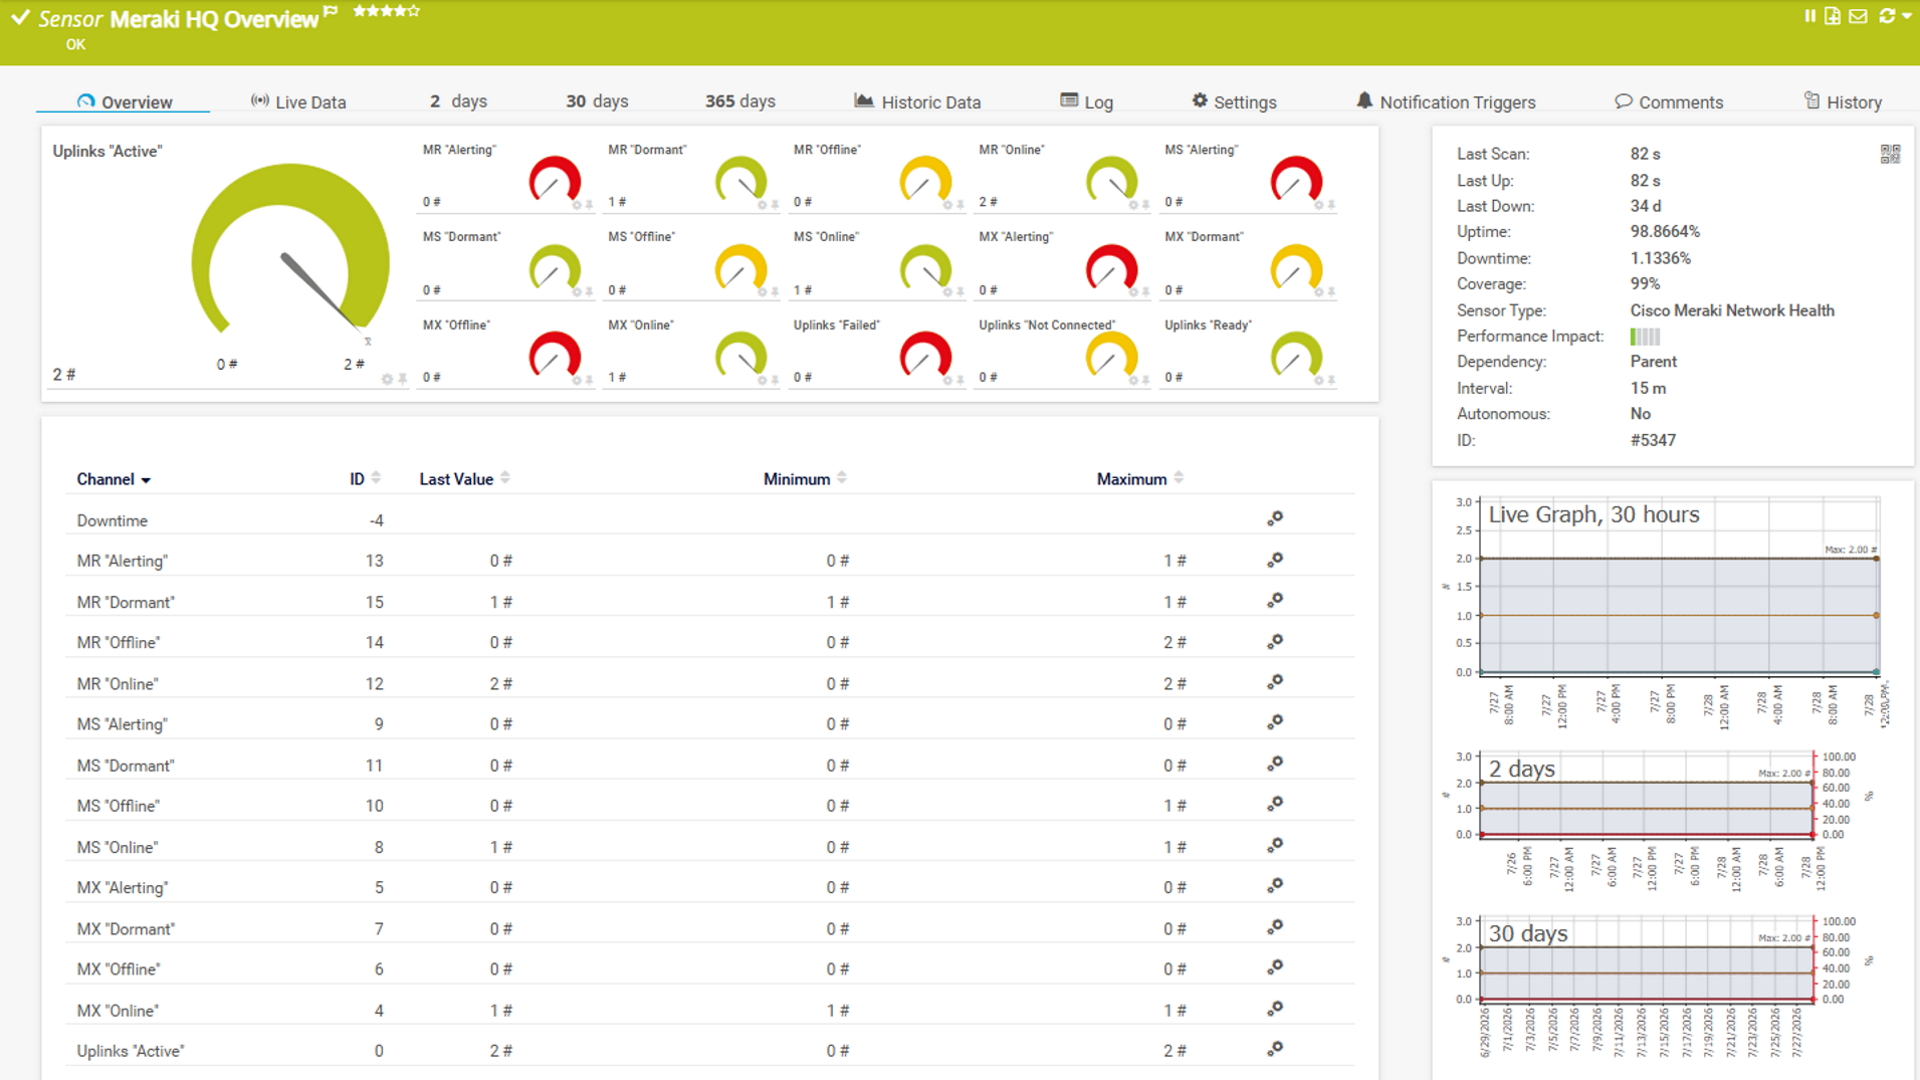
Sensor traffic: live sensor data, updated on your configured scan interval
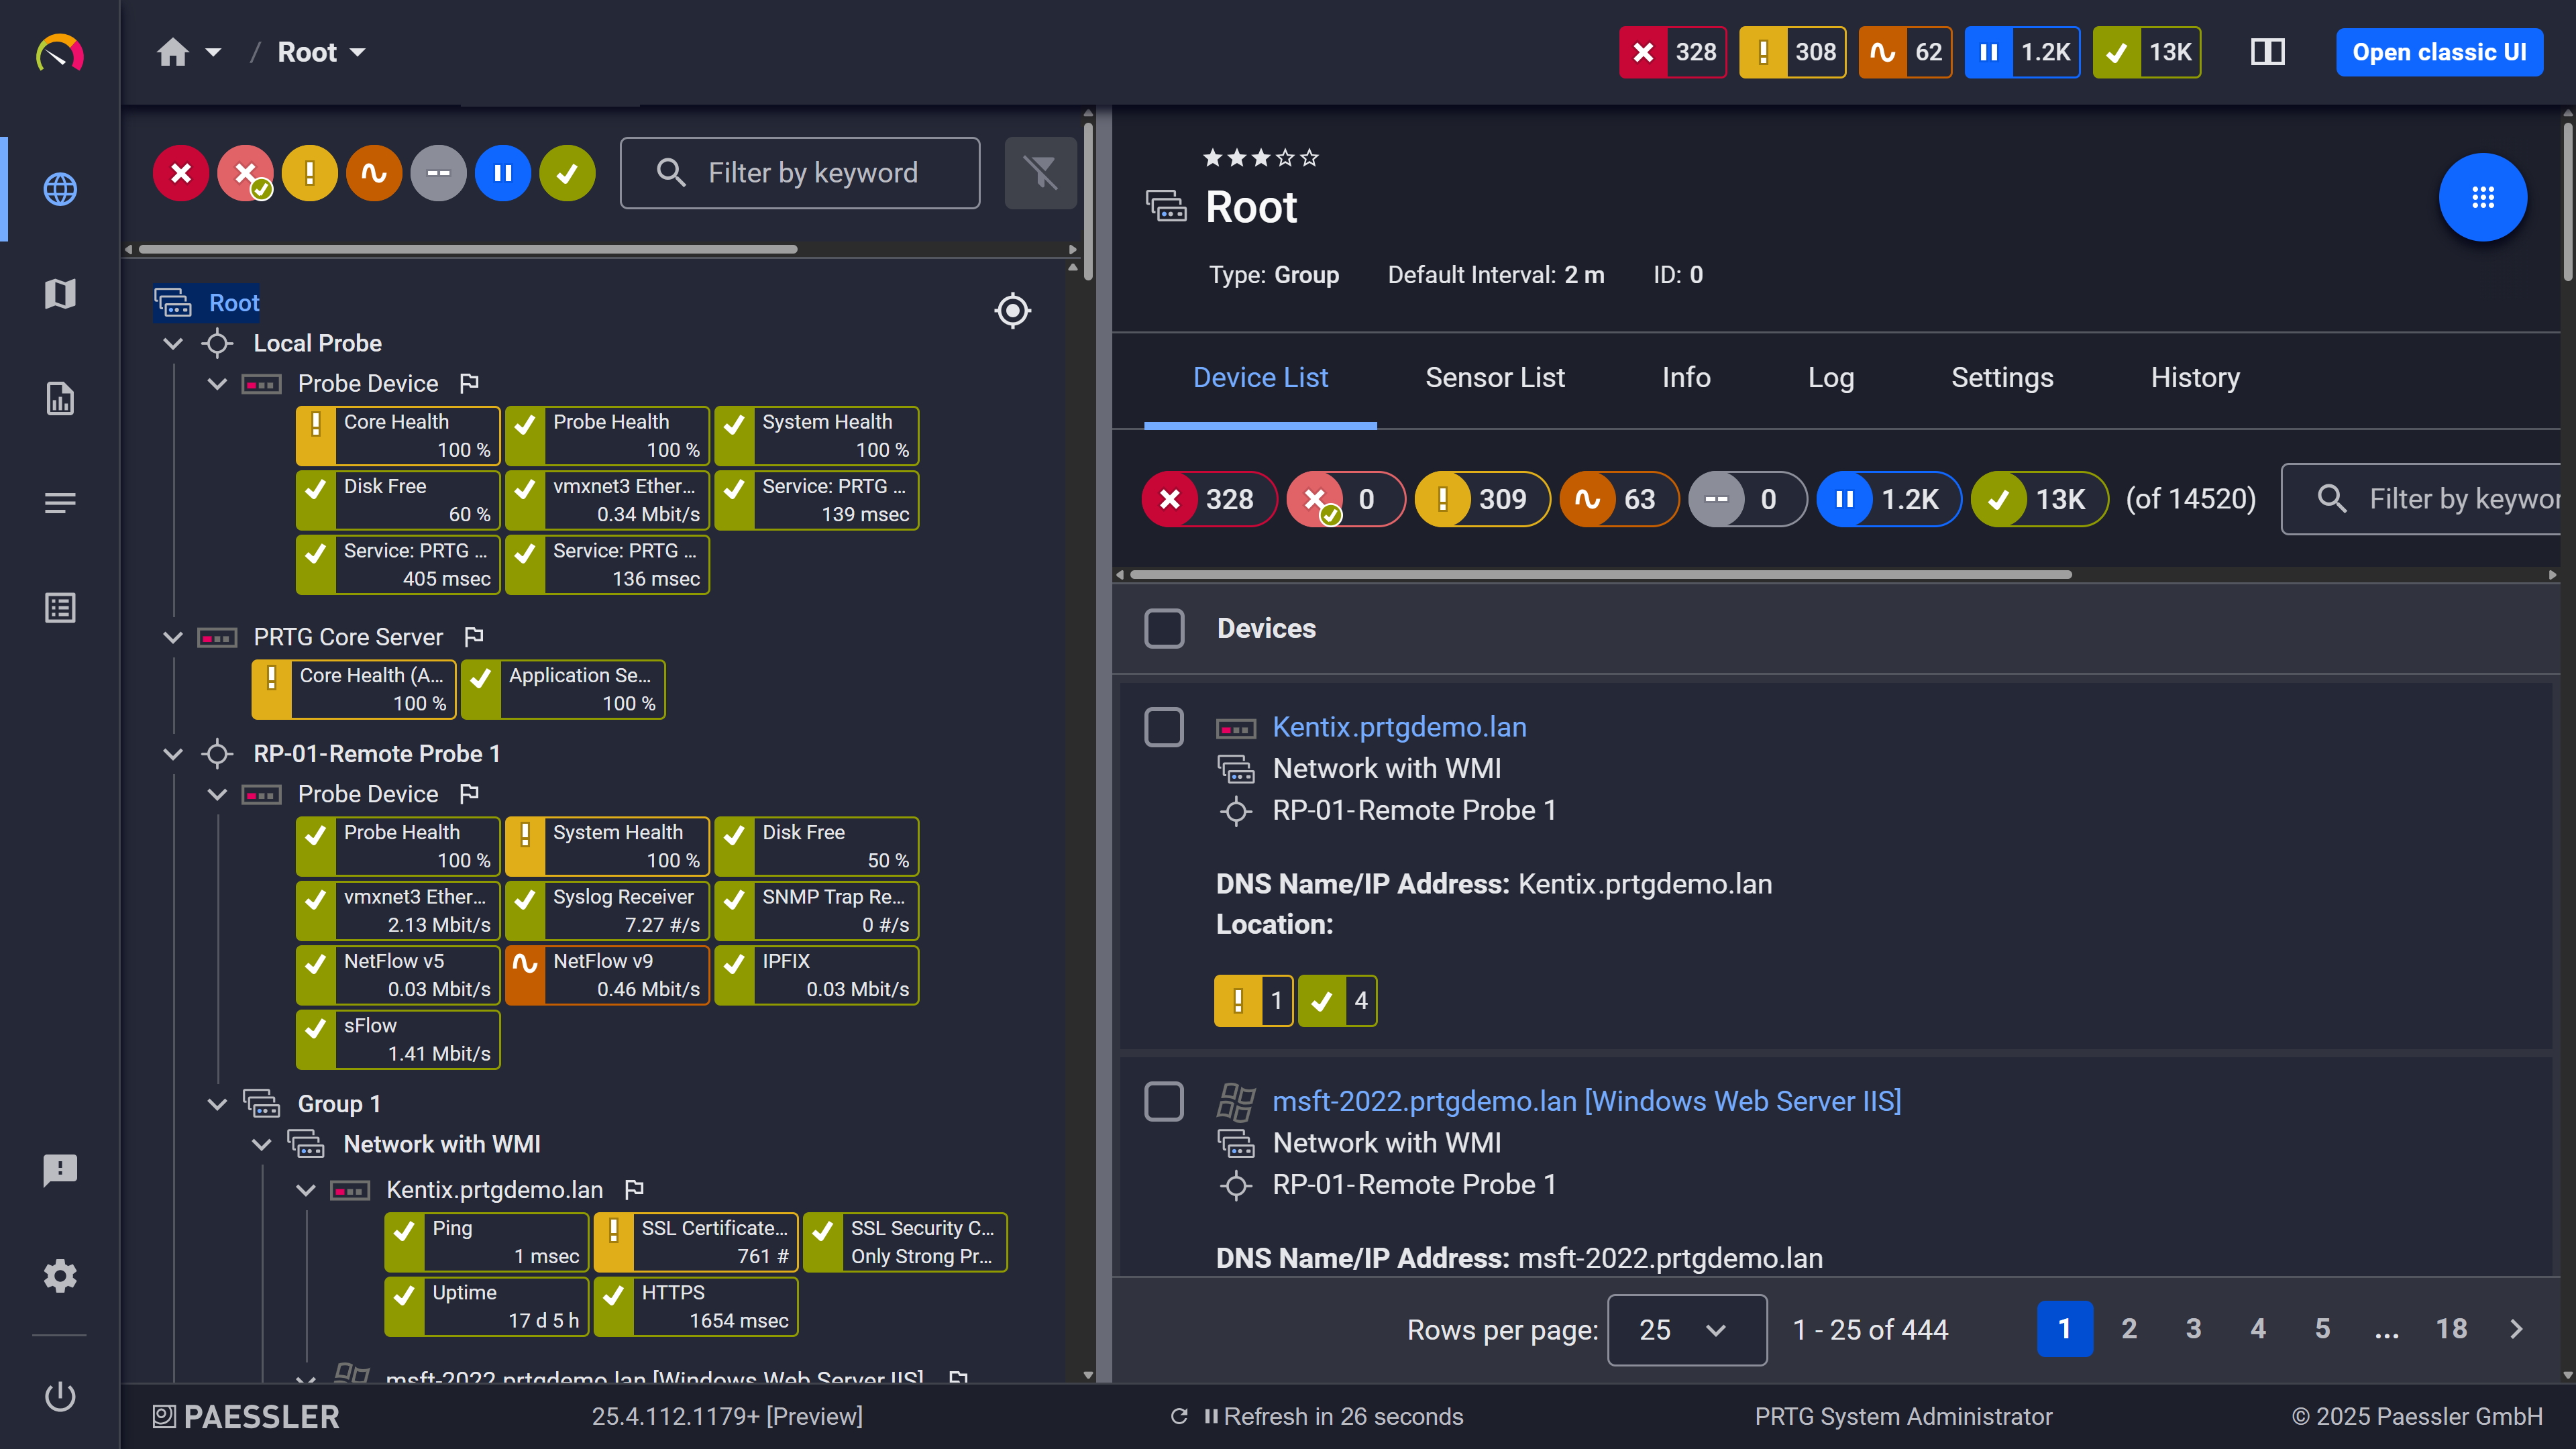
Device tree view: your full infrastructure, organized automatically after auto-discovery
Switching to PRTG follows one simple principle: your live network is the source. PRTG's auto-discovery reads what actually exists and rebuilds your monitoring directly from it. Four steps take you from your current setup to a running PRTG installation.
Have a list of hostnames or IP adresses of your current device. This can be from your own documentation, or get it from your current monitoring tool. In SolarWinds, export your managed nodes list from the Manage Nodes view or via a node inventory report. This list is your completeness checklist for the entire switch. Then install PRTG alongside your current tool: both can run in parallel during the transition.
Let auto-discovery rebuild your monitoring. Enter your IP ranges and device credentials (e.g. for protocols like SNMP or WMI). PRTG's auto-discovery scans the network segments, identifies device types, and creates suitable sensors from built-in device templates. The rebuild comes from your live network, so it reflects what is really there. Compare the result against your device list from step 1 and add any sensors auto-discovery could not infer.
Translate concepts, not configurations. What you know maps cleanly to PRTG: polling engines become remote probes, nodes become devices, monitors and elements become sensors, and dashboards become maps. Then recreate your alerting workflows with PRTG's notification templates and triggers.
Run both systems in parallel and tune. Compare alerts side by side for a few weeks. Adjust thresholds and schedules, and build the maps and reports your team and leadership rely on. Decommission the old tool once PRTG has proven itself in daily operation.
A tool switch is the ideal moment to find out what your old setup wasn't watching. Paessler PRTG UVexplorer, a separate product whose data is surfaced inside PRTG, runs scheduled discoveries that build a multi-vendor topology map and asset inventory of what actually exists on your network. Compare that inventory against what SolarWinds was monitoring, and close any blind spots before they carry over. After cutover, the same point-in-time snapshot confirms that your PRTG rebuild caught everything.
Yes, for the core monitoring use cases: PRTG covers network monitoring (NPM), server and application monitoring (SAM), and traffic analysis (NTA) in one product. For anyone looking specifically for a SolarWinds Network Performance Monitor alternative, the comparison table above maps each use case, and the migration guide shows what translates to what.
That depends on what you optimize for. SolarWinds Observability Self-Hosted is a platform licensed by nodes in subscription tiers; PRTG is one product with every feature included, licensed by sensors. Teams that value consolidation, predictable licensing, and a fast single-server deployment tend to choose PRTG, and the free trial is the quickest way to test that fit in your own environment.
No. PRTG stores monitoring data in its own built-in data storage, which is part of the product. There is no external database to license, patch, or maintain.
Yes. The SNMP Trap Receiver sensor collects SNMPv1 and SNMPv2c traps, filters them by your rules, and triggers alerts on warning or error conditions. PRTG does not support SNMPv3 traps or SNMP Informs. If some of your devices send traps exclusively via SNMPv3, test those devices during the trial.
Most teams run both systems in parallel rather than switching overnight. PRTG's auto-discovery scans your network and builds the device tree with suitable sensors within hours, which gives you baseline monitoring on day one. Tuning notifications, thresholds, maps, and reports takes longer and depends on the size of your environment; plan the parallel phase around your renewal date.
Yes. PRTG monitors OT infrastructure alongside IT using preconfigured sensor types for Modbus TCP, OPC UA, and MQTT in addition to SNMP and WMI. Devices beyond the preconfigured sensor types can be covered with custom sensors, which require configuration effort; validate them against your equipment during a trial.
PRTG runs in environments where downtime has real consequences: hospitals, manufacturing plants, utilities, and public services. In our 2026 customer survey, 89.5% of respondents rated PRTG's reliability in the top two rating categories. For distributed setups, remote probes buffer monitoring results locally if the connection to the core server is interrupted, so no monitoring data is lost.
Teams evaluating SolarWinds replacements usually compare four things: whether all features come in one license, what the platform needs to run, how monitoring scales across locations, and how honest the vendor is about limits. The best SolarWinds alternative is the one that fits your environment on those four points, and a parallel trial run is the fastest way to find out. PRTG makes that test easy: one license with everything included, a single-server installation, and a 30-day trial without restrictions.
We also compared PRTG with other monitoring tools:
The basic version of the open-source tool Nagios is free of charge. But most users spent many hours to set up and customize the tool. In case of problems, browsing through forums is often the only solution.
Dynatrace offers AI-driven monitoring but with complex consumption-based pricing. PRTG delivers comprehensive monitoring with straightforward sensor-based pricing and flexible deployment options.
Comparison with Dynatrace
Zabbix is open-source software with a strong community support. But it requires lots of manual configuration work to install and set it up. You also need to install agents on the monitored systems.
Centreon is highly customizable but complex to configure. PRTG offers powerful monitoring, an intuitive interface, easy setup, and transparent sensor-based pricing that’s budget-friendly.
Start a 30-day trial with unlimited sensors, no commitment required.
Tell us your device count and we'll send you a quote.
See PRTG in a live demo with one of our monitoring experts.
