
Last reviewed: 10/2026


Some monitoring platforms, including Observium, charge one flat annual fee for an unlimited number of devices, regardless of what's actually being tracked on each one. PRTG works differently: cost is tied to what you're actually monitoring, a sensor for each metric, so a lightly watched switch and a heavily instrumented application server aren't priced as if they were the same thing. That link between cost and coverage is also why, according to our 2026 survey of 1,088 IT teams, 60.2% of midmarket IT teams chose PRTG specifically because one license replaced several separate tools. At very high device counts with a narrow, network-only scope, a flat annual fee can work out cheaper, a fair trade-off worth knowing going in.
Self-hosted, SNMP-focused platforms like Observium typically mean building and tuning device definitions by hand as new hardware gets added to the network. PRTG takes a different starting point: auto-discovery scans your network, identifies devices, and creates a working set of sensors automatically, so you get a usable view without mapping out every device type first. From there, a library of more than 300 preconfigured sensors covers common hardware and services without extra configuration. Worth stating plainly: PRTG still needs a server to install and maintain, same as any self-hosted platform, the difference is configuration effort once it's running, not server ownership itself. For teams where server ownership specifically is the concern, PRTG Hosted Monitor removes that step entirely, Paessler manages the server and you just log in.
Some platforms, Observium included, lean partly on community and vendor contributors to extend device support for newer or more specialized hardware. PRTG's sensor library is maintained directly by Paessler, so new device and vendor support doesn't depend on a contribution cycle outside the company. That means broad coverage for common network, server, and application hardware is there from the start, not something you wait on. One honest boundary: very obscure or private-MIB hardware can still need a custom sensor, built with PRTG's scripting and API options, regardless of which platform you're using.
FEATURE | PRTG PRTG | Observium Observium |
|---|---|---|
Cover network, server, and application monitoring with one license | PRTG All monitoring types included in every license, no add-ons | Observium Limited. Built for SNMP-based network and device monitoring; broader application metrics require integrating collectd or munin |
Scale monitoring without re-architecting your server setup | PRTG Unlimited remote probes included in every license; one installation extends to new sites | Observium Limited. Scaling an instance across multiple servers is listed as an Enterprise Edition feature |
Keep costs predictable at very high, network-only device counts | PRTG Limited. Licensed by sensor count; cost scales as monitored metrics increase | Observium Flat annual fee (Professional: £250/year; Enterprise: £1,500/year) covers an unlimited number of devices, ports, and sensors |
Get support for niche or private-MIB hardware | PRTG Limited. Very obscure or private-MIB hardware may require a custom sensor built via scripting or the API | Observium Device and MIB support is extended directly by its community and vendor contributors |
Get alerted the moment a branch-office link drops | PRTG Sends the alert by email, SMS, or push notification to the on-call contact automatically Sed do eiusmod tempor incididunt ut labore | Observium Alert Checkers notify by email or webhook when a port or device status changes |
See bandwidth usage across switches and routers at a glance | PRTG Live and historical traffic graphs are built into every bandwidth sensor | Observium SNMP-based traffic data is stored and graphed via RRDTool |
Understand how your devices connect and depend on each other | PRTG PRTG UVexplorer, a separate product whose data is surfaced inside PRTG, provides automatic Layer 2 and Layer 3 topology maps, dependency visualization, asset inventory, and configuration backup and comparison, refreshed through scheduled discoveries. | Observium Builds network maps using CDP, LLDP, and FDP discovery protocols |
PRTG uses sensor-based licensing: you pay for what you're actually monitoring, not a flat fee that stays the same whether you're watching five metrics or five hundred. Every PRTG license, from the smallest to the largest, includes the full feature set, alerting, routing-protocol support, and the complete sensor library, with no separate module or edition needed to unlock them. That's a different model from Observium's flat annual fee per edition, where several of those same capabilities sit behind a higher tier.
| License Name | License description | Price | License Details | Get started | Pricing Details | |
|---|---|---|---|---|---|---|
| PRTG 500 | $200 | per month paid annually | Buy nowBuy now | Enough to monitor multiple aspects of 50 devices | ||
| PRTG 1000 | $358 | per month paid annually | Buy nowBuy now | Enough to monitor multiple aspects of 100 devices | ||
| PRTG 2500 | $742 | per month paid annually | Buy nowBuy now | Enough to monitor multiple aspects of 250 devices | ||
| PRTG 5000 | $1,300 | per month paid annually | Buy nowBuy now | Enough to monitor multiple aspects of 500 devices | ||
| PRTG 10000 | $1,642 | per month paid annually | Buy nowBuy now | Enough to monitor multiple aspects of 1000 devices |
“The reactivity, know-how, and technical solutions of Paessler are outstanding in every situation. For me, no monitoring tool compares to PRTG.”
PRTG brings every device, sensor, and alert into one web interface, from the moment auto-discovery finishes its first scan. The views below are real monitoring screens: an overview, a sensor detail, an alert setup, and a map, exactly as a new installation looks. None of it requires a professional services engagement or custom development to get running.
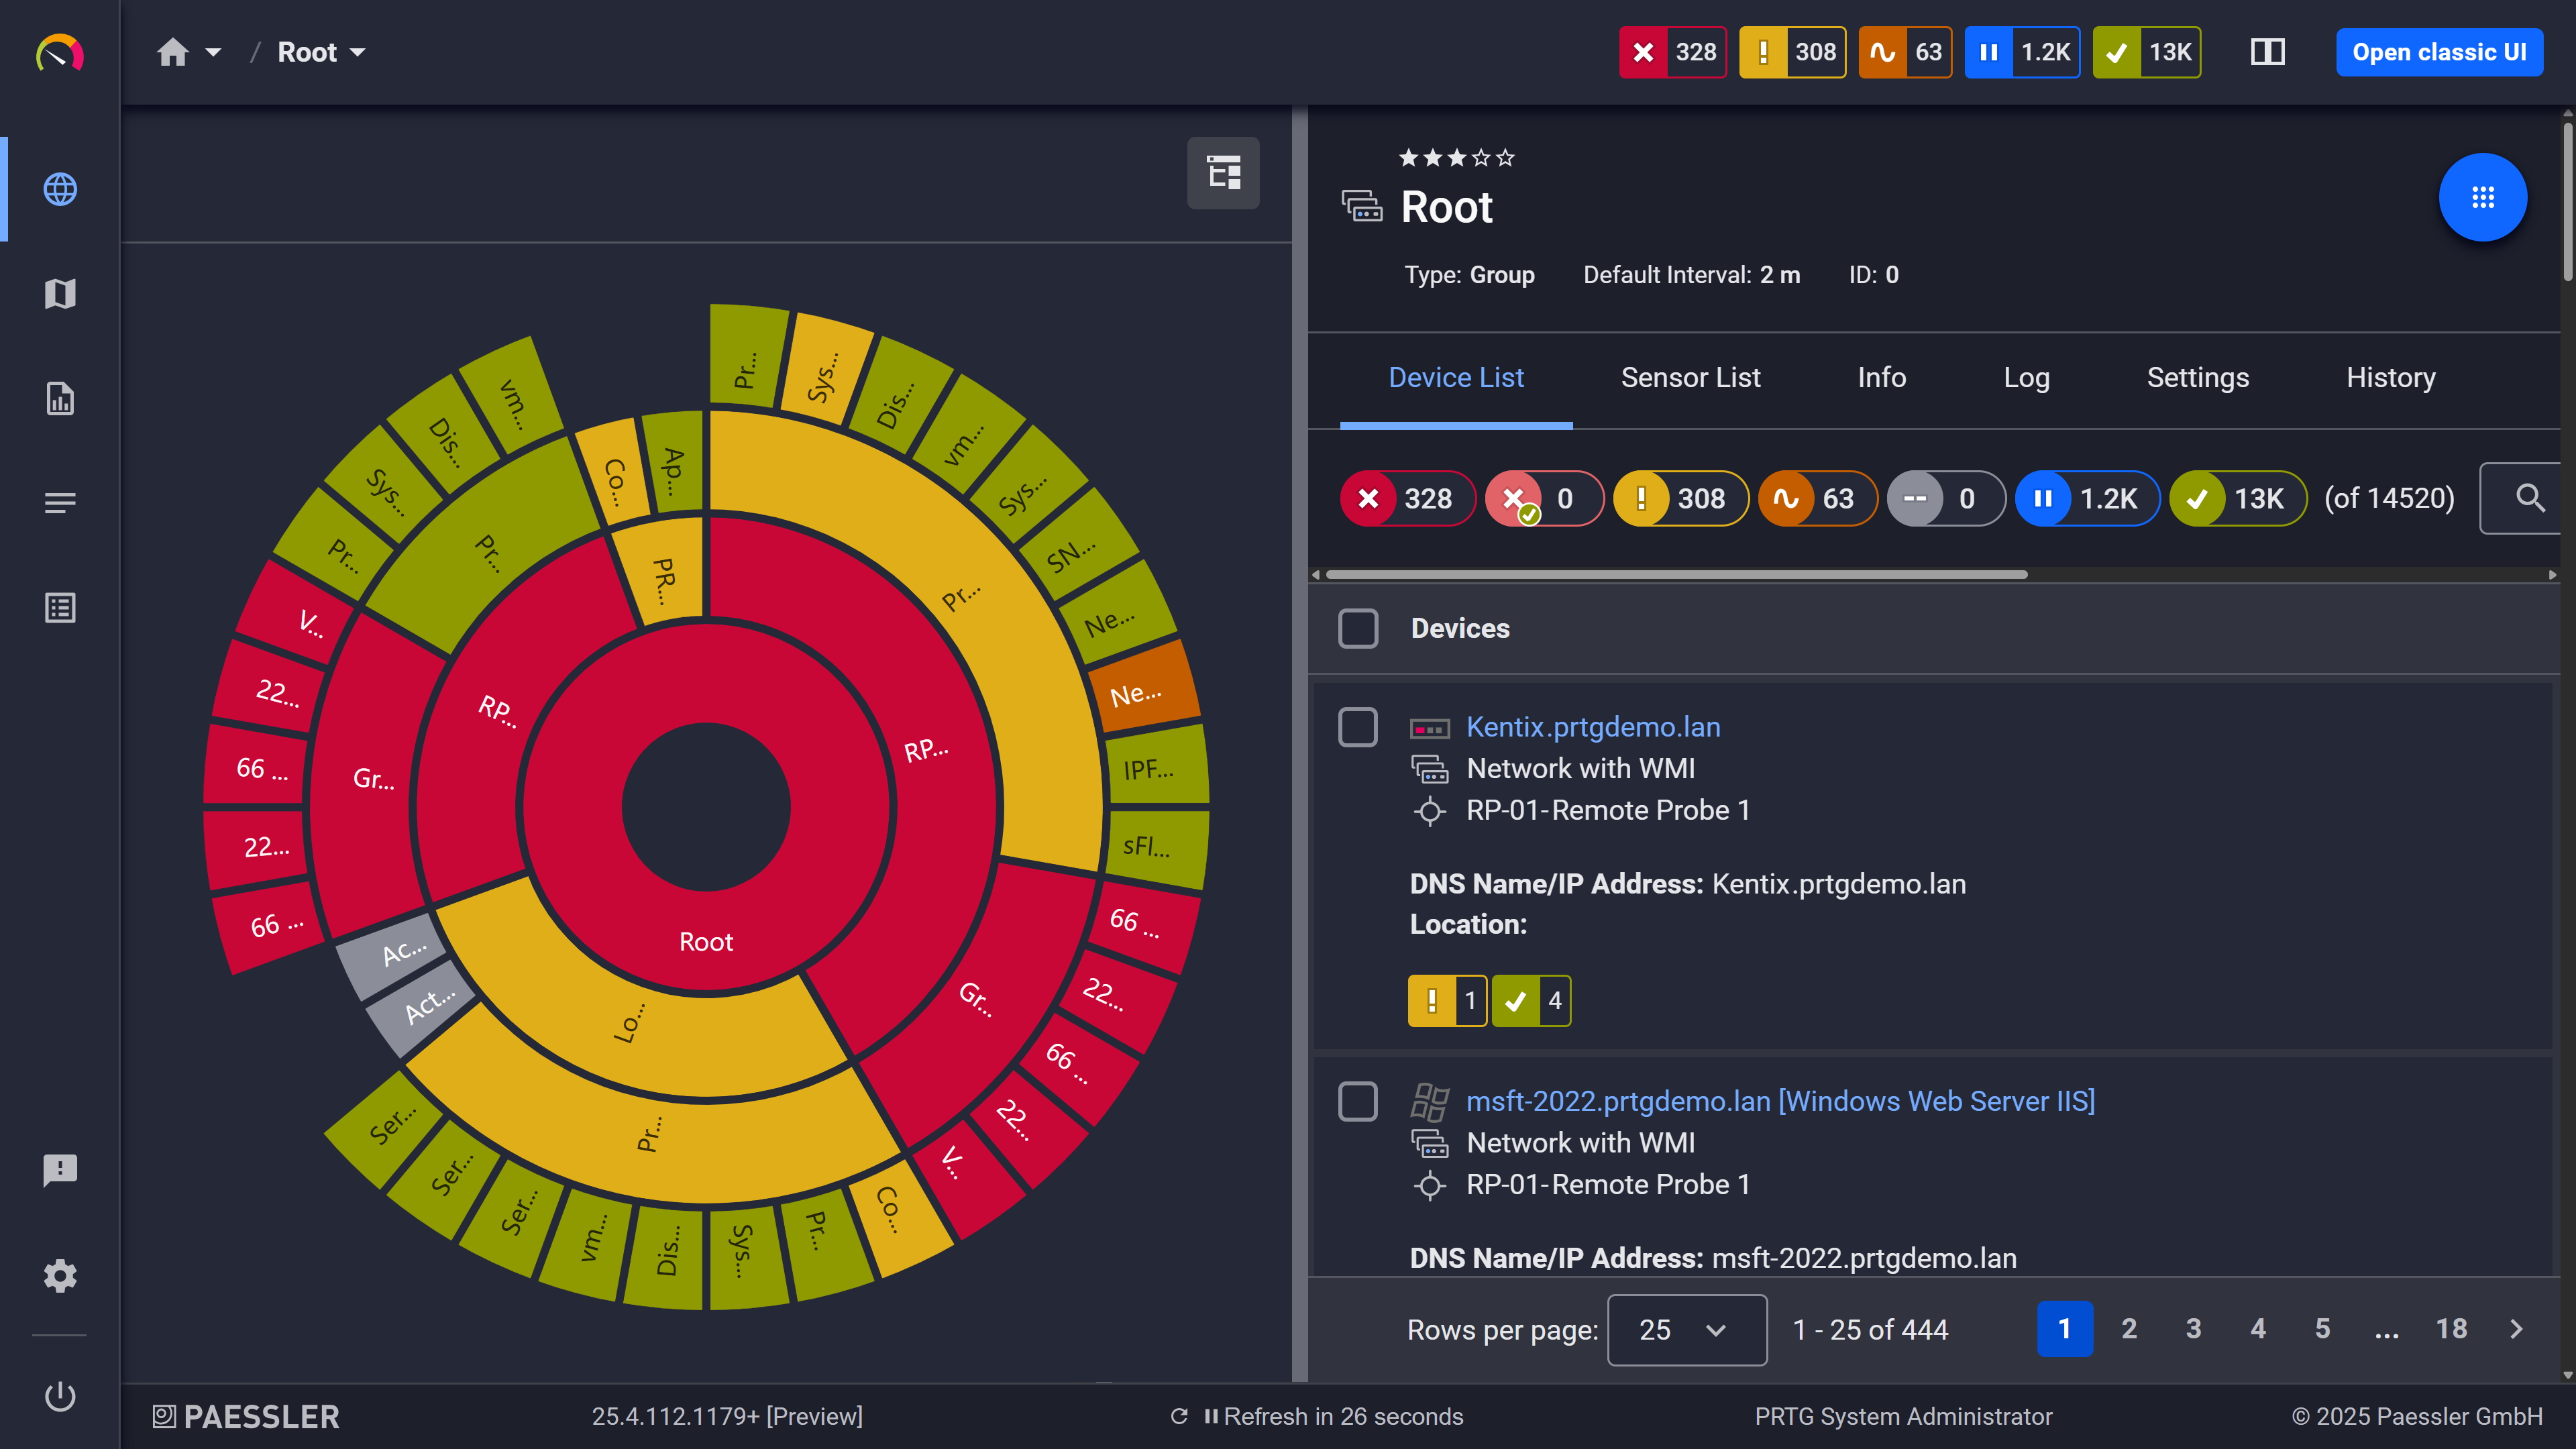
Custom dashboard: your easy-to-grasp overview built from your own sensors
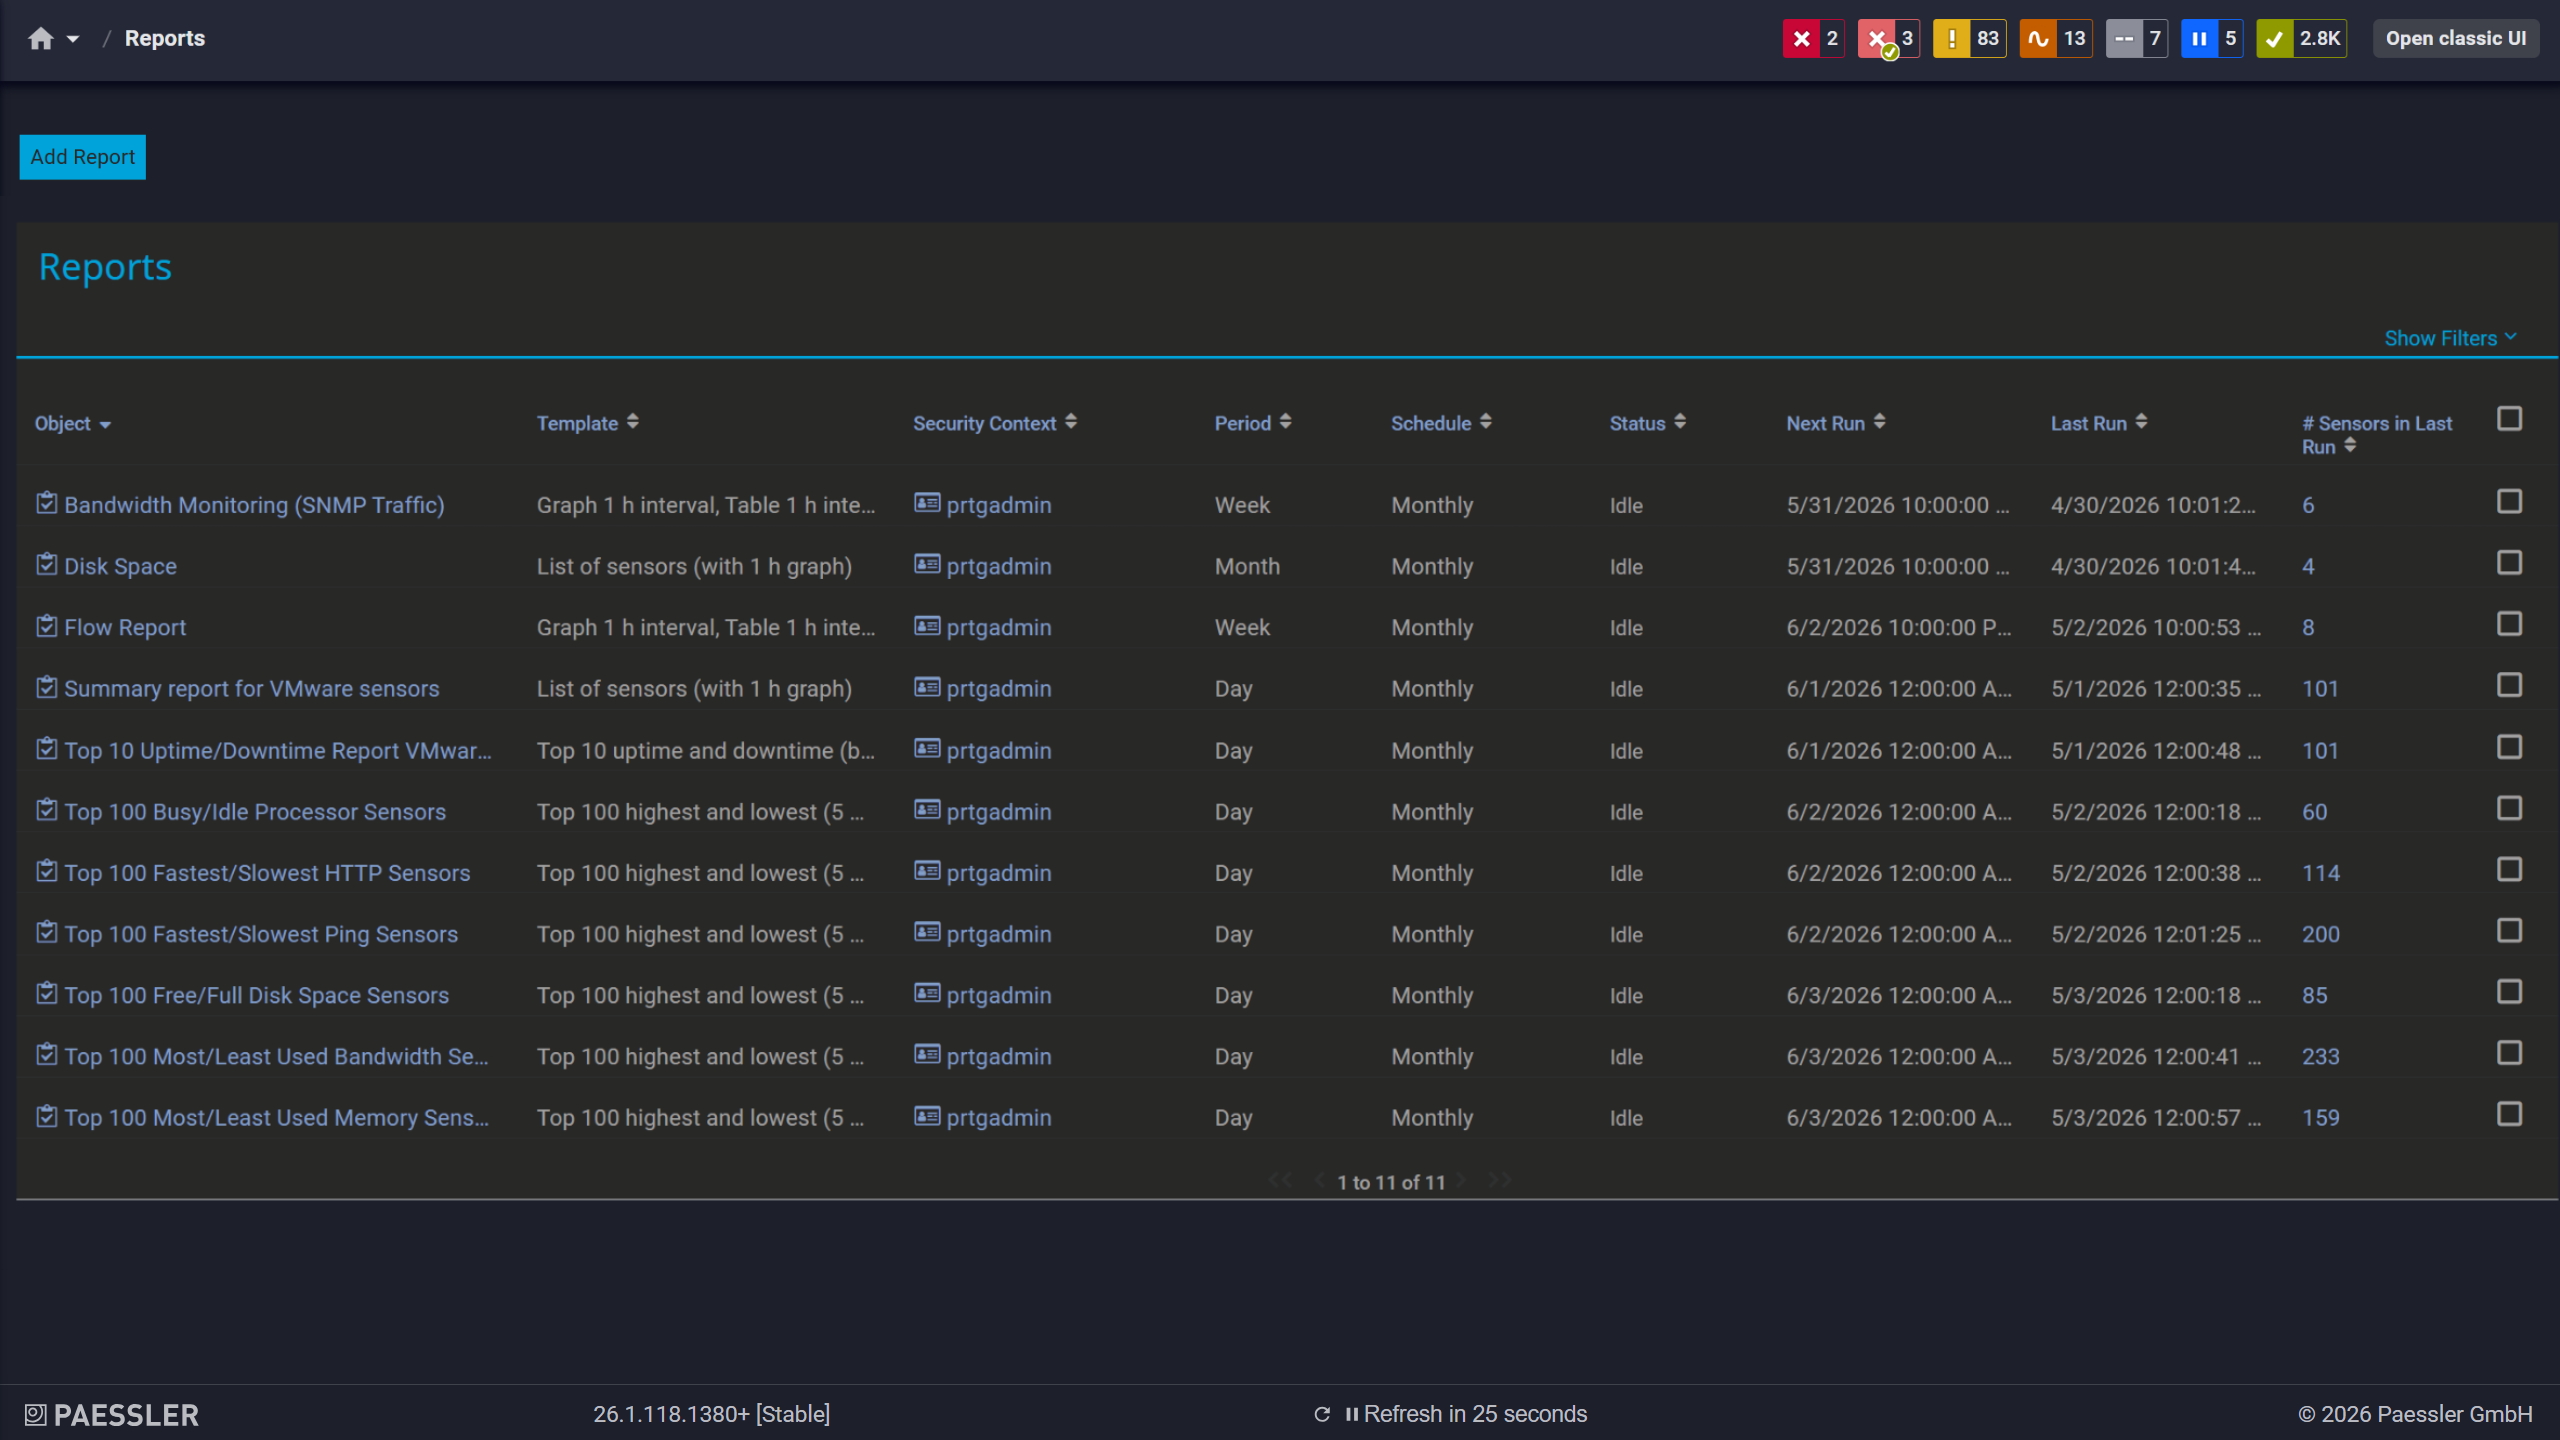
PRTG report screen: See all the reports generated and available to you in one easy to grasp overview
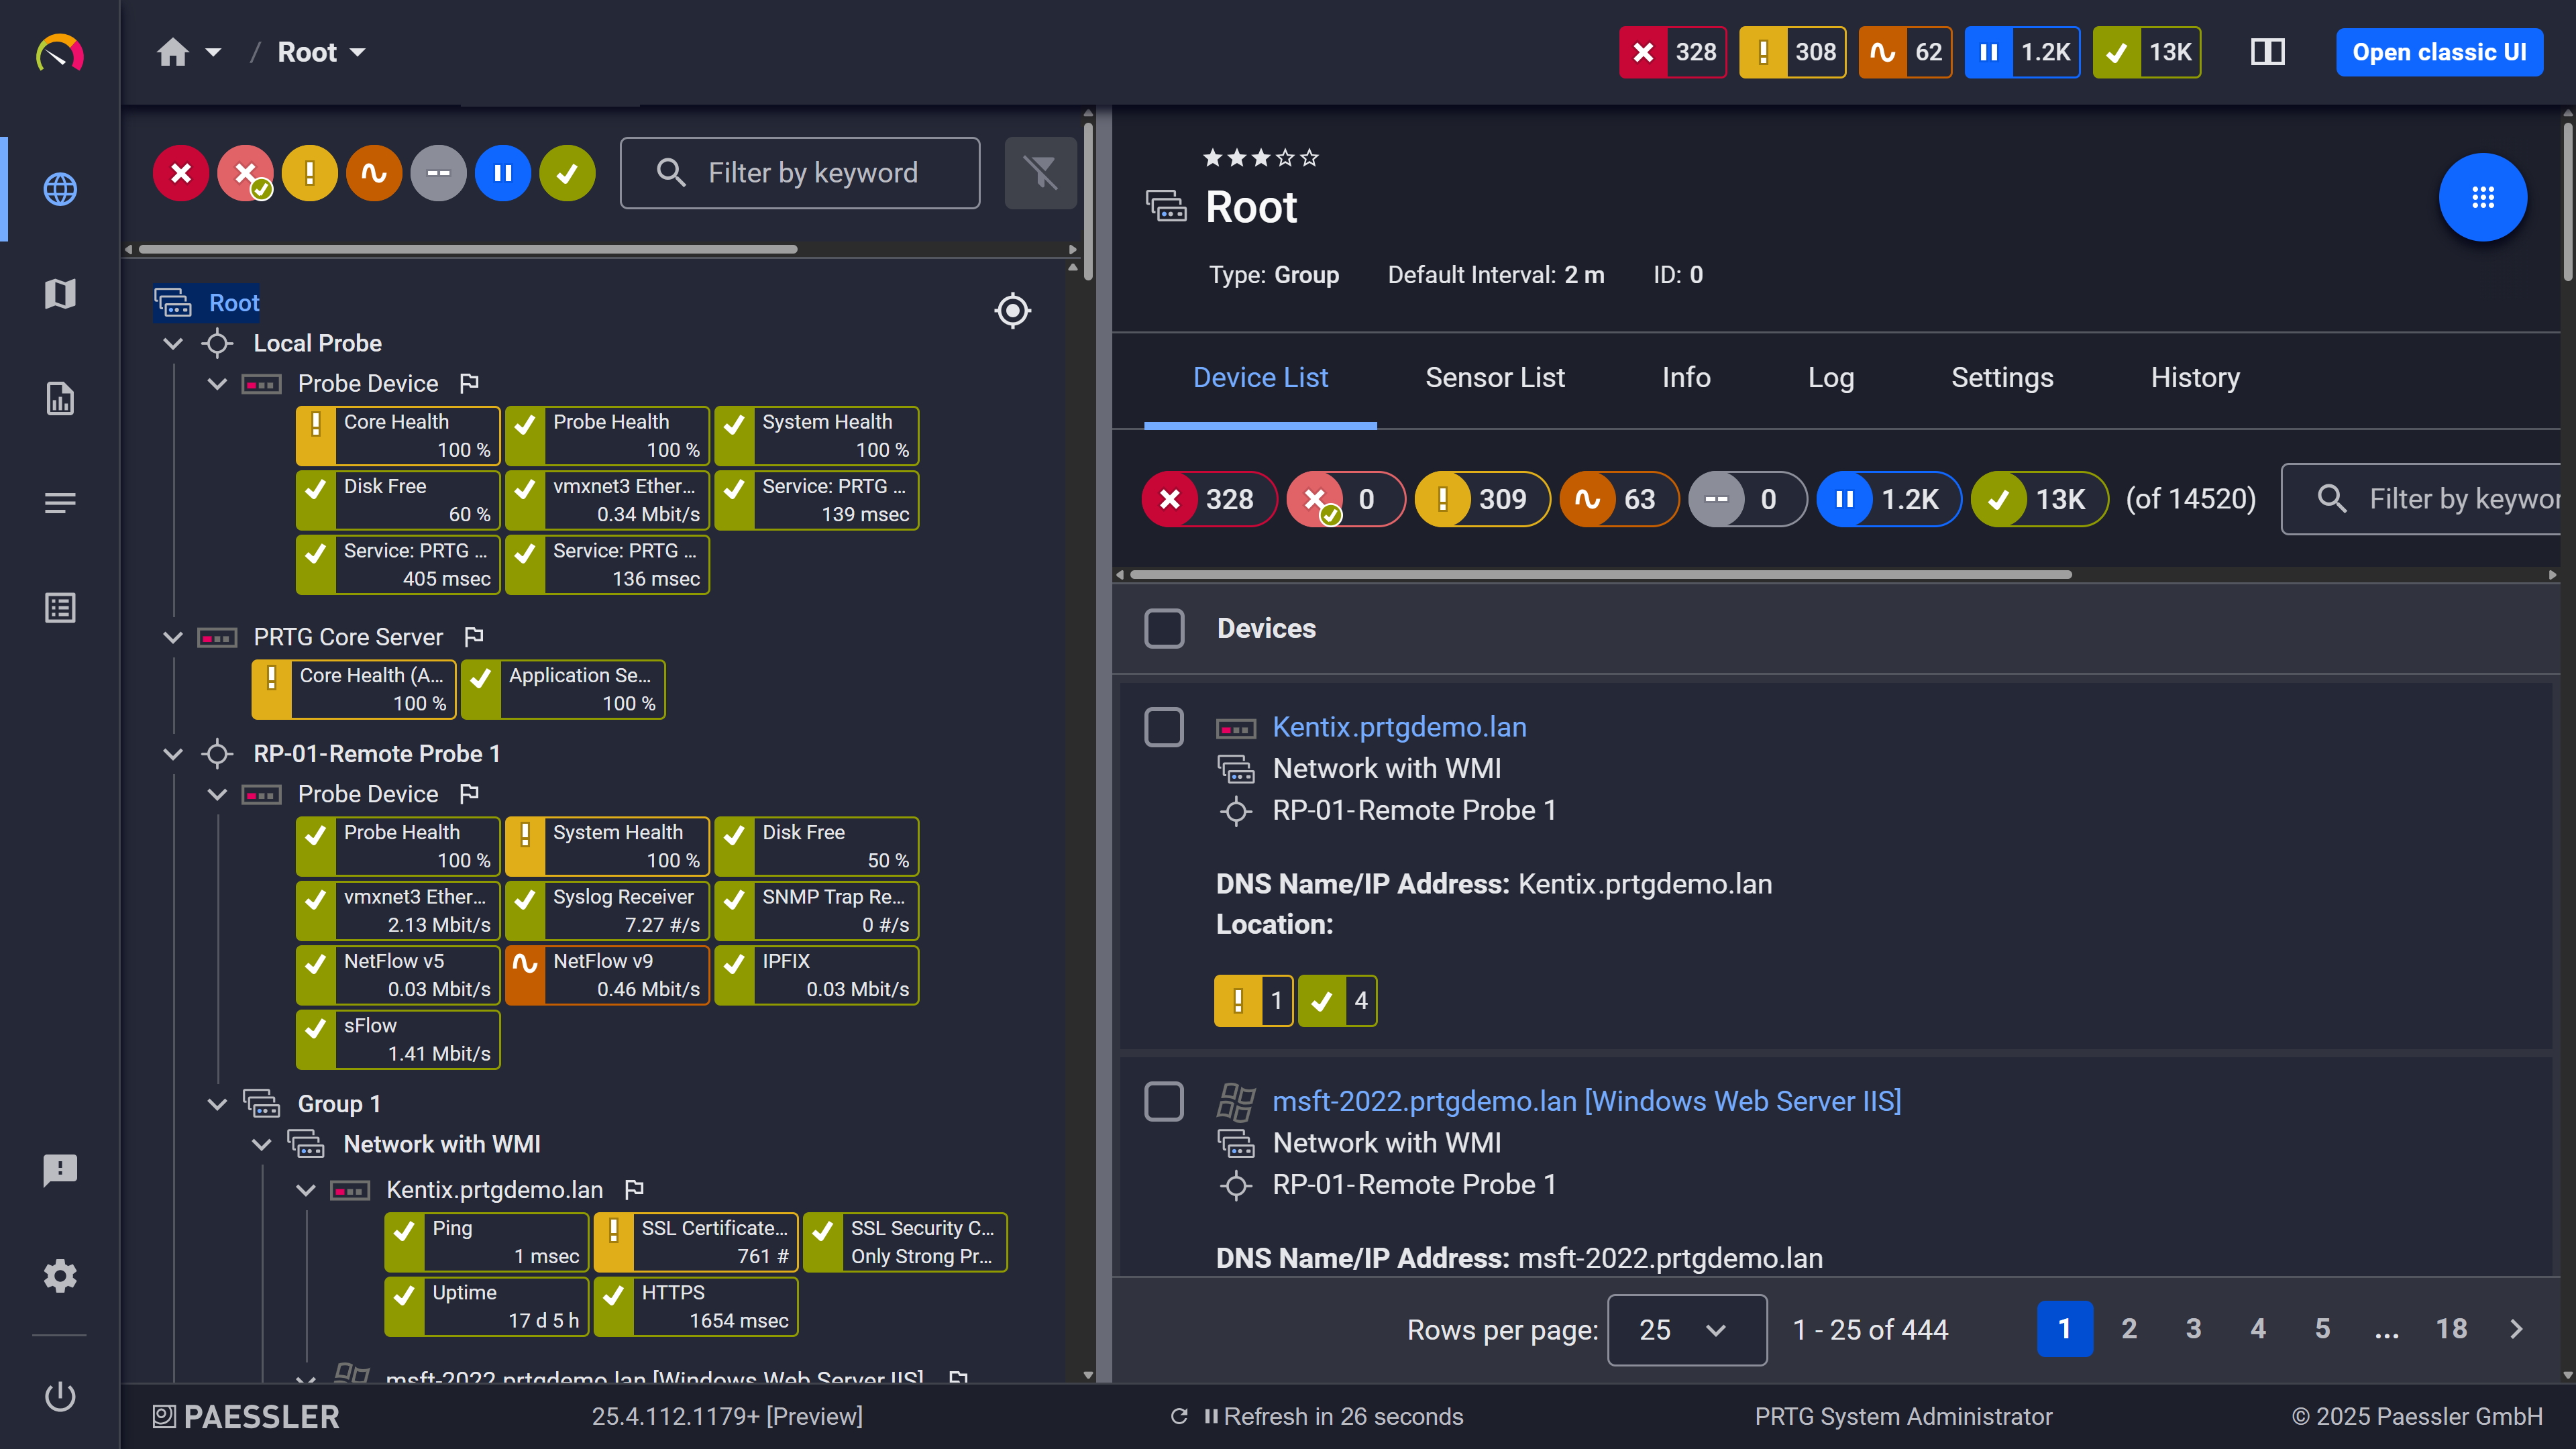
Device tree view: your full infrastructure, organized automatically after auto-discovery
Switching to PRTG follows one simple principle: your live network is the source. PRTG's auto-discovery reads what actually exists and rebuilds your monitoring directly from it. Four steps take you from your current setup to a running PRTG installation.
Have a list of hostnames or IP addresses of your current device. This can be from your own documentation, or get it from your current monitoring tool. In Observium, export your device list from the device inventory page's data tab, or pull it directly via the Observium API. This list is your completeness checklist for the entire switch. Then install PRTG alongside your current tool: both can run in parallel during the transition.
Let auto-discovery rebuild your monitoring. Enter your IP ranges and device credentials (e.g. for protocols like SNMP or WMI). PRTG's auto-discovery scans the network segments, identifies device types, and creates suitable sensors from built-in device templates. The rebuild comes from your live network, so it reflects what is really there. Compare the result against your device list from step 1 and add any sensors auto-discovery could not infer.
Translate concepts, not configurations. What you know maps cleanly to PRTG. Devices stay devices, entities such as ports, processors, memory pools, and hardware sensors become PRTG sensors, and alert checkers become PRTG notification triggers. Then recreate your alerting workflows with PRTG's notification templates and triggers.
Run both systems in parallel and tune. Compare alerts side by side for a few weeks. Adjust thresholds and schedules, and build the maps and reports your team and leadership rely on. Decommission the old tool once PRTG has proven itself in daily operation.
A tool switch is the ideal moment to find out what your old setup wasn't watching. Paessler PRTG UVexplorer, a separate product whose data is surfaced inside PRTG, runs scheduled discoveries that build a multi-vendor topology map and asset inventory of what actually exists on your network. Compare that inventory against what Observium was monitoring, and close any blind spots before they carry over. After cutover, the same point-in-time snapshot confirms that your PRTG rebuild caught everything.
No. LibreNMS started in 2013 as a community fork of Observium, created after Observium moved to a paid Community and Professional licensing split. The two platforms share early technical roots but have developed independently since, so a search for one doesn't necessarily mean the other. If you're evaluating open-source, SNMP-based tools alongside PRTG, it helps to know which of the two you're actually comparing.
Observium Community is free and open-source, but it only receives infrequent batch updates, roughly every six to twelve months, and has more limited alerting. Observium Professional and Enterprise add real-time updates, full alerting, routing-protocol metrics, and, at the Enterprise tier, the ability to scale across multiple servers, for an annual subscription fee. PRTG takes a simpler approach: every license tier includes the full feature set, with no separate paid tier required to unlock alerting or protocol support.
PRTG supports OT protocols including Modbus, OPC UA, and MQTT, with configuration to match your industrial environment, giving IT and OT a shared view in one dashboard. Observium is built around SNMP-based network and server monitoring and does not include native industrial protocol support. For sites running both corporate IT and plant-floor systems, PRTG can cover devices Observium isn't built to reach.
Observium's interface centers on SNMP data and a device inventory view, built for engineers comfortable working directly with raw network data. PRTG's web interface is built around dashboards, a device tree, and sensor-level drill-down, designed so a new user can find a device and read its status within the first few minutes. Both are functional tools built for technical users, the difference is mainly in how quickly a new team member gets oriented.
Yes. PRTG Hosted Monitor runs as a cloud service managed by Paessler, so there's no core server to install, patch, or maintain, you just log in and start monitoring. This differs from PRTG Network Monitor, which, like Observium, is self-hosted on your own infrastructure. Teams that want PRTG's auto-discovery and sensor library without any server ownership typically choose Hosted Monitor for exactly that reason.
Yes. Our 2026 customer survey also found that 92.8% of PRTG users rate their day-to-day monitoring experience as good or excellent, and PRTG holds a 4.7 rating on Gartner Peer Insights and 4.6 on G2. Those scores reflect production use across industries where downtime has real consequences, from manufacturing floors to hospital networks.
PRTG doesn't import Observium's configuration or historical data, auto-discovery rebuilds your monitoring setup fresh by scanning your network directly. This means a short setup step after switching, but it also means your new monitoring reflects your network exactly as it is today, not carried-over assumptions from the old tool. If you want to compare before and after, keeping Observium running in read-only mode during the transition is a common approach.
PRTG is a strong Observium alternative for teams that want one license covering network, server, and application monitoring, rather than a platform focused mainly on SNMP and network devices. It trades Observium's flat annual fee for sensor-based pricing tied to what's actually monitored, auto-discovery instead of manual device-definition tuning, and a sensor library maintained directly by Paessler. Which one fits better depends on how narrow or broad your monitoring scope is, and how much setup time your team has to spend on it.
We also compared PRTG with other monitoring tools:
Atera offers an all-in-one IT platform requiring agent installation, while PRTG provides flexible, agentless monitoring with budget-friendly sensor-based pricing.
Lansweeper focuses on device inventory; PRTG provides comprehensive network monitoring with real-time insights plus hardware/software detection and custom sensors for advanced asset integration.
eG Innovations offers advanced application performance monitoring and virtualization capabilities, but its complex pricing and need for manual configuration can make costs unpredictable and integration challenging.
NinjaOne focuses on endpoint management with per-device pricing. PRTG delivers comprehensive infrastructure monitoring with transparent sensor-based pricing and agentless capabilities.
Start a 30-day trial with unlimited sensors, no commitment required.
Tell us your device count and we'll send you a quote.
See PRTG in a live demo with one of our monitoring experts.
