• Company
    • About Us
    • Case Studies
    • Press Center
    • Careers
    • Blog
    • Contact us
  • Contact us
  • Login
 
  • English
    • Deutsch
    • Español
    • Français
    • Italiano
    • Português
Paessler
                    - The Monitoring Experts
  • Products
    • Paessler PRTG
      Paessler PRTGMonitor your whole IT infrastructure
      • PRTG Network Monitor
      • PRTG Enterprise Monitor
      • PRTG Hosted Monitor
      • PRTG UVexplorer
      • PRTG extensionsExtensions for Paessler PRTGExtend your monitoring to a new level
    • Icon Features
      FeaturesExplore all monitoring features
      • Maps & dashboards
      • Alerts & notifications
      • Multiple user interfaces
      • Distributed monitoring
      • Customizable reporting
  • Solutions
    • Industries
      IndustriesMonitor various industry sectors
      • Industrial
      • Healthcare
      • Data Center
      • Education
      • Finance
      • Government
    • IT Topics
      IT TopicsMonitor all areas of IT
      • Network Monitoring
      • Bandwidth Monitoring
      • SNMP Monitor
      • Network Mapping
      • WiFi Monitoring
      • Server Monitoring
  • Pricing
  • Resources
    • Getting Started
      Getting StartedModules for self-paced learning
    • How-to Guides
      How-to GuidesGet the most out of PRTG
    • Videos & Webinars
      Videos & WebinarsLearn from Paessler experts
    • IT  Knowledge
      IT KnowledgeExpand your IT knowledge
    • PRTG Manual
      PRTG ManualFull documentation
    • Knowledge Base
      Knowledge BaseShare community knowledge
    • PRTG Sensor Hub
      PRTG Sensor HubGet sensors, scripts & templates
    • Trainings
      PRTG TrainingLearn how to work with PRTG
  • Partners
    • Icon Handshake
      Become a PartnerFor resellers and channel partners
    • Icon MSP
      Become an MSPDeliver monitoring as a managed service
    • icon partner
      Partner PortalLog in to your partner account
    • Deal Registration
      Deal RegistrationRegister your sales opportunities
    • icon search
      Find a PartnerFind partners selling Paessler products
    • icon technology
      Technology AlliancesSee Paessler technology partnerships
    • Partner HubTools for Your Success
  • Company
    • About Us
    • Case Studies
    • Press Center
    • Careers
    • Blog
    • Contact us
  • Contact us
  • Login
  • English
    • Deutsch
    • Español
    • Français
    • Italiano
    • Português
  • Get a quote
  • Free trial

Complete Amazon RDS Monitoring 

Track database performance, connections, and resource usage across all your RDS instances in one dashboard 

Free download
PRODUCT OVERVIEW

How do you monitor Amazon RDS performance without jumping between CloudWatch consoles?  

Amazon RDS takes the operational overhead of running databases off your plate, but performance visibility is still your responsibility. CPU spikes, connection exhaustion, storage running low, replication lag on read replicas: CloudWatch captures all of it, but pulling that data into something actionable across multiple instances and regions takes more work than it should.

PRTG connects to CloudWatch via the AWS API and collects RDS metrics directly, no agents and no manual console checks required. The AWS RDS v2 sensor surfaces CPU utilization, IOPS, storage consumption, database connections, and latency in real-time dashboards with threshold-based alerting. Setup needs IAM credentials with read access to CloudWatch and RDS; the exact required policy is documented in Paessler's Knowledge Base. Supported engines: MySQL, PostgreSQL, MariaDB, Oracle, Microsoft SQL Server, and Amazon Aurora in both MySQL-compatible and PostgreSQL-compatible versions.

Download PRTG Trial

What you will find on this page

  • RDS Performance Under Control
  • How PRTG Monitors RDS
  • Manual RDS Monitoring vs. PRTG
  • FAQs

PRTG is compatible with all major vendors, products, and systems

compatible with all major vendors, products, and systems

RDS Performance Under Control, Across Every Instance

Catch Performance Degradation Before Users Notice

When an Amazon RDS instance slows down, you're often the last to know. By the time users report application lag, the impact is already there. Without real-time visibility into CPU spikes, IOPS bottlenecks, or connection exhaustion, troubleshooting becomes a guessing game instead of a structured root cause analysis.

PRTG pulls rds metrics from CloudWatch and surfaces them in real-time dashboards. You define thresholds for CPU utilization, disk queue depth, or database connections, and PRTG fires a notification the moment metrics cross those limits, before application performance takes a hit.
  • Real-time CPU utilization and credit usage monitoring
  • IOPS and latency tracking to spot storage bottlenecks early
  • Database connections monitoring with configurable thresholds
  • Automated alerts when metrics exceed your defined limits
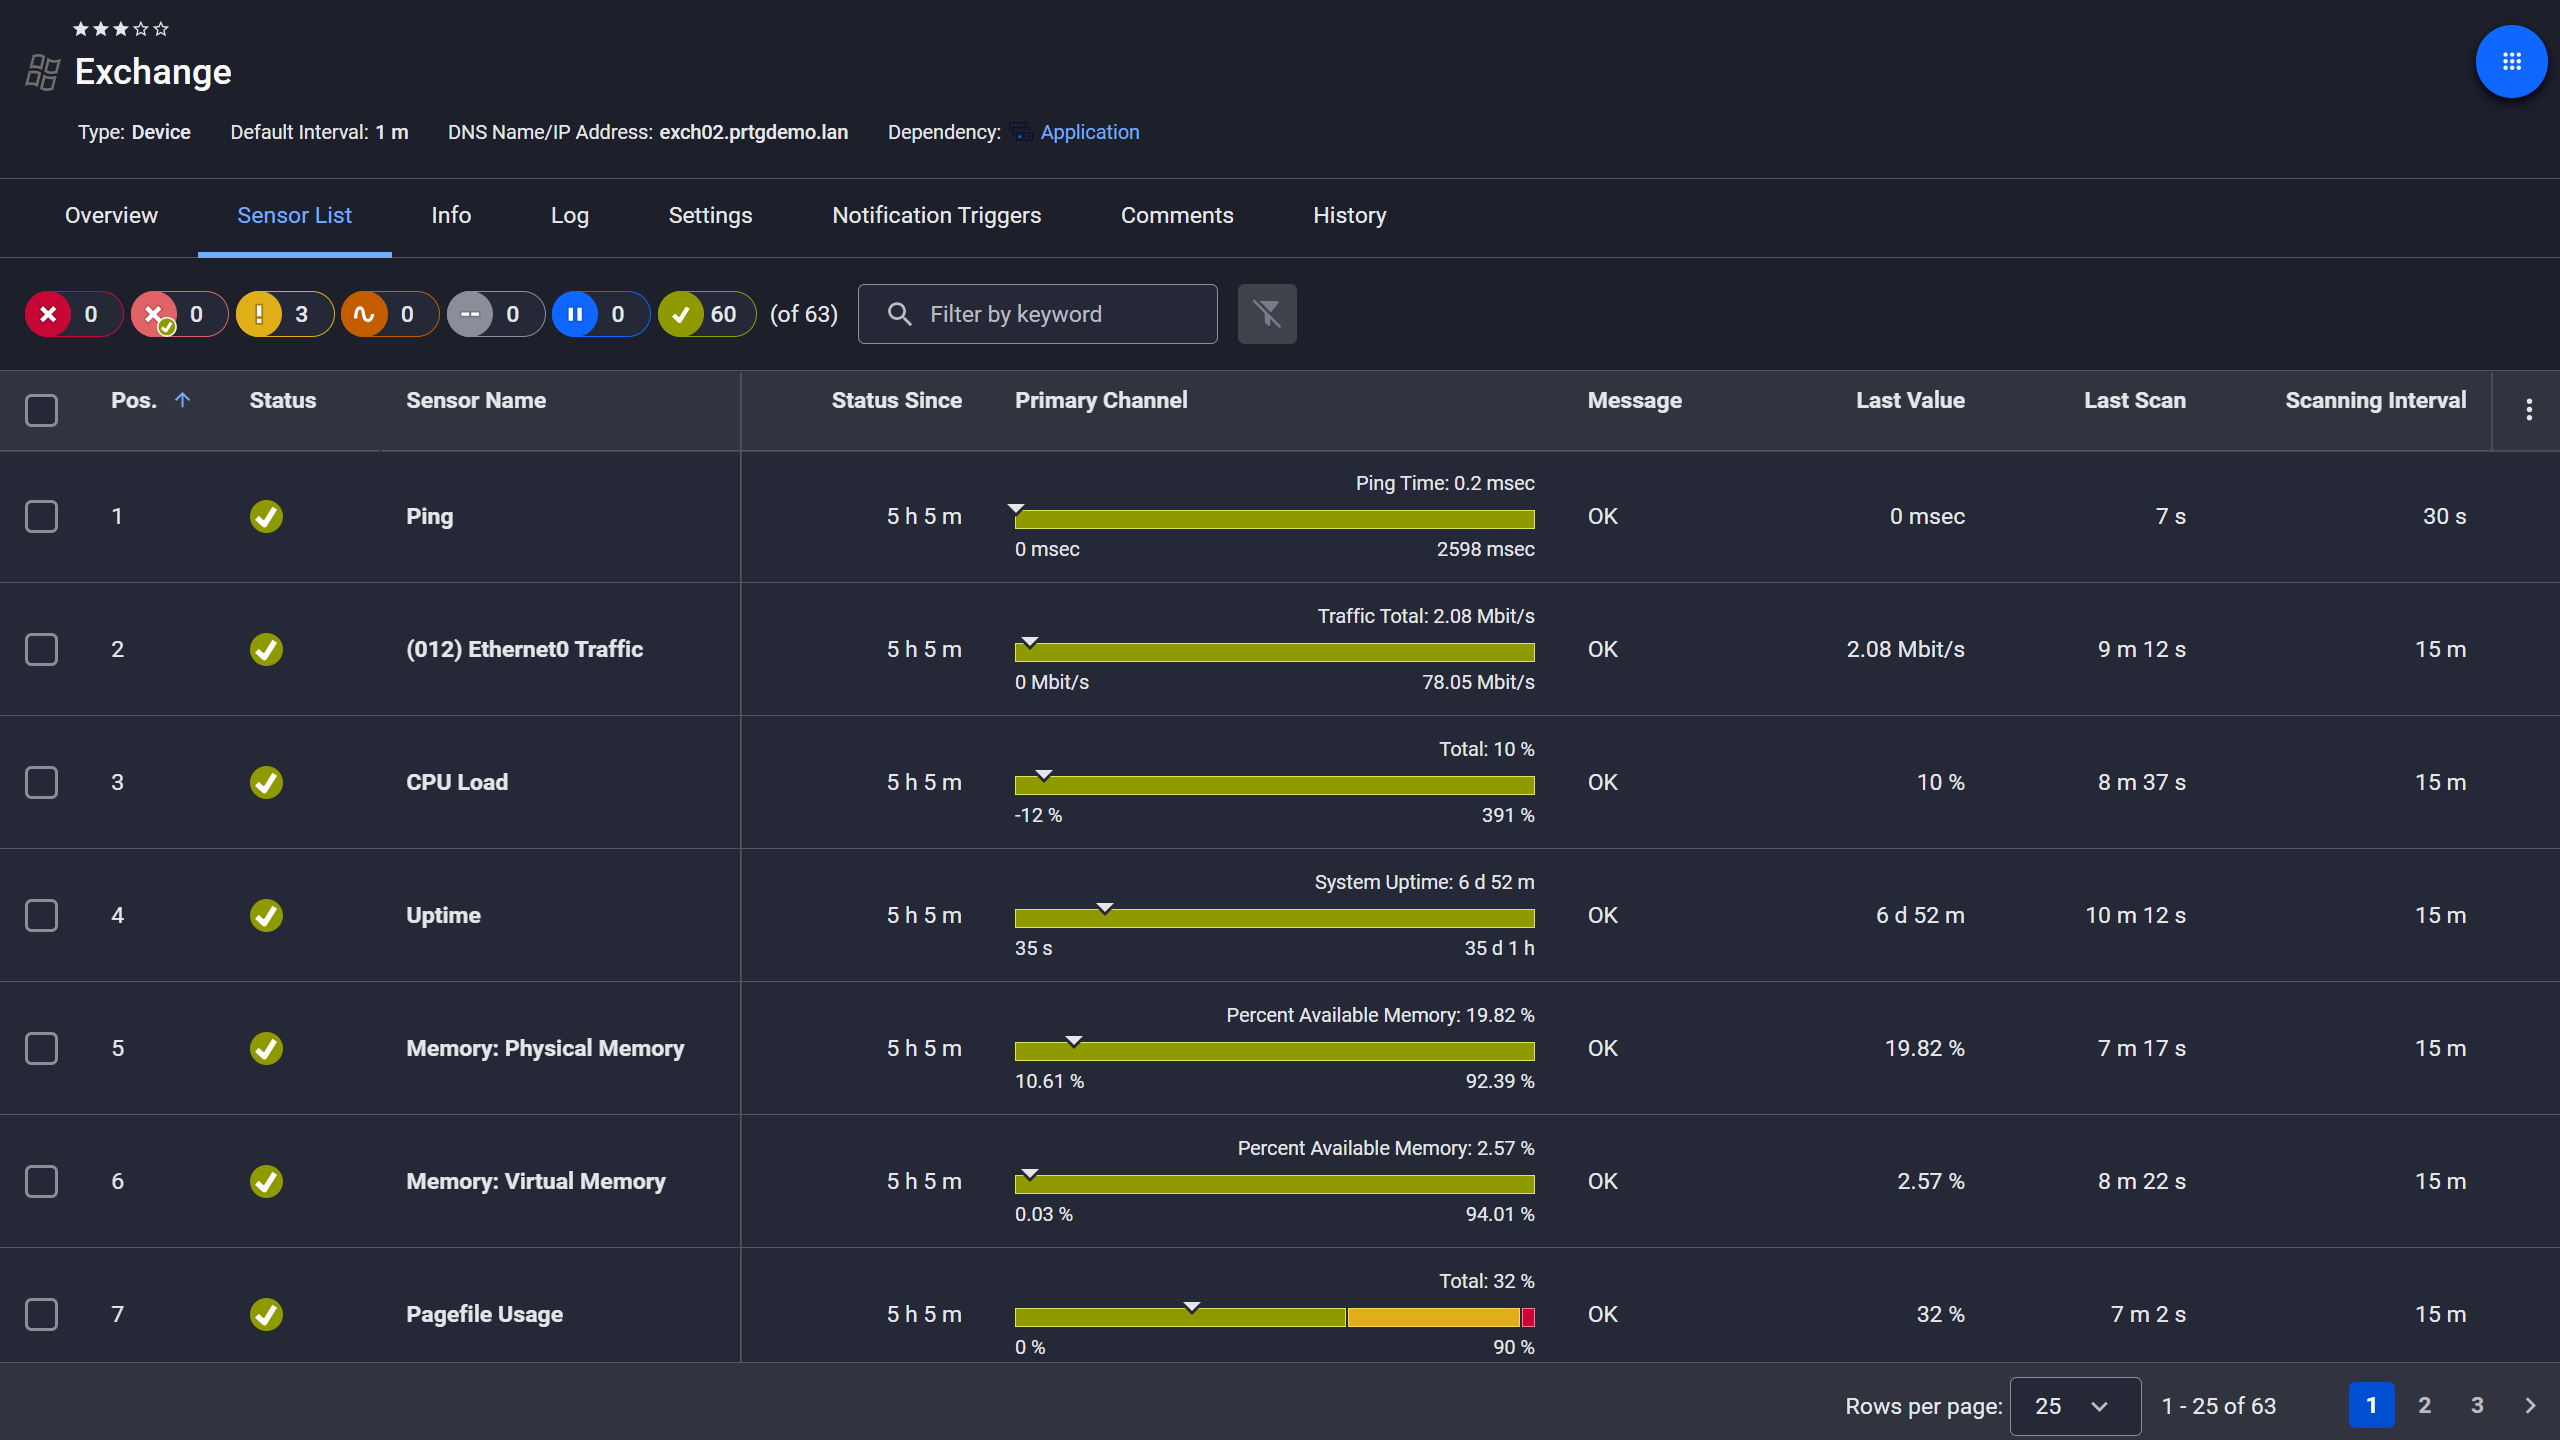
PRTG device view showing sensor list for a monitored Microsoft Exchange server

Exchange server, fully under control

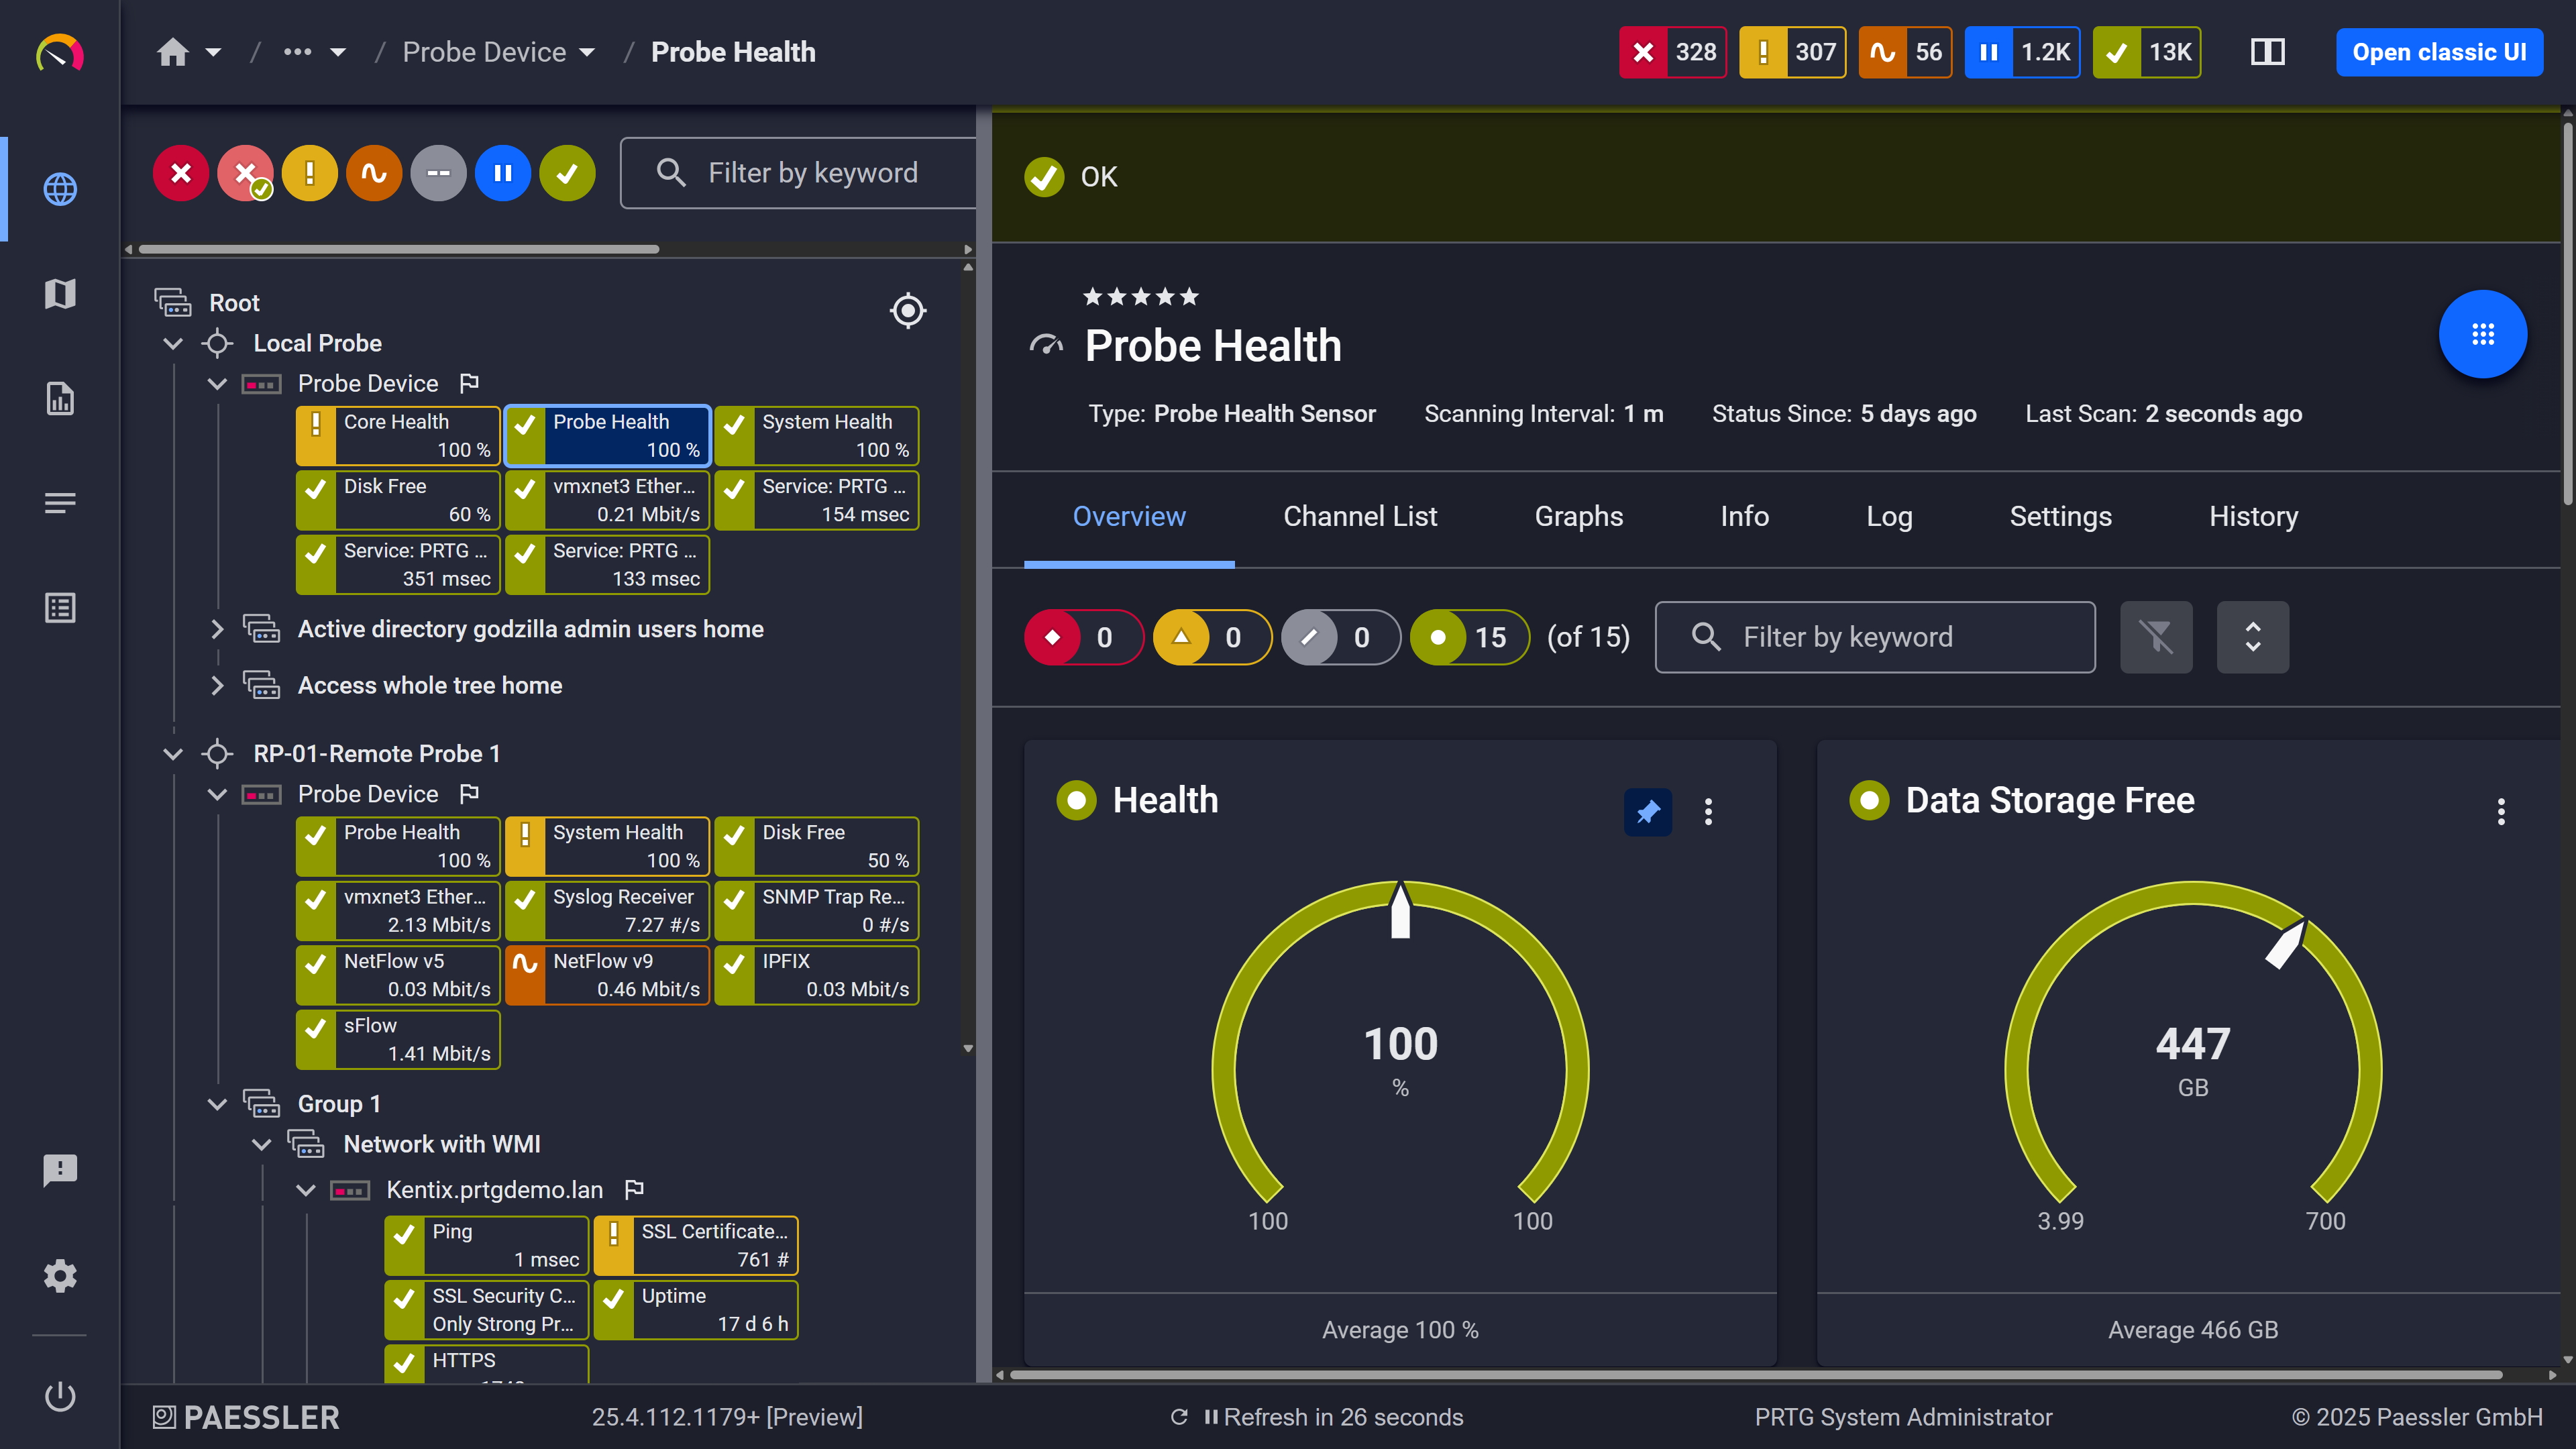
PRTG web interface showing Probe Health sensor with health and storage gauge widgets

Probe health at a glance

PRTG web interface showing live performance graphs for a Probe Health sensor

Live graphs, real-time performance data

Monitor Multi-Region and Multi-Engine Instances from One Place 

Running DB instances across multiple AWS regions, or mixing MySQL in one environment with PostgreSQL in another, means constantly switching between CloudWatch consoles. That context switching adds up. Also it creates gaps where things slip through unnoticed.

PRTG consolidates performance data from all your Amazon RDS instances into a single dashboard. One view covers MySQL, PostgreSQL, Oracle, SQL Server, MariaDB, and Amazon Aurora across every AWS region you're monitoring. You get cross-region RDS performance visibility without building anything custom.

  • Unified dashboard for all DB instances across regions
  • Support for all major RDS database engines in one view
  • Cross-region performance comparison
  • Historical trend data to optimize capacity planning

See Why IT Professionals Trust PRTG

Start monitoring your infrastructure in minutes. No professional services, no complex configuration, no risk.

Free download
PRODUCT OVERVIEW

Stop Manually Checking Storage and Connection Limits 

Hitting a storage limit or exhausting available database connections causes outages. Manually checking free disk space, memory, or active connections across dozens of RDS instances isn't a workflow, it's a liability, especially when databases grow at different rates and on different schedules.  

PRTG automatically collects storage, memory, and connection metrics from CloudWatch at regular intervals. When free storage drops toward a threshold or connection counts approach max_connections you get a notification with time to act. Not after writes start failing.  
  • Free disk space and file system usage monitoring
  • Freeable memory tracking
  • Active database connection counts
  • Proactive alerts before resource exhaustion
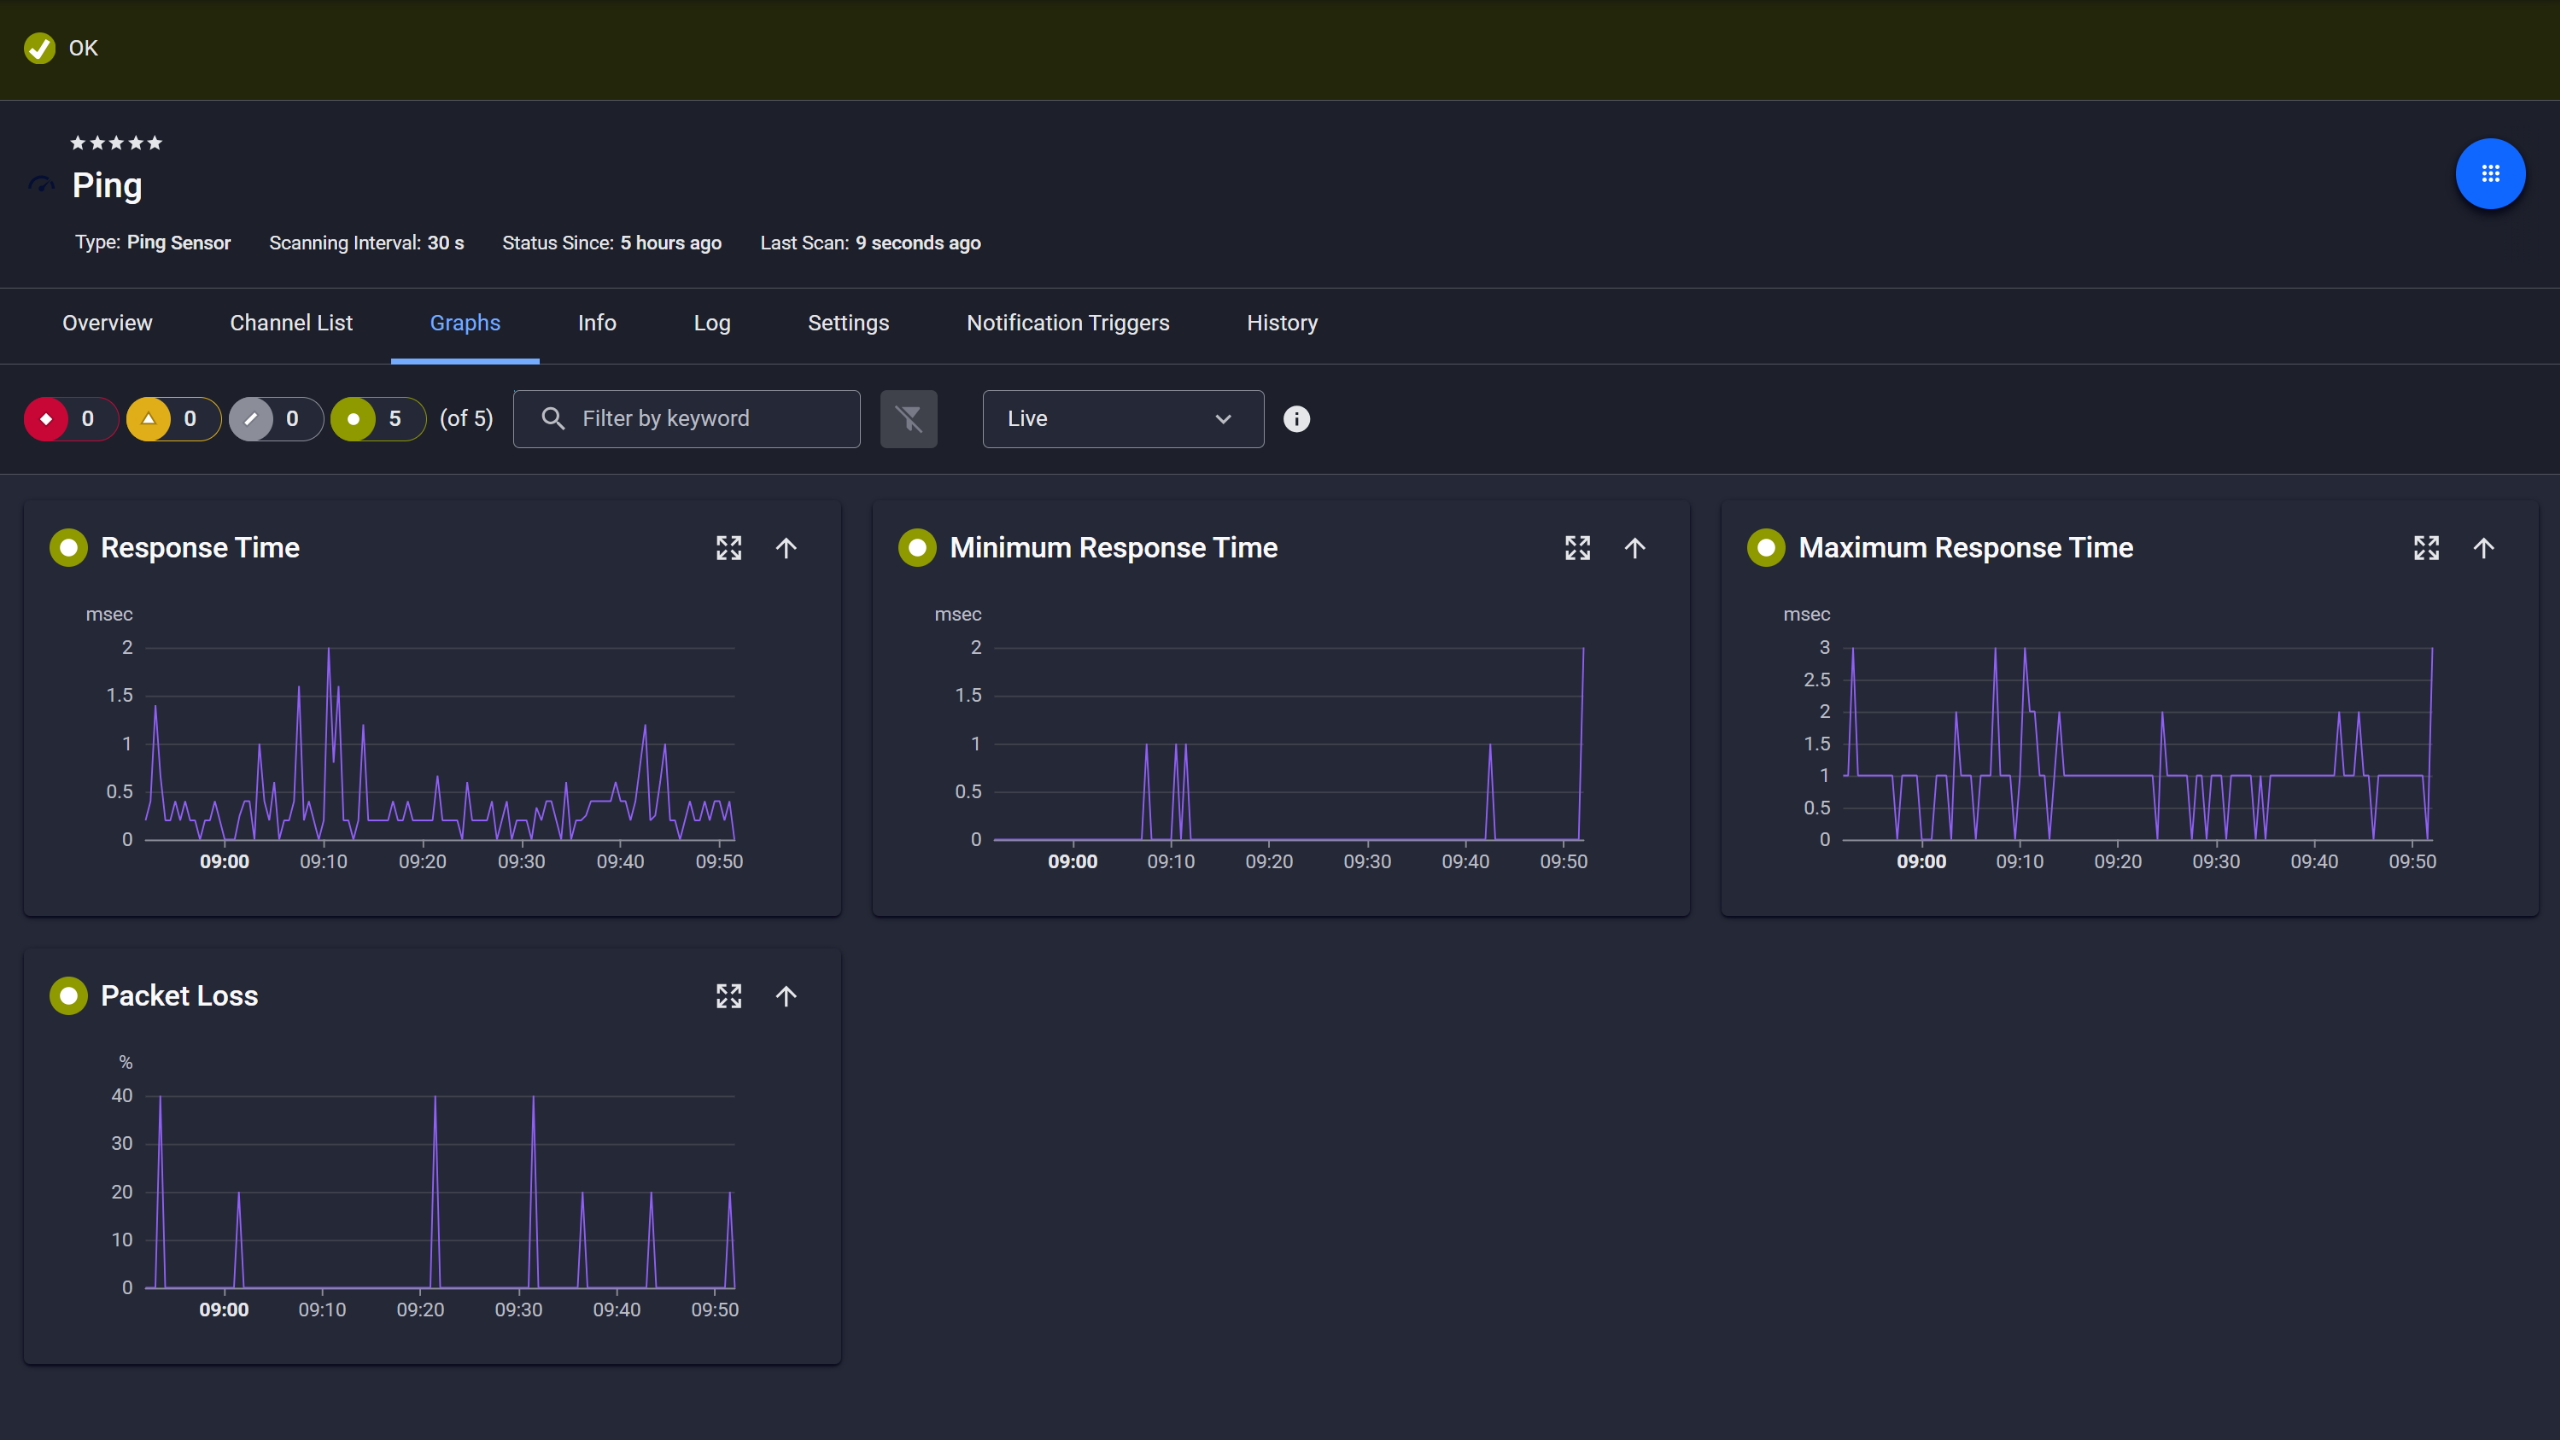
PRTG Ping sensor graphs showing response time, min, max, and packet loss over time

Ping response and packet loss

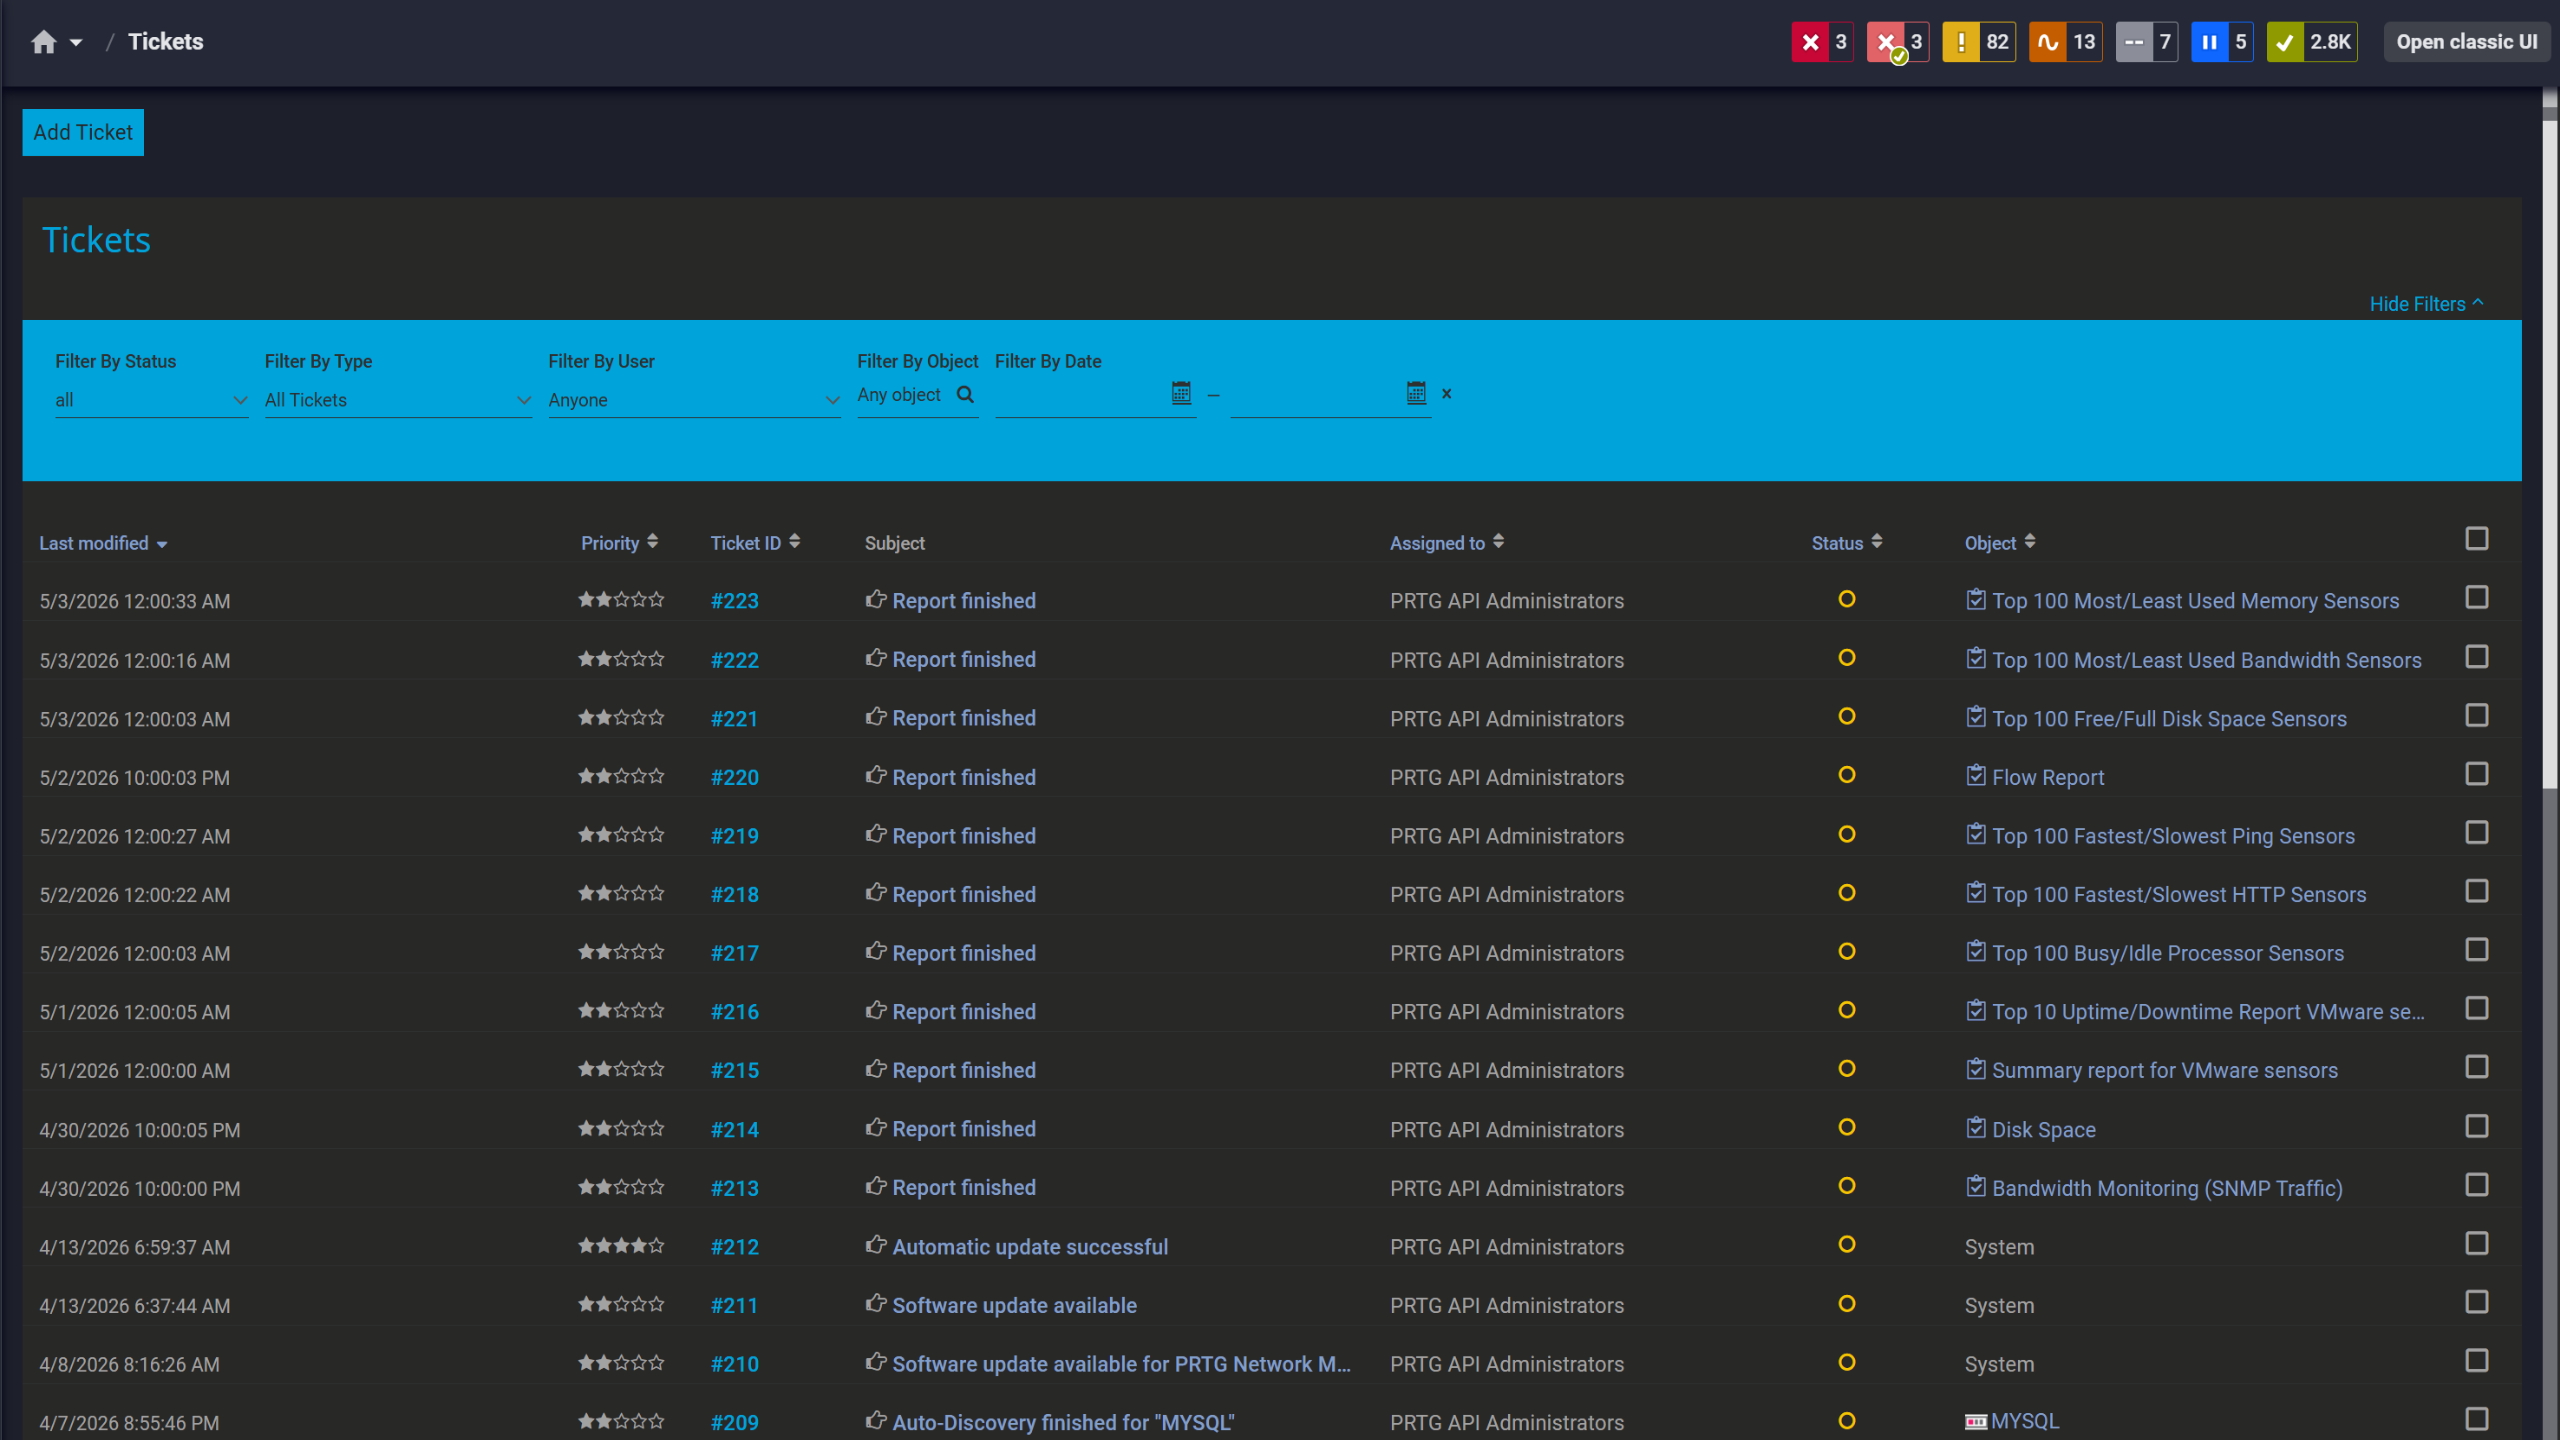
PRTG tickets list showing system notifications, report completions, and update alerts

Tickets keep your team aligned

PRTG web interface showing device tree and full device list with sensor status badges

Full device list, instant overview

Identify Network and Replication Bottlenecks 

Network throughput issues or replication lag can degrade database performance without any obvious signal. Without monitoring network receive and transmit rates alongside read replica metrics, you won't spot bandwidth saturation or write latency spikes until applications start behaving strangely.

PRTG monitors network traffic and replication-related cloudwatch metrics, and surfaces changes in throughput patterns or unusual latency as soon as they appear. That visibility matters most in environments running read replicas across availability zones.

  • Network throughput monitoring (receive and transmit)
  • Read and write latency tracking
  • Bin log disk usage for replication monitoring
  • Trend analysis for baseline comparison

How PRTG Monitors Amazon RDS  

PRTG uses the AWS RDS v2 sensor to collect performance metrics from Amazon CloudWatch via the AWS API. Below is an overview of how that works technically. 

CloudWatch API Integration 

PRTG connects to your AWS account using IAM credentials and queries CloudWatch monitoring metrics through the AWS API. The sensor requires read permissions for CloudWatch and RDS. You configure the AWS access key and secret key once in PRTG then the sensor polls CloudWatch at your configured interval. Worth noting: the minimum scanning interval for this sensor is 5 minutes, fixed, regardless of your global PRTG settings. For the exact required IAM policy, refer to Paessler's Knowledge Base article on AWS API key permissions.

Metrics and Channels 

The AWS RDS v2 sensor tracks CPU utilization, CPU credit balance and usage, database connections, and disk queue depth. Also, free storage space, freeable memory, network throughput in both directions, read and write IOPS, read and write latency, swap usage, replica lag, and bin log disk usage. Each metric gets its own channel in PRTG with historical data retention and graph views for trend analysis. That's a lot of channels, but in practice you'll focus on four or five depending on your workload.

Sensor Configuration and Setup 

After adding an AWS device in PRTG with your IAM credentials, you add the AWS RDS v2 sensor and select which RDS instance to monitor. PRTG starts collecting metrics from CloudWatch automatically. You can add sensors for multiple database instances and set individual thresholds per instance based on your workload and performance requirements. Worth noting that thresholds are configured per sensor, not globally, so each DB instance can have different alert conditions.

Alerts and Notifications

PRTG triggers a notification when Amazon RDS monitoring metrics cross thresholds you define. You can configure alerts for conditions like CPU utilization above 80%, free storage below 10%, or connection counts approaching max_connections. Notifications go out via email or HTTP action by default. PRTG also supports Execute Program notifications, which lets you trigger external scripts to connect with DevOps tools like PagerDuty or Slack. SMS delivery requires a third-party script such as Twilio.

Historical Data Reporting 

PRTG stores historical RDS performance data for trend analysis and capacity planning. View performance graphs over hours, days, or months to identify usage patterns, peak workload periods, or gradual resource consumption increases. Reports export in HTML, PDF, or CSV format, useful for capacity reviews or when you need to optimize resource allocation based on actual usage data.

free downLoad

Manual vs. PRTG: Amazon RDS Monitoring Comparison

Monitoring Task

Manual Approach

Manual Approach

With PRTG

With PRTG

Multi-Region Visibility

Manual Approach
not included

Log into separate CloudWatch consoles per region. Build spreadsheets to consolidate data.

With PRTG
included

One dashboard shows all Amazon RDS instances across regions.

Performance Alerting and Root Cause

Manual Approach
not included

Check metrics manually or wait for user complaints. CloudWatch alarms flood your inbox without context for root cause analysis.

With PRTG
included

Threshold-based alerts with historical context show you problems before users notice.

Historical Trend Analysis

Manual Approach
not included

Export CloudWatch data to CSV. Build charts. Lose data when retention expires.

With PRTG
included

Automatic data retention with trend analysis to optimize capacity planning.

Storage and Connection Monitoring

Manual Approach
not included

Log into the AWS console per database instance. Check manually. Find out about problems when writes fail.

With PRTG
included

Automated polling alerts you before you hit storage or connection limits.

Setup and Configuration

Manual Approach
not included

Write Lambda functions and custom scripts using the AWS CLI. Configure alarms per db instance and per metric.

With PRTG
included

Add credentials once, add sensors per instance, start monitoring.

free downLoad

“With PRTG, we can comprehensively monitor our email services in the cloud, and ensure that – as the team in charge – we are immediately informed in the event of a malfunction and can quickly take actions to fix it. It wasn’t until we started using PRTG that we realized how error-ridden our Microsoft cloud service can be.”

Monitoring expert
Oettinger Davidoff

“Part of our infrastructure runs with Azure. This information is then sent to PRTG via Powershell. Paessler is a great solution for us. We get alerts sent directly to our phones and if something goes wrong somewhere, we can immediately deal with it. It’s our lifeline. This is why Paessler gives us a sense of security no matter what the time of day.”

Gert-Jan Hiddink, DevOps Engineer
CowManager

“As more and more companies start to integrate new systems, they aren’t going to use legacy networks. Instead, clients are implementing more cloud-based solutions with newer programming languages. Being able to closely monitor cloud-based solutions and customize sensors based on clients’ needs is extremely helpful in making sure the process runs and continues to function as smoothly as possible.”

Edgard Concha, Director of Information Systems
Resolvit

Paessler PRTG Network Monitor licenses & pricing

Choose the PRTG Network Monitor subscription that's best for you.

License NameLicense descriptionPriceLicense DetailsGet startedPricing Details
PRTG 500$200per month paid annuallyBuy nowBuy now

Enough to monitor multiple aspects of 50 devices

PRTG 1000$358per month paid annuallyBuy nowBuy now

Enough to monitor multiple aspects of 100 devices

PRTG 2500$742per month paid annuallyBuy nowBuy now

Enough to monitor multiple aspects of 250 devices

PRTG 5000$1,300per month paid annuallyBuy nowBuy now

Enough to monitor multiple aspects of 500 devices

PRTG 10000$1,642per month paid annuallyBuy nowBuy now

Enough to monitor multiple aspects of 1000 devices

Over 100,000 Customers Worldwide Love Paessler  

customer success stories

 RDS Monitoring: Frequently Asked Questions


Which RDS database engines does PRTG support?

PRTG monitors all database engines supported by Amazon CloudWatch via the AWS RDS v2 sensor: MySQL, PostgreSQL (Postgres), MariaDB, Oracle, Microsoft SQL Server, and Amazon Aurora in both MySQL-compatible and PostgreSQL-compatible versions. The engine doesn't change how the sensor works. It pulls cloudwatch metrics the same way regardless.

Do I need to install anything on my Amazon RDS instances?

No. PRTG monitors RDS instances through the CloudWatch API, which sits entirely outside your databases. No agents, no changes to the database instance itself. You need IAM credentials with read permissions for CloudWatch and RDS, that's it.

Can PRTG monitor Amazon RDS instances across multiple AWS regions?

Yes. Add a separate AWS device in PRTG for each region, then add AWS RDS v2 sensors for the database instances in those regions. This covers us-east-1, eu-west-1, or any other region you're running, all from one PRTG dashboard. No console switching.

How often does PRTG collect RDS monitoring metrics from CloudWatch?

The AWS RDS v2 sensor has a fixed minimum scanning interval of 5 minutes. Can't go shorter, regardless of global PRTG scanning settings. Also keep in mind that AWS charges per CloudWatch API call, so balance monitoring frequency against cost. The default 5-minute interval works well for most environments.

Can PRTG monitor slow query performance or individual SQL statements?

No. PRTG collects infrastructure-level monitoring metrics from CloudWatch: CPU, IOPS, connections, latency, network throughput. It doesn't access RDS Performance Insights, Amazon CloudWatch Logs, or query-level log files. For slow query analysis, you'll need performance insights or query analysis tools alongside PRTG's infrastructure observability.

What IAM permissions does PRTG need to monitor Amazon RDS?

The sensor requires read permissions for CloudWatch and RDS via an AWS API key. Paessler documents the exact required IAM policy in their Knowledge Base article on AWS API key permissions. Check that before deploying, access errors during setup are an easy thing to avoid.

Paessler PRTG

Paessler PRTG

Network Monitoring Software – Version 26.1.116.1532 (February 9th, 2026)

Hosting icon

Hosting

Download for Windows and cloud-based version PRTG Hosted Monitor available

Languages icon

Languages

English, German, Spanish, French, Portuguese, Dutch, Russian, Japanese, and Simplified Chinese

test

Monitor everything

Network devices, bandwidth, servers, applications, virtual environments, remote systems, IoT, and more

test

Pricing

Choose the PRTG Network Monitor subscription that's best for you

Discover more monitoring insights and stories

Content illustration

Powerful stories from the monitoring world

  • Customer success story: Riverford & PRTG
  • Sending Notifications Via Microsoft Teams
  • Easy ways to quickly test your bandwidth
Support illustration

Resources to master your monitoring challenges

  • PRTG Apps for Mobile Network Monitoring
  • How can I use the PRTG Application Programming Interface (API)?
  • How can I speed up PRTG—especially for large installations?
Solution illustration

Solutions for all your monitoring needs

  • RDS Monitoring
  • AWS Monitoring
  • EC2 Monitoring
PRTG Logo

Start Monitoring with PRTG and see how it can make your network more reliable and your job easier.

Free download
PRODUCT OVERVIEW

Products

  • Paessler PRTG
    Paessler PRTGMonitor your whole IT infrastructure
    • PRTG Network Monitor
    • PRTG Enterprise Monitor
    • PRTG Hosted Monitor
    • PRTG UVexplorer
    • PRTG extensions
      Extensions for Paessler PRTGExtend your monitoring to a new level
  • Icon Features
    FeaturesExplore all monitoring features

Monitoring with PRTG

  • Network monitoring
  • Bandwidth monitoring
  • SNMP monitoring
  • Network mapping
  • Wi-Fi monitoring
  • Server monitoring
  • Network traffic analyzer
  • NetFlow monitoring
  • Syslog server

Useful Links

  • PRTG Manual
  • Knowledge Base
  • Customer Success Stories
  • About Paessler
  • Subscribe to newsletter
  • PRTG Support
  • PRTG Consulting
  • PRTG Feedback & Roadmap

Contact

Paessler GmbH
Thurn-und-Taxis-Str. 14, 
90411 Nuremberg 
Germany

[email protected]

+49 911 93775-0

  • Contact us
©2026 Paessler GmbHTerms & ConditionsPrivacy PolicyImprintReport VulnerabilityDownload & InstallSitemap
SNMP, MIBs and OIDs SNMP, MIBs and OIDs SNMP, MIBs and OIDs