

• Company
    • About Us
    • Case Studies
    • Press Center
    • Careers
    • Blog
    • Contact us
  • Contact us
  • Login
 
  • English
    • Deutsch
    • Español
    • Français
    • Italiano
    • Português
Paessler
                    - The Monitoring Experts
  • Products
    • Paessler PRTG
      Paessler PRTGMonitor your whole IT infrastructure
      • PRTG Network Monitor
      • PRTG Enterprise Monitor
      • PRTG Hosted Monitor
      • PRTG UVexplorer
      • PRTG extensionsExtensions for Paessler PRTGExtend your monitoring to a new level
    • Icon Features
      FeaturesExplore all monitoring features
      • Maps & dashboards
      • Alerts & notifications
      • Multiple user interfaces
      • Distributed monitoring
      • Customizable reporting
  • Solutions
    • By TeamFor your organization size
      • Small Business IT
      • Mid-Market IT
      • Enterprise IT
      • MSP Network Monitoring
    • Industries
      By IndustryFor your business sector
      • Industrial
      • Healthcare
      • Government
      • Education
      • Data Center
      • Finance
    • IT Topics
      By Use CaseFor every technical scenario
      • Network Monitoring
      • Server Monitoring
      • OT Monitoring
      • Distributed Monitoring
      • Network Topology Mapping
      • SNMP Monitoring
      • Bandwidth Monitoring
  • Pricing
  • Resources
    • Getting Started
      Getting StartedModules for self-paced learning
    • How-to Guides
      How-to GuidesGet the most out of PRTG
    • Videos & Webinars
      Videos & WebinarsLearn from Paessler experts
    • IT  Knowledge
      IT KnowledgeExpand your IT knowledge
    • PRTG Manual
      PRTG ManualFull documentation
    • Knowledge Base
      Knowledge BaseShare community knowledge
    • PRTG Sensor Hub
      PRTG Sensor HubGet sensors, scripts & templates
    • Trainings
      PRTG TrainingLearn how to work with PRTG
  • Partners
    • Icon Handshake
      Become a PartnerFor resellers and channel partners
    • Icon MSP
      Become an MSPDeliver monitoring as a managed service
    • icon partner
      Partner PortalLog in to your partner account
    • Deal Registration
      Deal RegistrationRegister your sales opportunities
    • icon search
      Find a PartnerFind partners selling Paessler products
    • icon technology
      Technology AlliancesSee Paessler technology partnerships
    • Partner HubTools for Your Success
  • Company
    • About Us
    • Case Studies
    • Press Center
    • Careers
    • Blog
    • Contact us
  • Contact us
  • Login
  • English
    • Deutsch
    • Español
    • Français
    • Italiano
    • Português
  • Get a quote
  • Free trial
  1. Home>
  2. Company>
  3. Case Studies>
  4. Dätwyler

From Reactive to Proactive: How Dätwyler Monitors IT, OT, and Edge with One Tool

Challenge: Monitoring fragmented IT, OT, and edge environments without a unified solution

download PDF
Logo Dätwyler

COMPANY
Dätwyler IT Infra

INDUSTRY
Manufacturing

COMPANY SIZE
Enterprise

COUNTRY
Switzerland

SCALE
Multi-site IT and OT environments, cable manufacturing and data center operations

Icon watch.

Core machine failures can cost several thousand Swiss francs per hour; continuous monitoring reduces that risk

Icon time.

Edge device issues now detected in near real time

Icon Connection.

One platform covers data center, IT network, OT, and edge devices

The problem

Dätwyler IT Infra is a global provider of IT and OT infrastructure solutions, with cable manufacturing roots over 100 years old. As it pursued digitalization across its facilities and customer sites, monitoring complexity grew fast. 

The core challenge was fragmentation. Modern systems ran alongside older machines requiring retrofitting. Data centers, edge devices, OT components, and IT infrastructure all needed monitoring, but no single tool covered all of it. An OPC UA server failure at Dätwyler's own facility went unnoticed until impact occurred. 

What changed with PRTG

Dätwyler selected Paessler PRTG as their cross-divisional monitoring solution after a brief evaluation. Nagios was ruled out due to high complexity. PRTG provided out-of-the-box support for all IT components, including SNMP, WMI, and PowerShell sensors. 

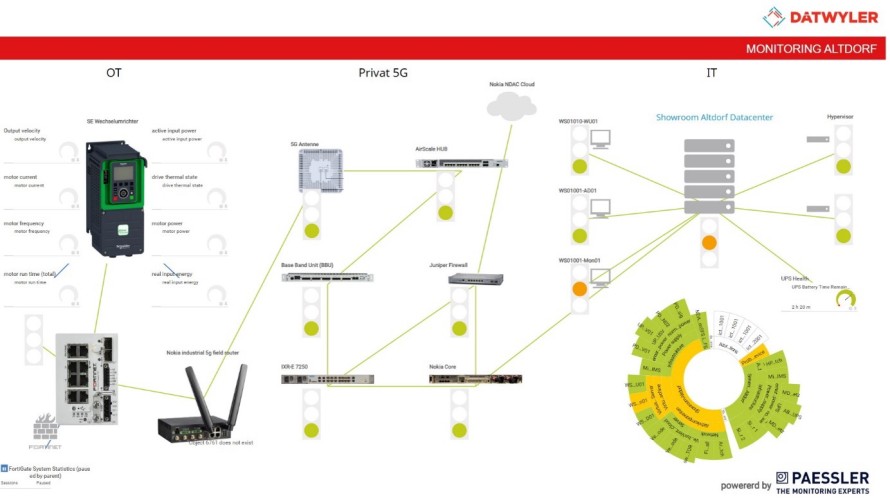
For OT environments, PRTG's support for MQTT, OPC UA, and Modbus allowed industrial components to be integrated into one monitoring view. The team uses MQTT Subscription, REST API, Docker container, SQL, SSH, and OPC UA Server sensors across production. 

Edge monitoring was a key win. By installing a multi-platform probe in a Docker container on edge devices, the team now detects issues in near real time. The OPC UA server that previously failed undetected is now fully monitored with immediate alerts. 

In production, PRTG monitors roll length, trigger speed, sheathing system flow, outdoor temperature, edge devices, and gateways. Temperature during cable sheathing is tracked continuously. 

Errors on edge devices typically only become apparent after a delay. With PRTG, we can install a multi-platform probe in a Docker container directly on the edge device. Since then, we've been able to monitor each device virtually in real time and intervene immediately when problems arise.

Pascal Walther, Head of IT/OT
Dätwyler IT Infra
PRTG Logo

See how PRTG can unify your IT and OT monitoring.

CONTACT SALES
case study dätwyler monitoring an inverter

Discover more monitoring insights and stories

Solution illustration

Solutions for all your monitoring needs

  • Industrial IT Monitoring
  • Network Mapping
  • NetFlow Monitoring
Content illustration

Powerful stories from the monitoring world

  • Customer success stories - Paessler
  • Customer success story Integrated Precision Systems
  • Monitoring FortiGate Firewalls with Paessler PRTG
Support illustration

Resources to master your monitoring challenges

  • How can I use the PRTG Application Programming Interface (API)?
  • I run PRTG on VMware. How can I obtain best performance?
  • Understanding Basic Concepts
Explore All Case Studies

Products

  • Paessler PRTG
    Paessler PRTGMonitor your whole IT infrastructure
    • PRTG Network Monitor
    • PRTG Enterprise Monitor
    • PRTG Hosted Monitor
    • PRTG UVexplorer
    • PRTG extensions
      Extensions for Paessler PRTGExtend your monitoring to a new level
  • Icon Features
    FeaturesExplore all monitoring features

Monitoring with PRTG

  • Network monitoring
  • Bandwidth monitoring
  • SNMP monitoring
  • Network mapping
  • Wi-Fi monitoring
  • Server monitoring
  • Network traffic analyzer
  • NetFlow monitoring
  • Syslog server

Useful Links

  • PRTG Manual
  • Knowledge Base
  • Customer Success Stories
  • About Paessler
  • Subscribe to newsletter
  • PRTG Support
  • PRTG Consulting
  • PRTG Feedback & Roadmap

Contact

Paessler GmbH
Thurn-und-Taxis-Str. 14, 
90411 Nuremberg 
Germany

[email protected]

+49 911 93775-0

  • Contact us
©2026 Paessler GmbHTerms & ConditionsPrivacy PolicyImprintReport VulnerabilityDownload & InstallSitemap
-Free Network Monitoring -Free Network Monitoring -Free Network Monitoring


