

• Company
    • About Us
    • Case Studies
    • Press Center
    • Careers
    • Blog
    • Contact us
  • Contact us
  • Login
 
  • English
    • Deutsch
    • Español
    • Français
    • Italiano
    • Português
Paessler
                    - The Monitoring Experts
  • Products
    • Paessler PRTG
      Paessler PRTGMonitor your whole IT infrastructure
      • PRTG Network Monitor
      • PRTG Enterprise Monitor
      • PRTG Hosted Monitor
      • PRTG UVexplorer
      • PRTG extensionsExtensions for Paessler PRTGExtend your monitoring to a new level
    • Icon Features
      FeaturesExplore all monitoring features
      • Maps & dashboards
      • Alerts & notifications
      • Multiple user interfaces
      • Distributed monitoring
      • Customizable reporting
  • Solutions
    • By TeamFor your organization size
      • Small Business IT
      • Mid-Market IT
      • Enterprise IT
      • MSP Network Monitoring
    • Industries
      By IndustryFor your business sector
      • Industrial
      • Healthcare
      • Government
      • Education
      • Data Center
      • Finance
    • IT Topics
      By Use CaseFor every technical scenario
      • Network Monitoring
      • Server Monitoring
      • OT Monitoring
      • Distributed Monitoring
      • Network Topology Mapping
      • SNMP Monitoring
      • Bandwidth Monitoring
  • Pricing
  • Resources
    • Getting Started
      Getting StartedModules for self-paced learning
    • How-to Guides
      How-to GuidesGet the most out of PRTG
    • Videos & Webinars
      Videos & WebinarsLearn from Paessler experts
    • IT  Knowledge
      IT KnowledgeExpand your IT knowledge
    • PRTG Manual
      PRTG ManualFull documentation
    • Knowledge Base
      Knowledge BaseShare community knowledge
    • PRTG Sensor Hub
      PRTG Sensor HubGet sensors, scripts & templates
    • Trainings
      PRTG TrainingLearn how to work with PRTG
  • Partners
    • Icon Handshake
      Become a PartnerFor resellers and channel partners
    • Icon MSP
      Become an MSPDeliver monitoring as a managed service
    • icon partner
      Partner PortalLog in to your partner account
    • Deal Registration
      Deal RegistrationRegister your sales opportunities
    • icon search
      Find a PartnerFind partners selling Paessler products
    • icon technology
      Technology AlliancesSee Paessler technology partnerships
    • Partner HubTools for Your Success
  • Company
    • About Us
    • Case Studies
    • Press Center
    • Careers
    • Blog
    • Contact us
  • Contact us
  • Login
  • English
    • Deutsch
    • Español
    • Français
    • Italiano
    • Português
  • Get a quote
  • Free trial
  1. Home>
  2. Company>
  3. Case Studies>
  4. AXA Gulf

Insurance runs 24/7: how AXA Gulf replaced a manual daily checklist with always-on monitoring

Challenge: Application availability managed via manual daily checklist; no real-time visibility or after-hours alerting

download PDF
Logo Company AXA Gulf

COMPANY
AXA Gulf

INDUSTRY
Financial Services

COMPANY SIZE
Enterprise

COUNTRY
United Arab Emirates

SCALE
25 branches, 800+ employees, 1 million+ customers

Icon Map

Manual daily checklist replaced by real-time PRTG dashboard monitoring

Icon Unified

25 branches and multiple data centers covered under a single platform

Icon Time

After-hours alerts via email and mobile app enable immediate response at any hour

The problem

AXA Gulf is one of the largest international insurers in the Gulf region, covering the UAE, Oman, Bahrain, and Qatar. Insurance is a round-the-clock business. Customers need access to policies, coverage, and claims at any hour. Downtime is not an option.

The systems team runs the company's data centers and keeps all corporate applications available at all times. Their process was largely manual: a daily checklist covering memory, disk space, storage, hardware, servers, WAN performance, ping rates, application URLs, and data center temperature and humidity.

Reviewing that checklist took significant time every day. Outside business hours, there was no systematic way to catch issues before they escalated.

What changed with PRTG

PRTG replaced the manual process with continuous, automated monitoring across all data centers and applications. Sensors feed data into a central dashboard showing key performance indicators at a glance.

The daily checklist still exists, but the team completes it quickly by checking the dashboard rather than working through each item manually. Issues that would previously have gone unnoticed for hours now flag up in real time.

Outside business hours, PRTG sends alerts via email and mobile app to the relevant team members the moment a threshold is crossed. The team responses immediately, regardless of the hour.

When incidents occur, PRTG's historical data lets the team trace what happened, prepare detailed reports, and share action plans with senior management. Reactive troubleshooting has become structured post-incident analysis.

The insights that PRTG gives us means we are much more efficient in our daily checking of application and systems performance.

Suresh Lakshmikanthan, IT System Administrator
AXA Gulf
PRTG Logo

PRTG gives financial services teams the continuous visibility they need to keep critical applications running around the clock.

CONTACT SALES
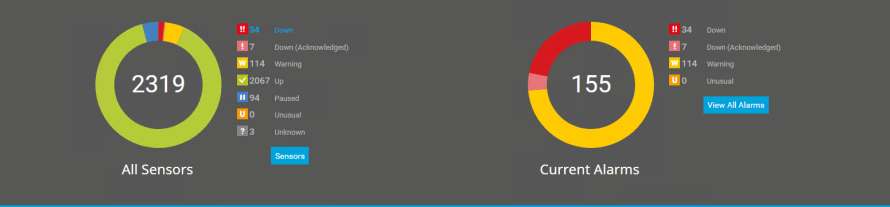
Sensors and alarms status from AXA Gulf’s PRTG installation

Discover more monitoring insights and stories

Solution illustration

Solutions for all your monitoring needs

  • SNMP Monitoring
  • IP Monitoring
  • LAN Monitoring
Content illustration

Powerful stories from the monitoring world

  • Customer success stories - Paessler
  • AXA Gulf insures against application downtime with Paessler
  • Foxtons benefits from clearer visibility and a deeper insight into its ...
Support illustration

Resources to master your monitoring challenges

  • I run PRTG on VMware. How can I obtain best performance?
  • How can I propose new features or sensors for PRTG?
  • How can I use the PRTG Application Programming Interface (API)?
Explore All Case Studies

Products

  • Paessler PRTG
    Paessler PRTGMonitor your whole IT infrastructure
    • PRTG Network Monitor
    • PRTG Enterprise Monitor
    • PRTG Hosted Monitor
    • PRTG UVexplorer
    • PRTG extensions
      Extensions for Paessler PRTGExtend your monitoring to a new level
  • Icon Features
    FeaturesExplore all monitoring features

Monitoring with PRTG

  • Network monitoring
  • Bandwidth monitoring
  • SNMP monitoring
  • Network mapping
  • Wi-Fi monitoring
  • Server monitoring
  • Network traffic analyzer
  • NetFlow monitoring
  • Syslog server

Useful Links

  • PRTG Manual
  • Knowledge Base
  • Customer Success Stories
  • About Paessler
  • Subscribe to newsletter
  • PRTG Support
  • PRTG Consulting
  • PRTG Feedback & Roadmap

Contact

Paessler GmbH
Thurn-und-Taxis-Str. 14, 
90411 Nuremberg 
Germany

[email protected]

+49 911 93775-0

  • Contact us
©2026 Paessler GmbHTerms & ConditionsPrivacy PolicyImprintReport VulnerabilityDownload & InstallSitemap
Cisco Router Monitoring Cisco Router Monitoring Cisco Router Monitoring


