
- English
- Deutsch
- Español
- Français
- Italiano
- Português
A NetFlow collector receives flow data from your network devices and turns it into structured traffic analysis: who's talking to whom, on which port, using which protocol. Most setups require separate tools for collection, analysis, and visualization before you get a usable breakdown. Paessler PRTG combines all three in a single tool, giving you Top Talkers, Top Connections, and Top Protocols per interface with flow sensors included in every license. It supports NetFlow v5/v9, IPFIX, sFlow, and jFlow v5, so most environments are covered without additional software.
Supported technologies: Cisco (NetFlow v5/v9), Juniper (jFlow v5), HP/Aruba/Brocade (sFlow), Fortinet, VMware, and any IPFIX-compatible device. For devices without native flow export, PRTG's SNMP Traffic monitoring covers the gap.
Note: PRTG flow sensors currently support IPv4 traffic. If your environment routes significant IPv6 traffic, factor that into your deployment planning.

SNMP tells you how much bandwidth an interface uses in total. Flow data breaks that down further: which device, which protocol, which connection is responsible for the traffic you're seeing. PRTG receives the flow traffic your routers, switches, and firewalls are already generating and translates it into a per-interface breakdown by source IP, destination IP, port, and protocol. Top Talkers, Top Connections, and Top Protocols are visible in continuously updated dashboards and historical graphs. No custom sensor configuration required on the PRTG side. Predefined channels work once the flow export is configured on the device. A bandwidth problem that used to take hours to narrow down becomes a two-minute lookup, or close to it.
Many NetFlow collectors are receive-only. You still need a separate analyzer, a database backend, and a visualization layer before you see a single useful graph. PRTG receives flow data and analyzes it in the same tool, with flow sensors included in every license and ready to configure the moment you install. You point a device at PRTG's IP, configure the export on the device side, and you're getting structured, visual flow data alongside your existing network monitoring for servers and applications.

Live graphs, real-time performance data
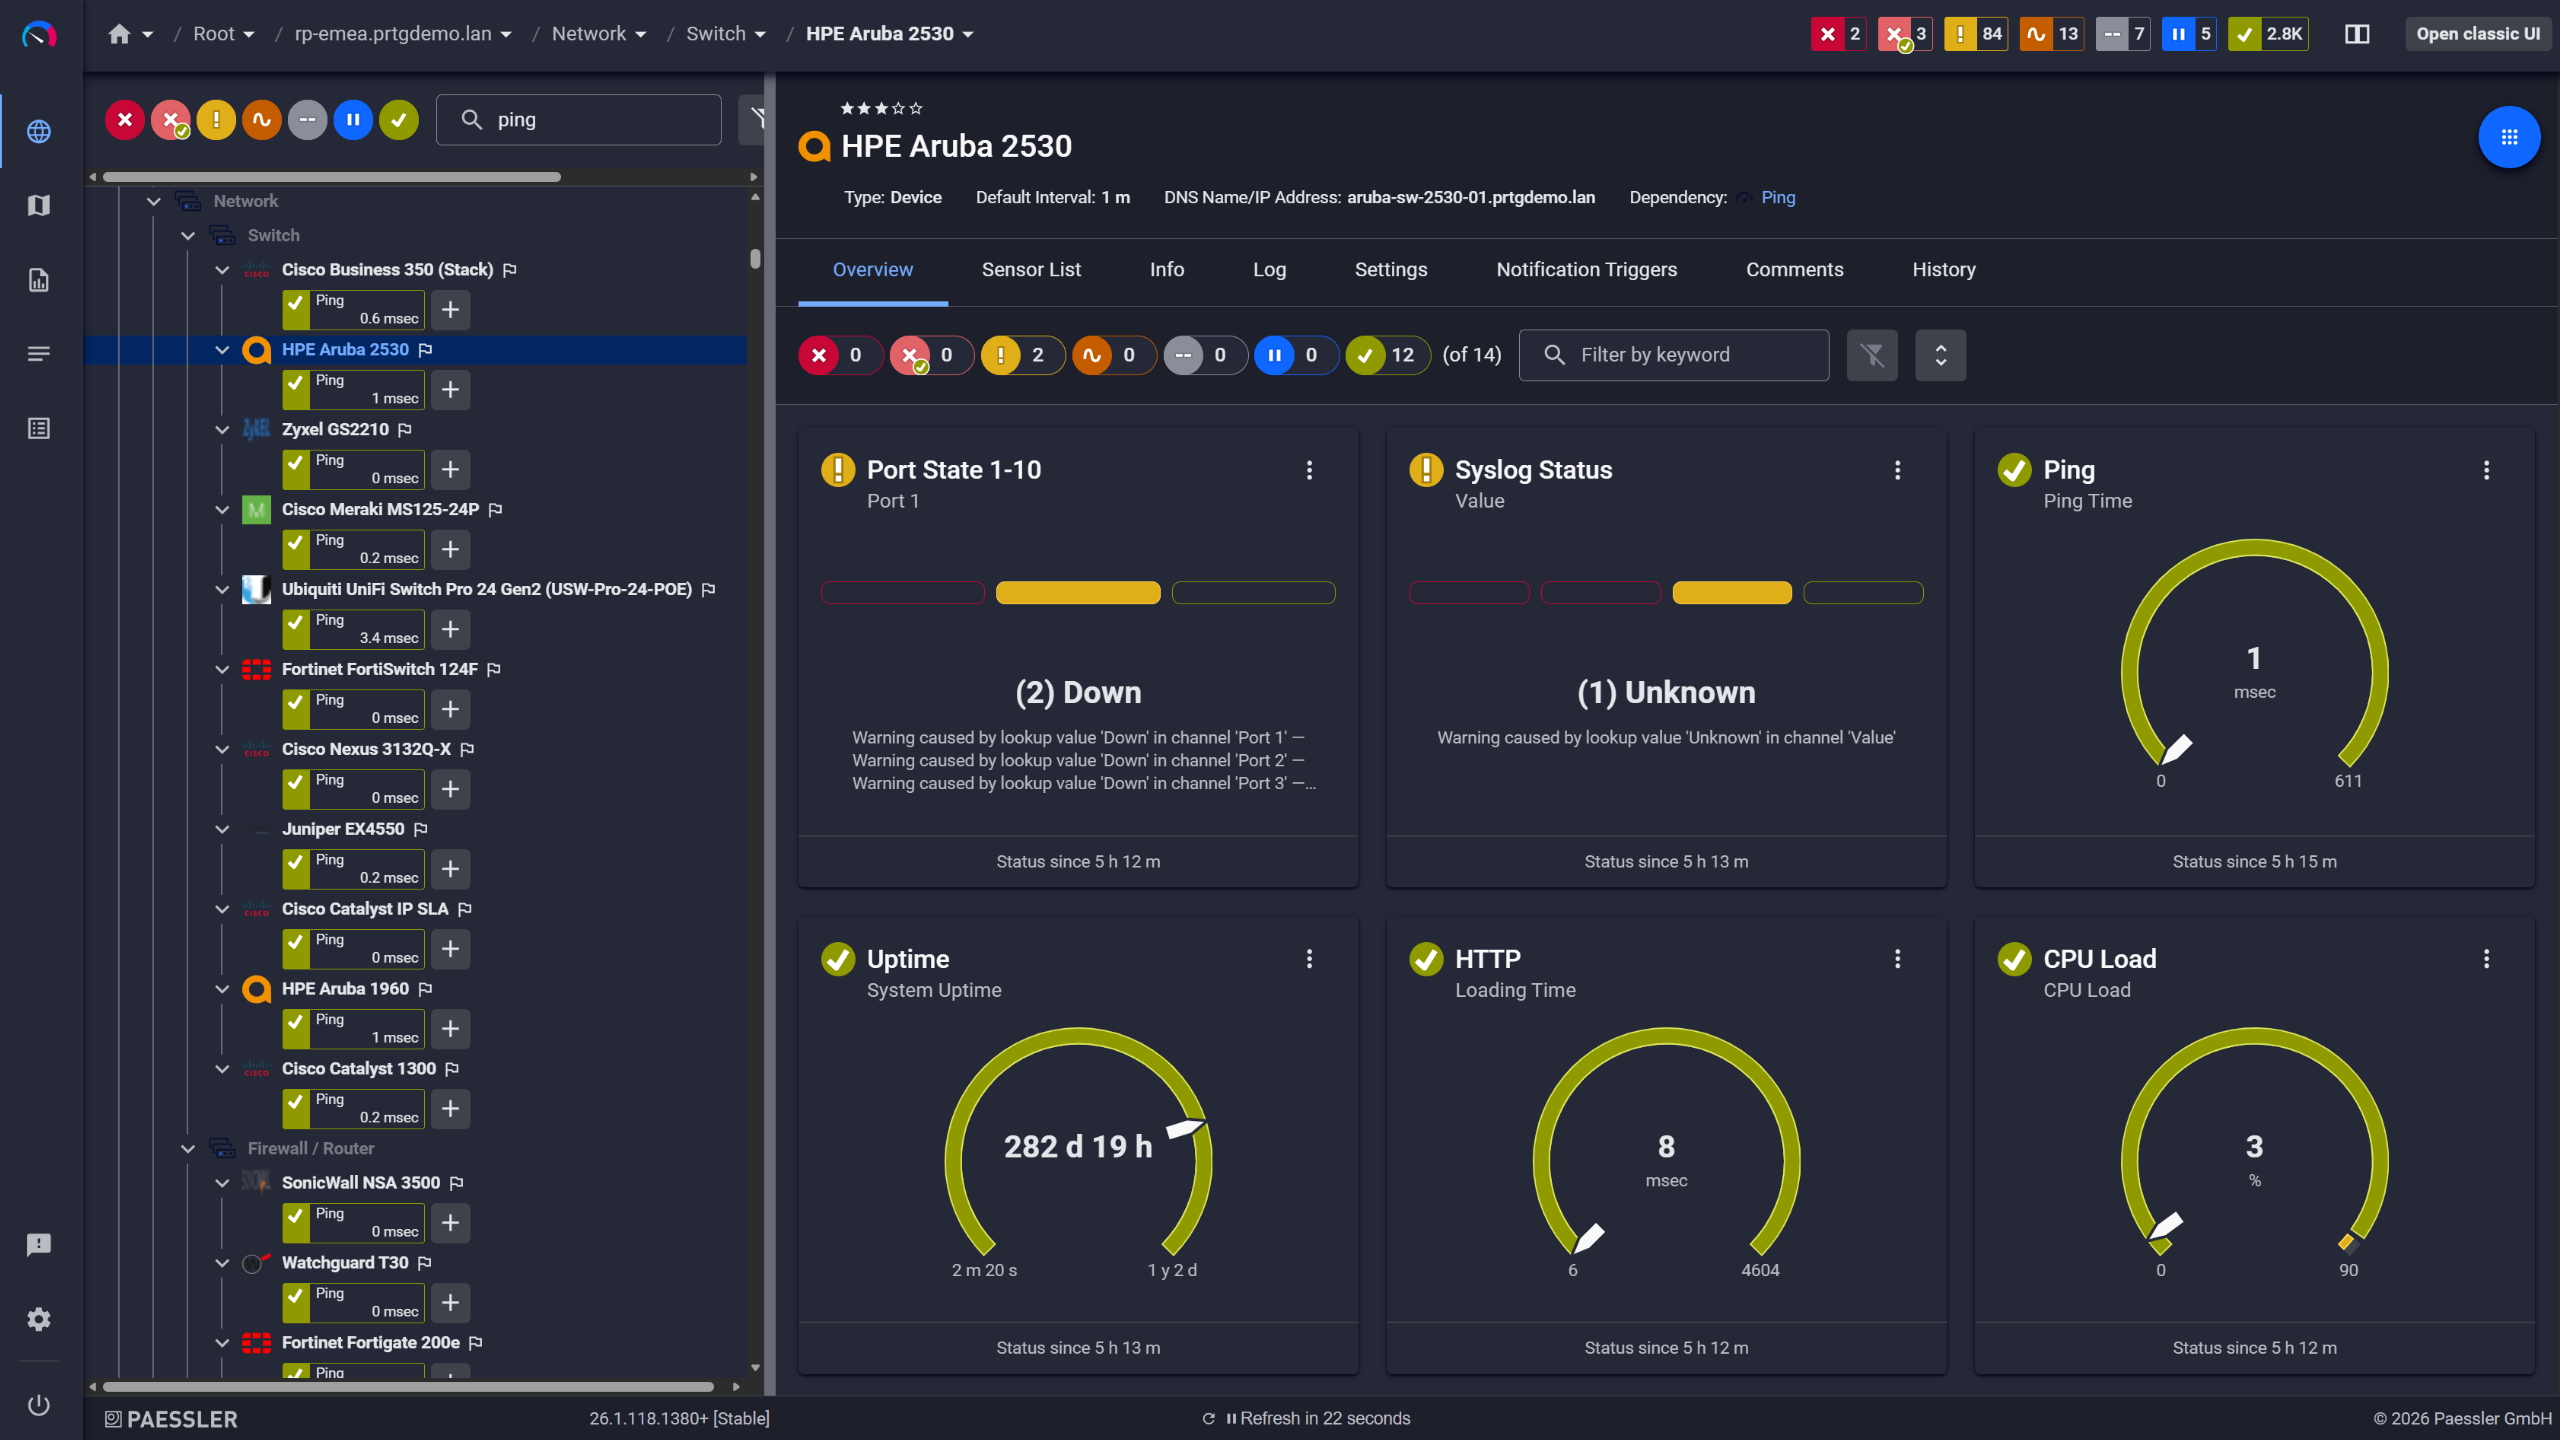
Network switches monitored across vendors

Scheduled reports, always on time
Flow data volume grows fast. Collecting everything from every interface without filtering by protocol, port, or IP range just creates more noise to sift through. PRTG's flow sensors come with predefined channel filters for the most common traffic categories, no scripting needed on the sensor side. Custom sensor variants let you define channels by source address, TCP/UDP port, or protocol when you need more precision. Metrics are stored and graphed per channel, so trend data for troubleshooting and capacity planning is always there.
Start monitoring your infrastructure in minutes. No professional services, no complex configuration, no risk.
Automated alerting on flow data means your monitoring catches bandwidth issues on its own and notifies the right person, whether you're watching the dashboard at that moment or not. PRTG applies configurable threshold-based alerts to every flow sensor channel. When a defined limit is crossed on total interface bandwidth or a specific traffic category, it sends a notification via email, SMS, push, or external integrations if you're routing to something like PagerDuty or ServiceNow. Flow alerting is unified with your SNMP and uptime monitoring in a single alert system.
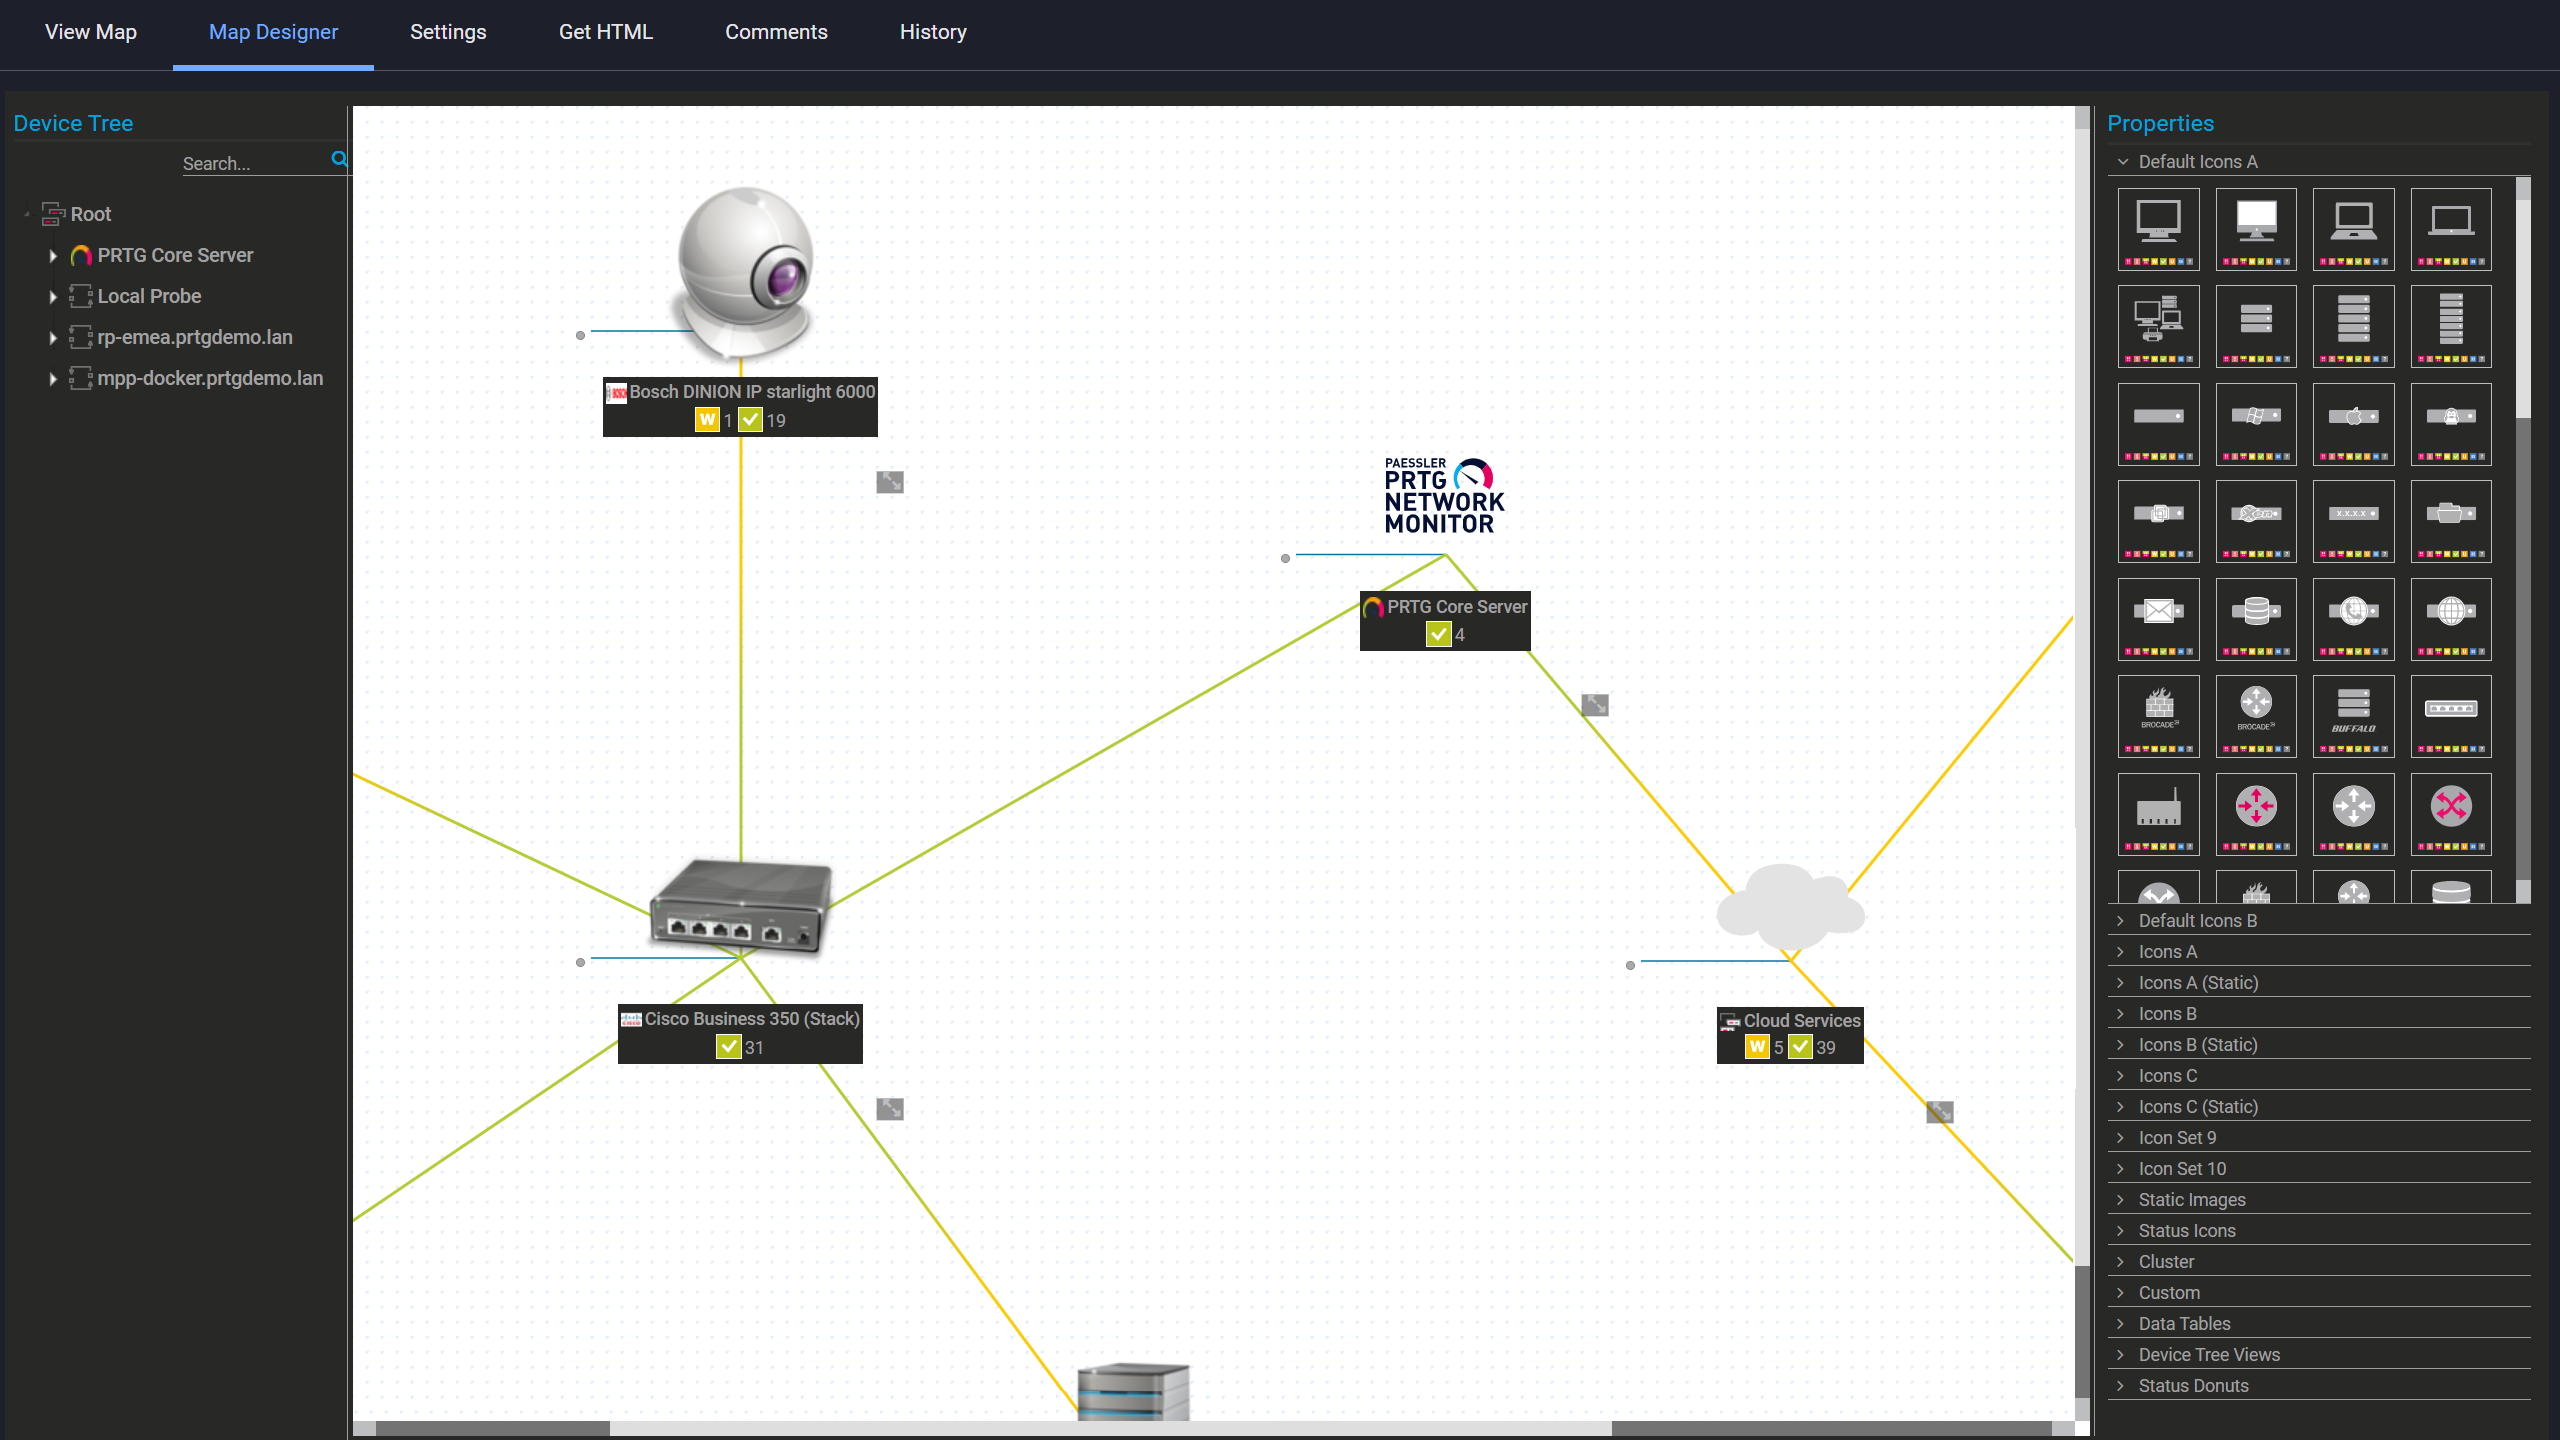
Custom maps with live status
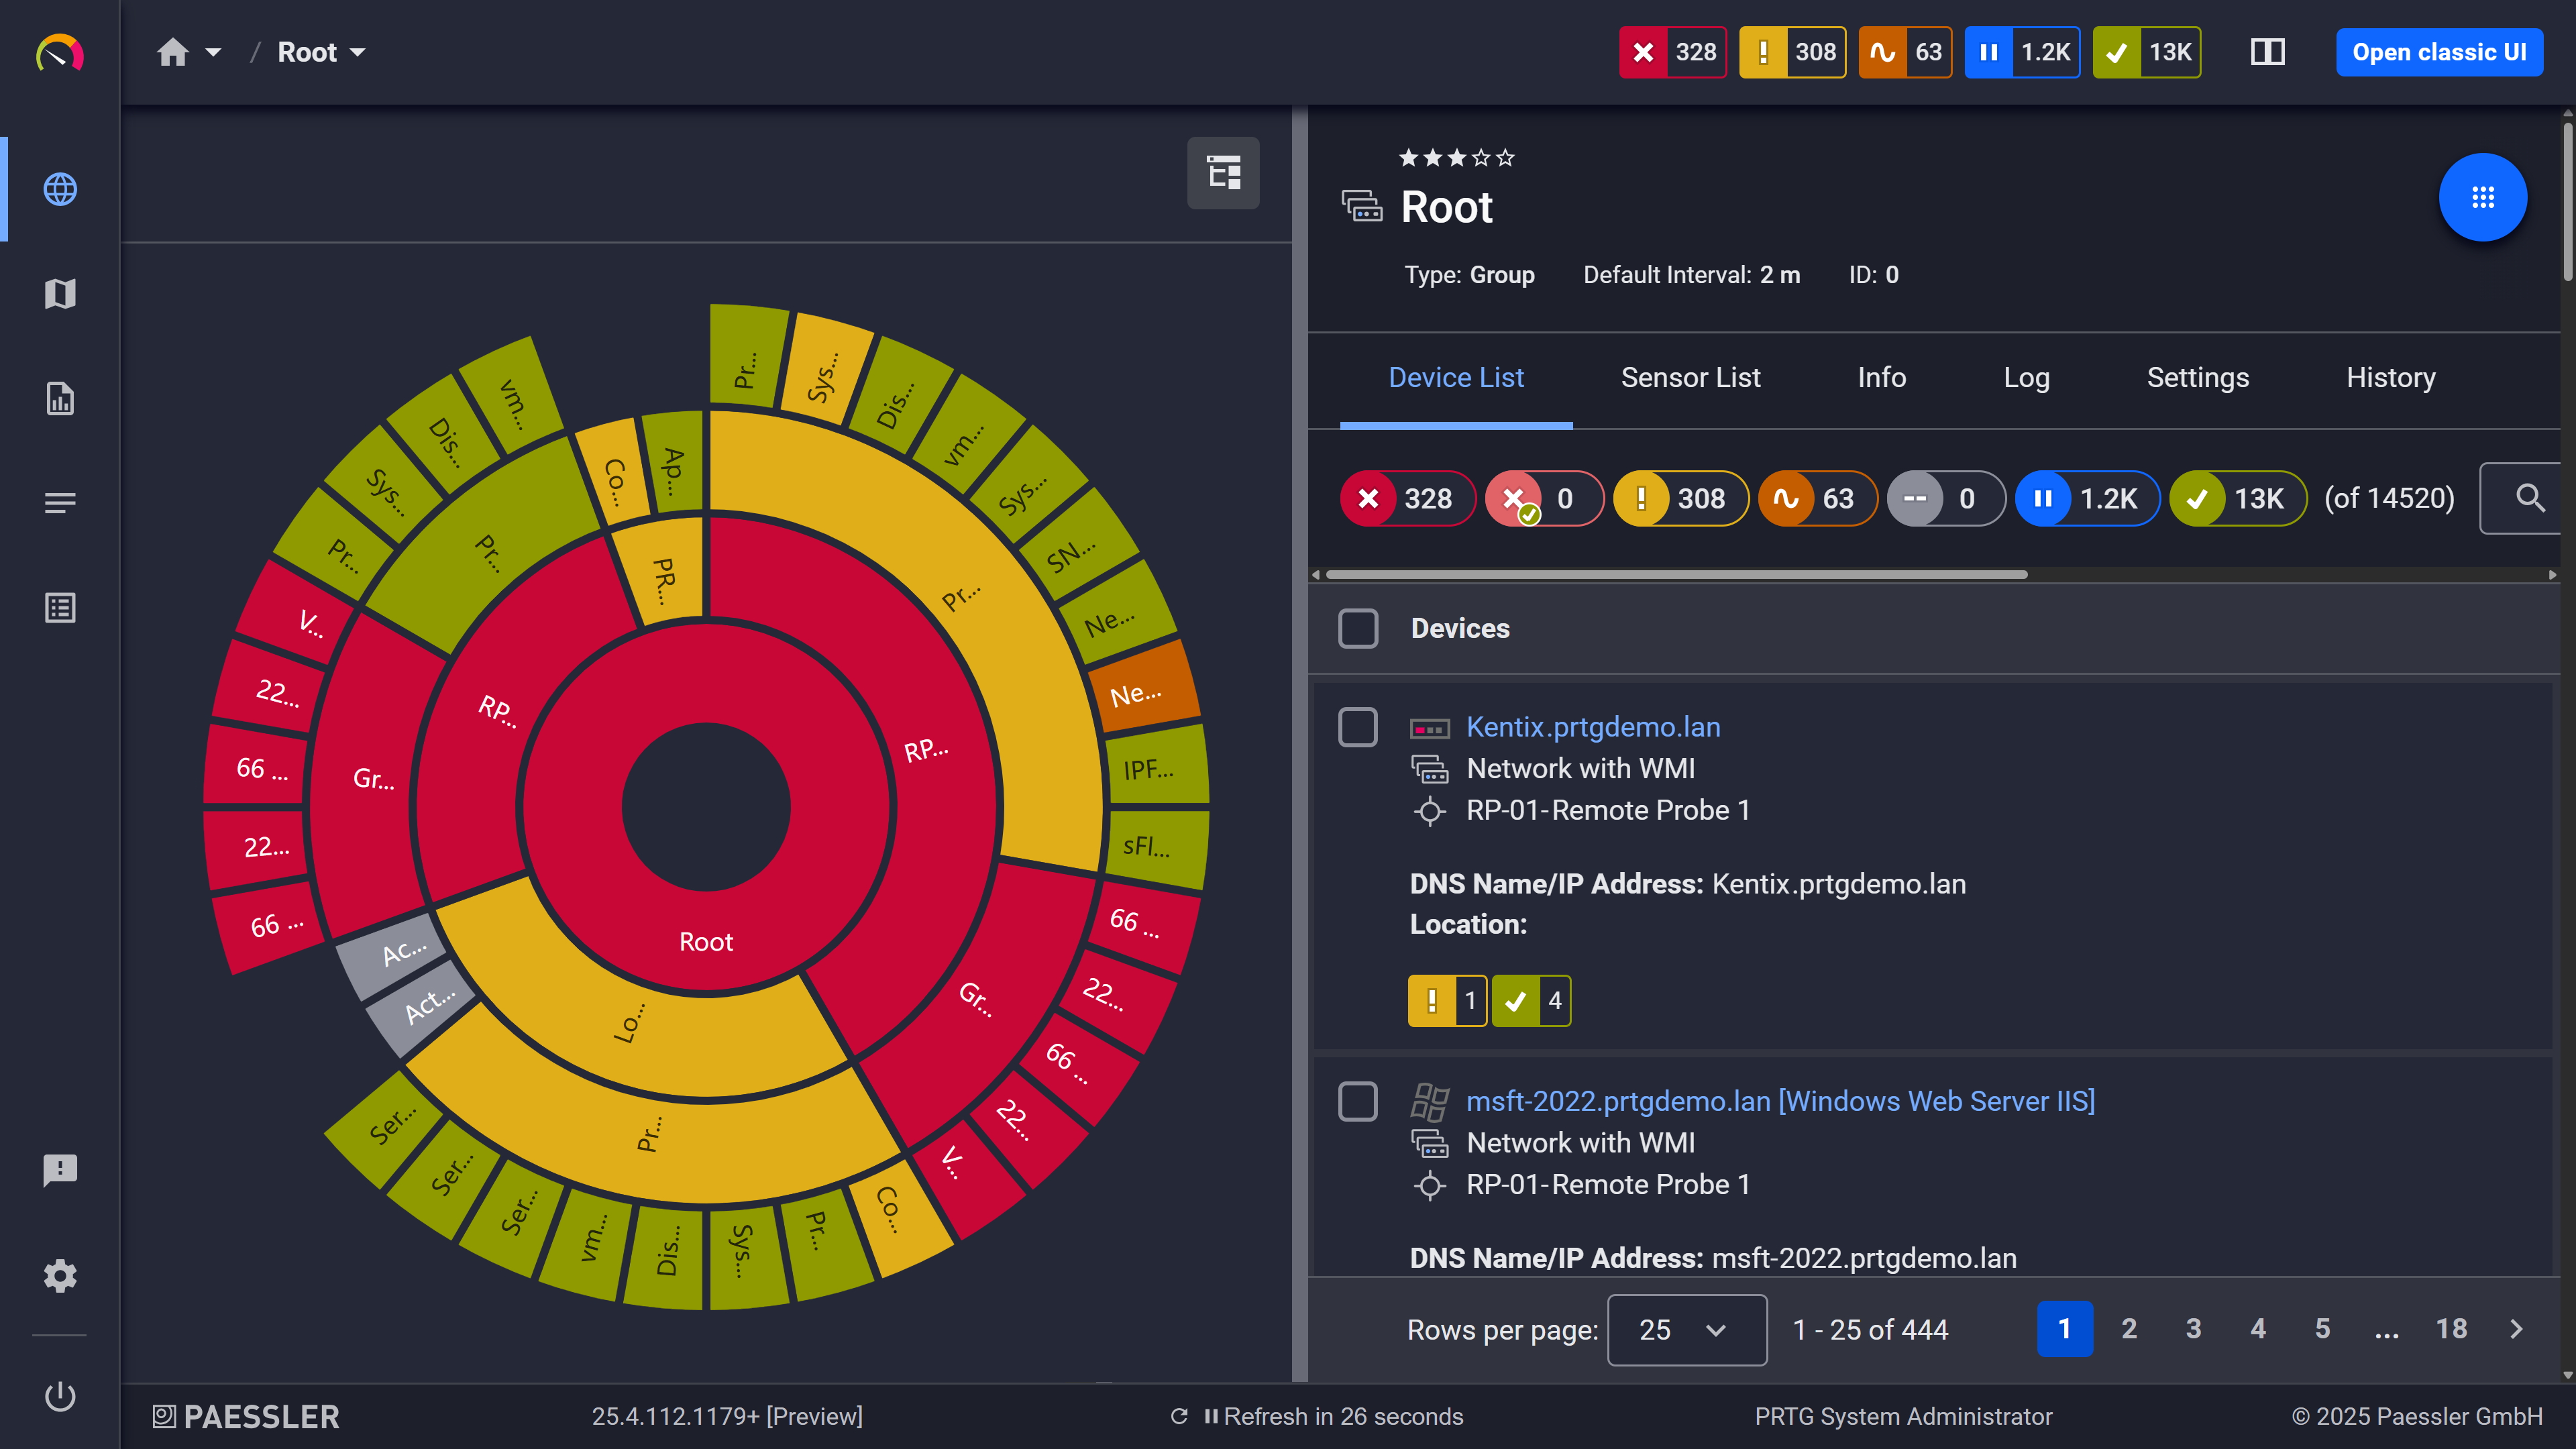
Your entire network, visualized instantly

Full device list, instant overview
PRTG's flow monitoring is built on standard flow export protocols. The sections below cover how flow data gets from your network devices into PRTG, what the individual protocols look like in practice, and how PRTG's sensor layer handles each one. Flow sensors run on PRTG probes. In multi-site environments, distributed probe deployment lets you act as a local flow collector per site, with each probe managing its own sensor load independently.
FEATURE | Without PRTG Without PRTG | With PRTG With PRTG |
|---|---|---|
Identify Top Talkers, Top Connections, Top Protocols | Without PRTG CLI queries per device, one at a time | With PRTG Top Talkers, Top Connections, Top Protocols per interface |
Multi-protocol flow collection | Without PRTG Separate tools per protocol | With PRTG NetFlow v5/v9, IPFIX, sFlow, jFlow v5 in one |
Traffic alerting | Without PRTG Manual checks, no automation | With PRTG Configurable threshold alerts on any flow sensor channel |
Traffic visualization | Without PRTG Raw data exports, external tools needed | With PRTG Live dashboards and historical trend graphs |
Devices without flow support | Without PRTG No visibility | With PRTG SNMP Traffic sensor covers the gaps |
Choose the PRTG Network Monitor subscription that's best for you.
| License Name | License description | Price | License Details | Get started | Pricing Details | |
|---|---|---|---|---|---|---|
| PRTG 500 | $200 | per month paid annually | Buy nowBuy now | Enough to monitor multiple aspects of 50 devices | ||
| PRTG 1000 | $358 | per month paid annually | Buy nowBuy now | Enough to monitor multiple aspects of 100 devices | ||
| PRTG 2500 | $742 | per month paid annually | Buy nowBuy now | Enough to monitor multiple aspects of 250 devices | ||
| PRTG 5000 | $1,300 | per month paid annually | Buy nowBuy now | Enough to monitor multiple aspects of 500 devices | ||
| PRTG 10000 | $1,642 | per month paid annually | Buy nowBuy now | Enough to monitor multiple aspects of 1000 devices |

A NetFlow collector is the component that receives flow data exported by network devices and stores or processes it. A NetFlow analyzer is what interprets that data and turns it into readable traffic breakdowns. In many setups these are separate tools. You need both to get anything useful out of your flow data. PRTG combines both functions: it receives flow records and immediately makes the analyzed data available as structured sensor channels and dashboard visualizations. No separate analyzer component needed. No extra setup.
PRTG supports NetFlow v5 and v9, IPFIX, sFlow, and jFlow v5. For each protocol, there's a standard sensor with predefined channels and a Custom sensor variant that lets you define your own channel filters by IP range, port, or protocol. This covers the vast majority of flow-capable hardware: Cisco, Juniper, HP/Aruba, Brocade, Fortinet, VMware, and any vendor implementing IPFIX. For devices that don't export flow data at all, PRTG's SNMP Traffic sensor provides interface-level bandwidth monitoring. Note that all flow sensors support IPv4 traffic; IPv6 is not currently supported.
If an SD-WAN device supports NetFlow or IPFIX export, PRTG can collect and display that network flow data the same way it would for any other network device. You get per-device traffic visibility: which protocols are running, which endpoints are active, how much bandwidth each is using. What PRTG doesn't provide is native SD-WAN topology awareness. It has no built-in understanding of overlay/underlay relationships or path-specific analytics. For VPN traffic passing through SD-WAN devices, the flow data is visible to the extent the device exports it.
For network devices that don't support NetFlow, IPFIX, sFlow, or jFlow v5, PRTG uses SNMP Traffic monitoring to collect interface-level data. This gives you total traffic in/out, error rates, and packet counts per interface. It's less granular than flow data. You won't get a per-IP or per-protocol breakdown. But it means every device in your environment has some level of traffic visibility. Most environments have a mix, and PRTG handles both within the same network monitoring setup.
Yes. PRTG stores all flow sensor metrics historically and graphs them per channel. This means you can look at bandwidth usage trends over time for any interface, see which traffic categories are growing, and identify links that are approaching their limits before they actually hit them. The historical data gives you the context to make informed decisions about upgrades, traffic shaping, or rerouting, rather than reacting after the fact when the damage is already visible.
Open-source NetFlow collection tools can work well, but they typically require you to set up and integrate separate components for collection, storage, and visualization. Maintaining that stack takes ongoing effort. PRTG covers all three in one installation, without requiring scripting or pipeline work to get usable data. It also integrates your flow monitoring with everything else PRTG monitors in a single interface: servers, applications, network devices. If you're already running PRTG, adding NetFlow collection doesn't require a separate deployment. For teams that want a dedicated, standalone flow analysis platform, open-source tools like ntopng or nfdump are worth evaluating; PRTG's strength is breadth of coverage in a single, maintained tool.
A sensor in PRTG is the individual monitoring unit that checks one specific aspect of a device or service. For NetFlow monitoring, each sensor corresponds to one interface on one device, collecting and displaying the flow data for that interface as a set of channels (Top Talkers, Top Connections, Top Protocols, and any custom-defined categories). PRTG licensing is based on the number of sensors, and flow sensors count the same as any other sensor type. One sensor per monitored interface.
Network Monitoring Software – Version 26.3.124.1727 (September 16, 2026)
Download for Windows and cloud-based version PRTG Hosted Monitor available
English, German, Spanish, French, Portuguese, Dutch, Russian, Japanese, and Simplified Chinese
Network devices, bandwidth, servers, applications, virtual environments, remote systems, IoT, and more
Choose the PRTG Network Monitor subscription that's best for you



