
Last reviewed: 10/2026


PRTG gives you the choice instead of deciding it for you. Run PRTG Network Monitor entirely on your own infrastructure, including a fully air-gapped environment with no outbound connection required, or choose PRTG Hosted Monitor and let Paessler manage the server and updates for you. That choice matters most for teams under data sovereignty rules, security mandates, or air-gapped OT environments that can't send monitoring data to a third-party cloud. Running PRTG Network Monitor on-premises does mean your team owns patching and updates for that instance. If that's not what you want, PRTG Hosted Monitor removes it entirely, without giving up the option to run other parts of your environment on-premises.
PRTG scales through independent, right-sized installations rather than one growing shared server. A single, well-planned installation comfortably handles thousands of sensors distributed across remote probes, and every PRTG license includes unlimited remote probes at no extra cost, so adding a new site never adds a license fee. For organizations running many sites or subsidiaries, PRTG Enterprise Monitor includes PRTG MultiBoard and PRTG Multi-Core Dashboards at no extra cost, giving you one consolidated view across every independent PRTG server. In our 2026 survey of 1,088 IT teams, decentralized enterprises were the segment most likely to run PRTG across distributed sites and remote offices (55.3%, versus 40.5% overall). Growing past a few thousand sensors does take some planning around probe distribution and scanning intervals, the trade-off for local teams keeping control of their own instance while still getting the company-wide picture when they need it.
PRTG alerts on the thresholds you set, backed by historical trend visibility, so the people who know your environment decide what matters. Multi-channel notifications, from email and SMS to Slack, Teams, and PagerDuty, mean the right person hears about it the moment a threshold is crossed. You control the rule, the sensitivity, and the escalation path for every sensor, so alerting reflects how your team actually works. That transparency is what makes PRTG's alerting easy to trust and easy to tune over time.
FEATURE | PRTG PRTG | LogicMonitor LogicMonitor |
|---|---|---|
Cover IT and OT devices, including Modbus, OPC UA, and MQTT, with one license | PRTG Native Modbus TCP, OPC UA, and MQTT sensors included in every PRTG license | LogicMonitor Not among LogicMonitor's documented data collection methods (SNMP, WMI, JMX, and others) |
Add monitoring locations without extra license costs | PRTG Unlimited remote probes included in every PRTG license, at any number of sites | LogicMonitor Limited: Each additional device, site, or cloud resource consumes Hybrid Units; Essentials is capped at 999 Hybrid Units before a different package is required |
Run monitoring fully on-premises, with no outbound cloud connection required | PRTG PRTG Network Monitor operates entirely within your network, including fully air-gapped deployments | LogicMonitor LogicMonitor's Collector makes only outbound connections to its cloud platform; no offline mode is documented at any tier |
Get automated topology, dependency mapping, and config-change tracking | PRTG Limited: Delivered by PRTG UVexplorer, a separate connected product, refreshed through scheduled discoveries and surfaced inside PRTG | LogicMonitor Topology and Config Monitoring included in every platform package |
Ingest and search log data at scale, with clustering and indexing | PRTG Limited: Syslog Receiver and SNMP Trap sensors handle event collection; Paessler recommends no more than 50 sensors of this type per probe, UDP only | LogicMonitor LM Logs included in every platform package, for centralized log ingestion and search |
Alert the on-call engineer before users notice a problem | PRTG Configurable thresholds trigger multi-channel alerts (email, SMS, push, Slack, Teams, PagerDuty) the moment a metric crosses your line | LogicMonitor Dynamic thresholds and event correlation route alerts to on-call and incident tools |
Get from install to full network visibility | PRTG Auto-discovery scans the network and applies matching sensor templates automatically, ready to monitor without manual mapping | LogicMonitor Automated Infrastructure Discovery uses Active Discovery and Netscans to classify resources |
PRTG is priced by the number of sensors you use, with every feature included in every license, from IT and OT protocol support to unlimited remote probes. There's no separate module to unlock and no unit conversion to work out first. Pick the sensor tier that matches your environment today, and upgrade only when you need more.
| License Name | License description | Price | License Details | Get started | Pricing Details | |
|---|---|---|---|---|---|---|
| PRTG 500 | $200 | per month paid annually | Buy nowBuy now | Enough to monitor multiple aspects of 50 devices | ||
| PRTG 1000 | $358 | per month paid annually | Buy nowBuy now | Enough to monitor multiple aspects of 100 devices | ||
| PRTG 2500 | $742 | per month paid annually | Buy nowBuy now | Enough to monitor multiple aspects of 250 devices | ||
| PRTG 5000 | $1,300 | per month paid annually | Buy nowBuy now | Enough to monitor multiple aspects of 500 devices | ||
| PRTG 10000 | $1,642 | per month paid annually | Buy nowBuy now | Enough to monitor multiple aspects of 1000 devices |
“We had been monitoring our environment with LogicMonitor, but it was inflexible and unreliable. It did not offer a wide enough range of sensor types, and had the additional downside of needing connectivity. PRTG, on the other hand, provides much needed insight into the health of our systems and applications, and gives us advance notice of potential issues.”
PRTG brings your entire infrastructure into one interface, from network devices and servers to cloud services and OT protocols. Every view updates in near real time as sensors report in, so you're looking at current status, not a snapshot from an hour ago. The screens below show what a typical PRTG installation looks like once auto-discovery has done its work.
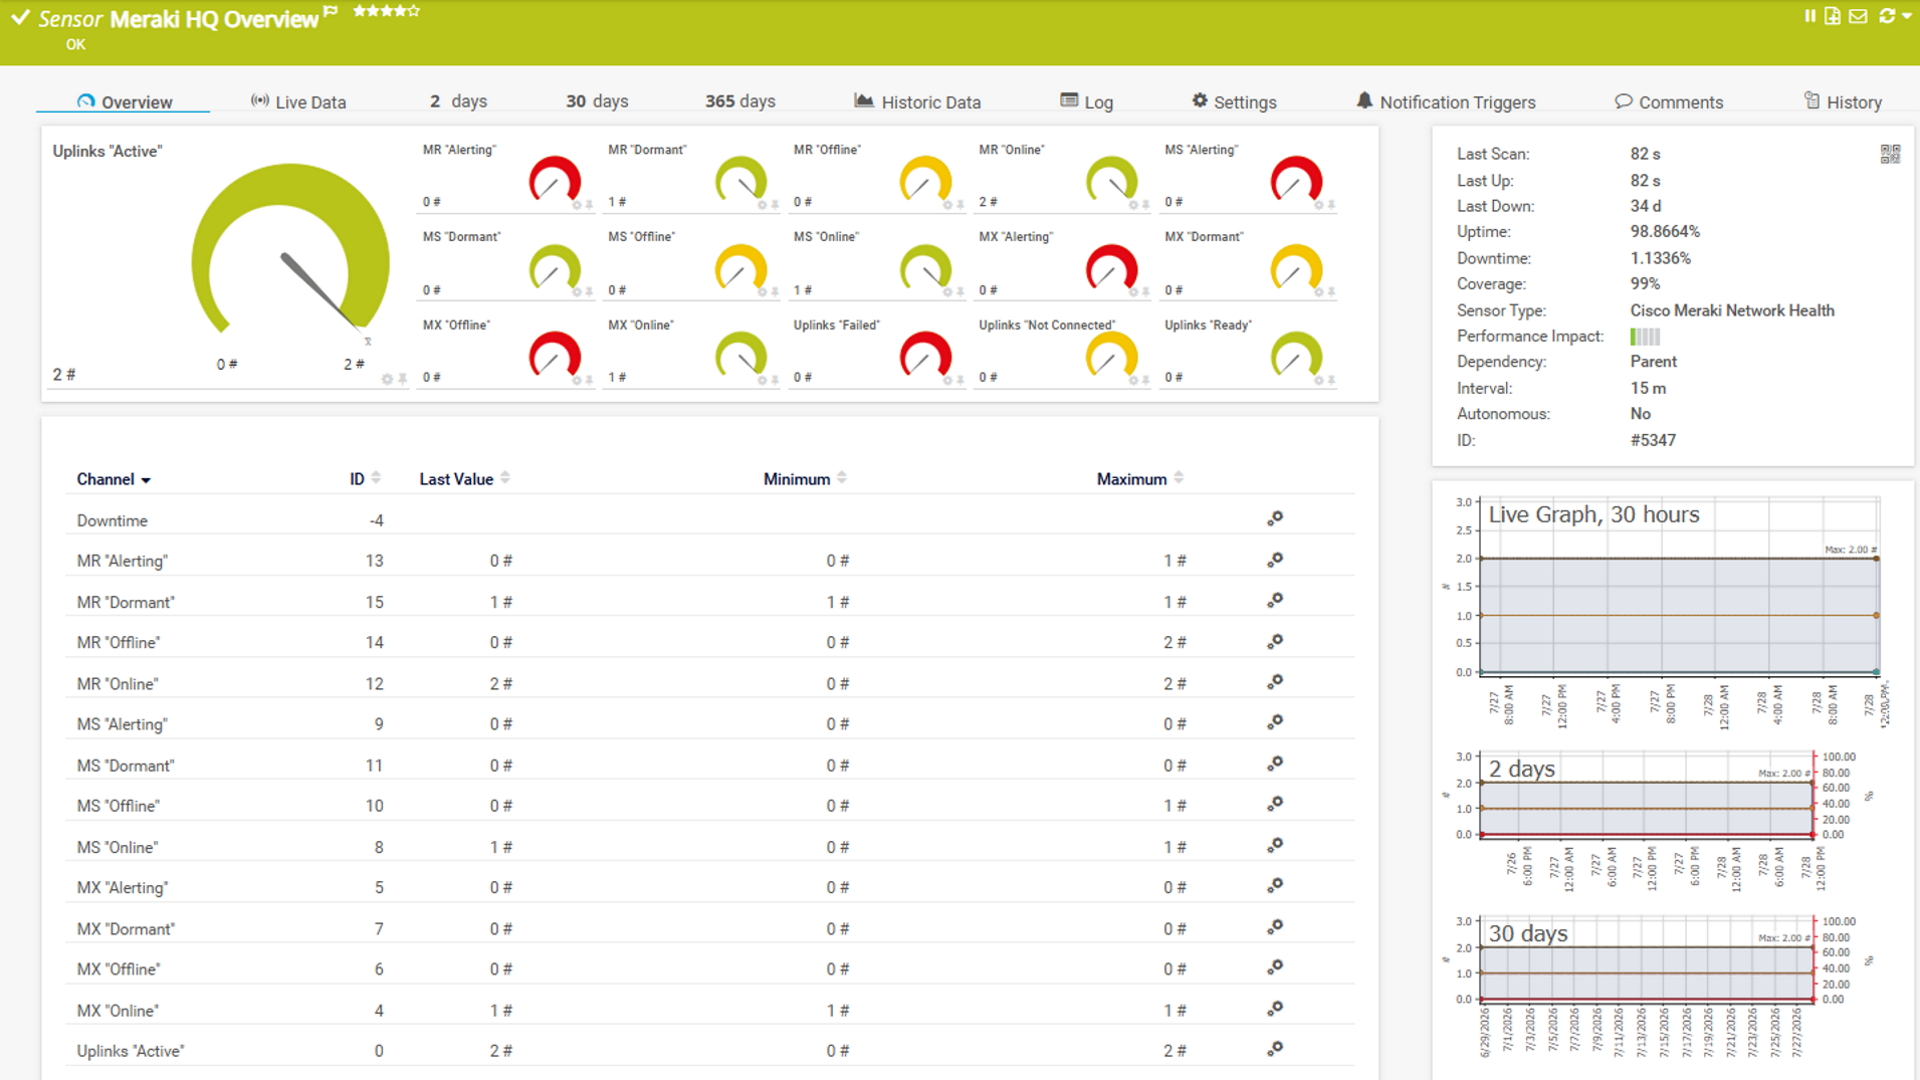
Sensor traffic: live sensor data, updated on your configured scan interval
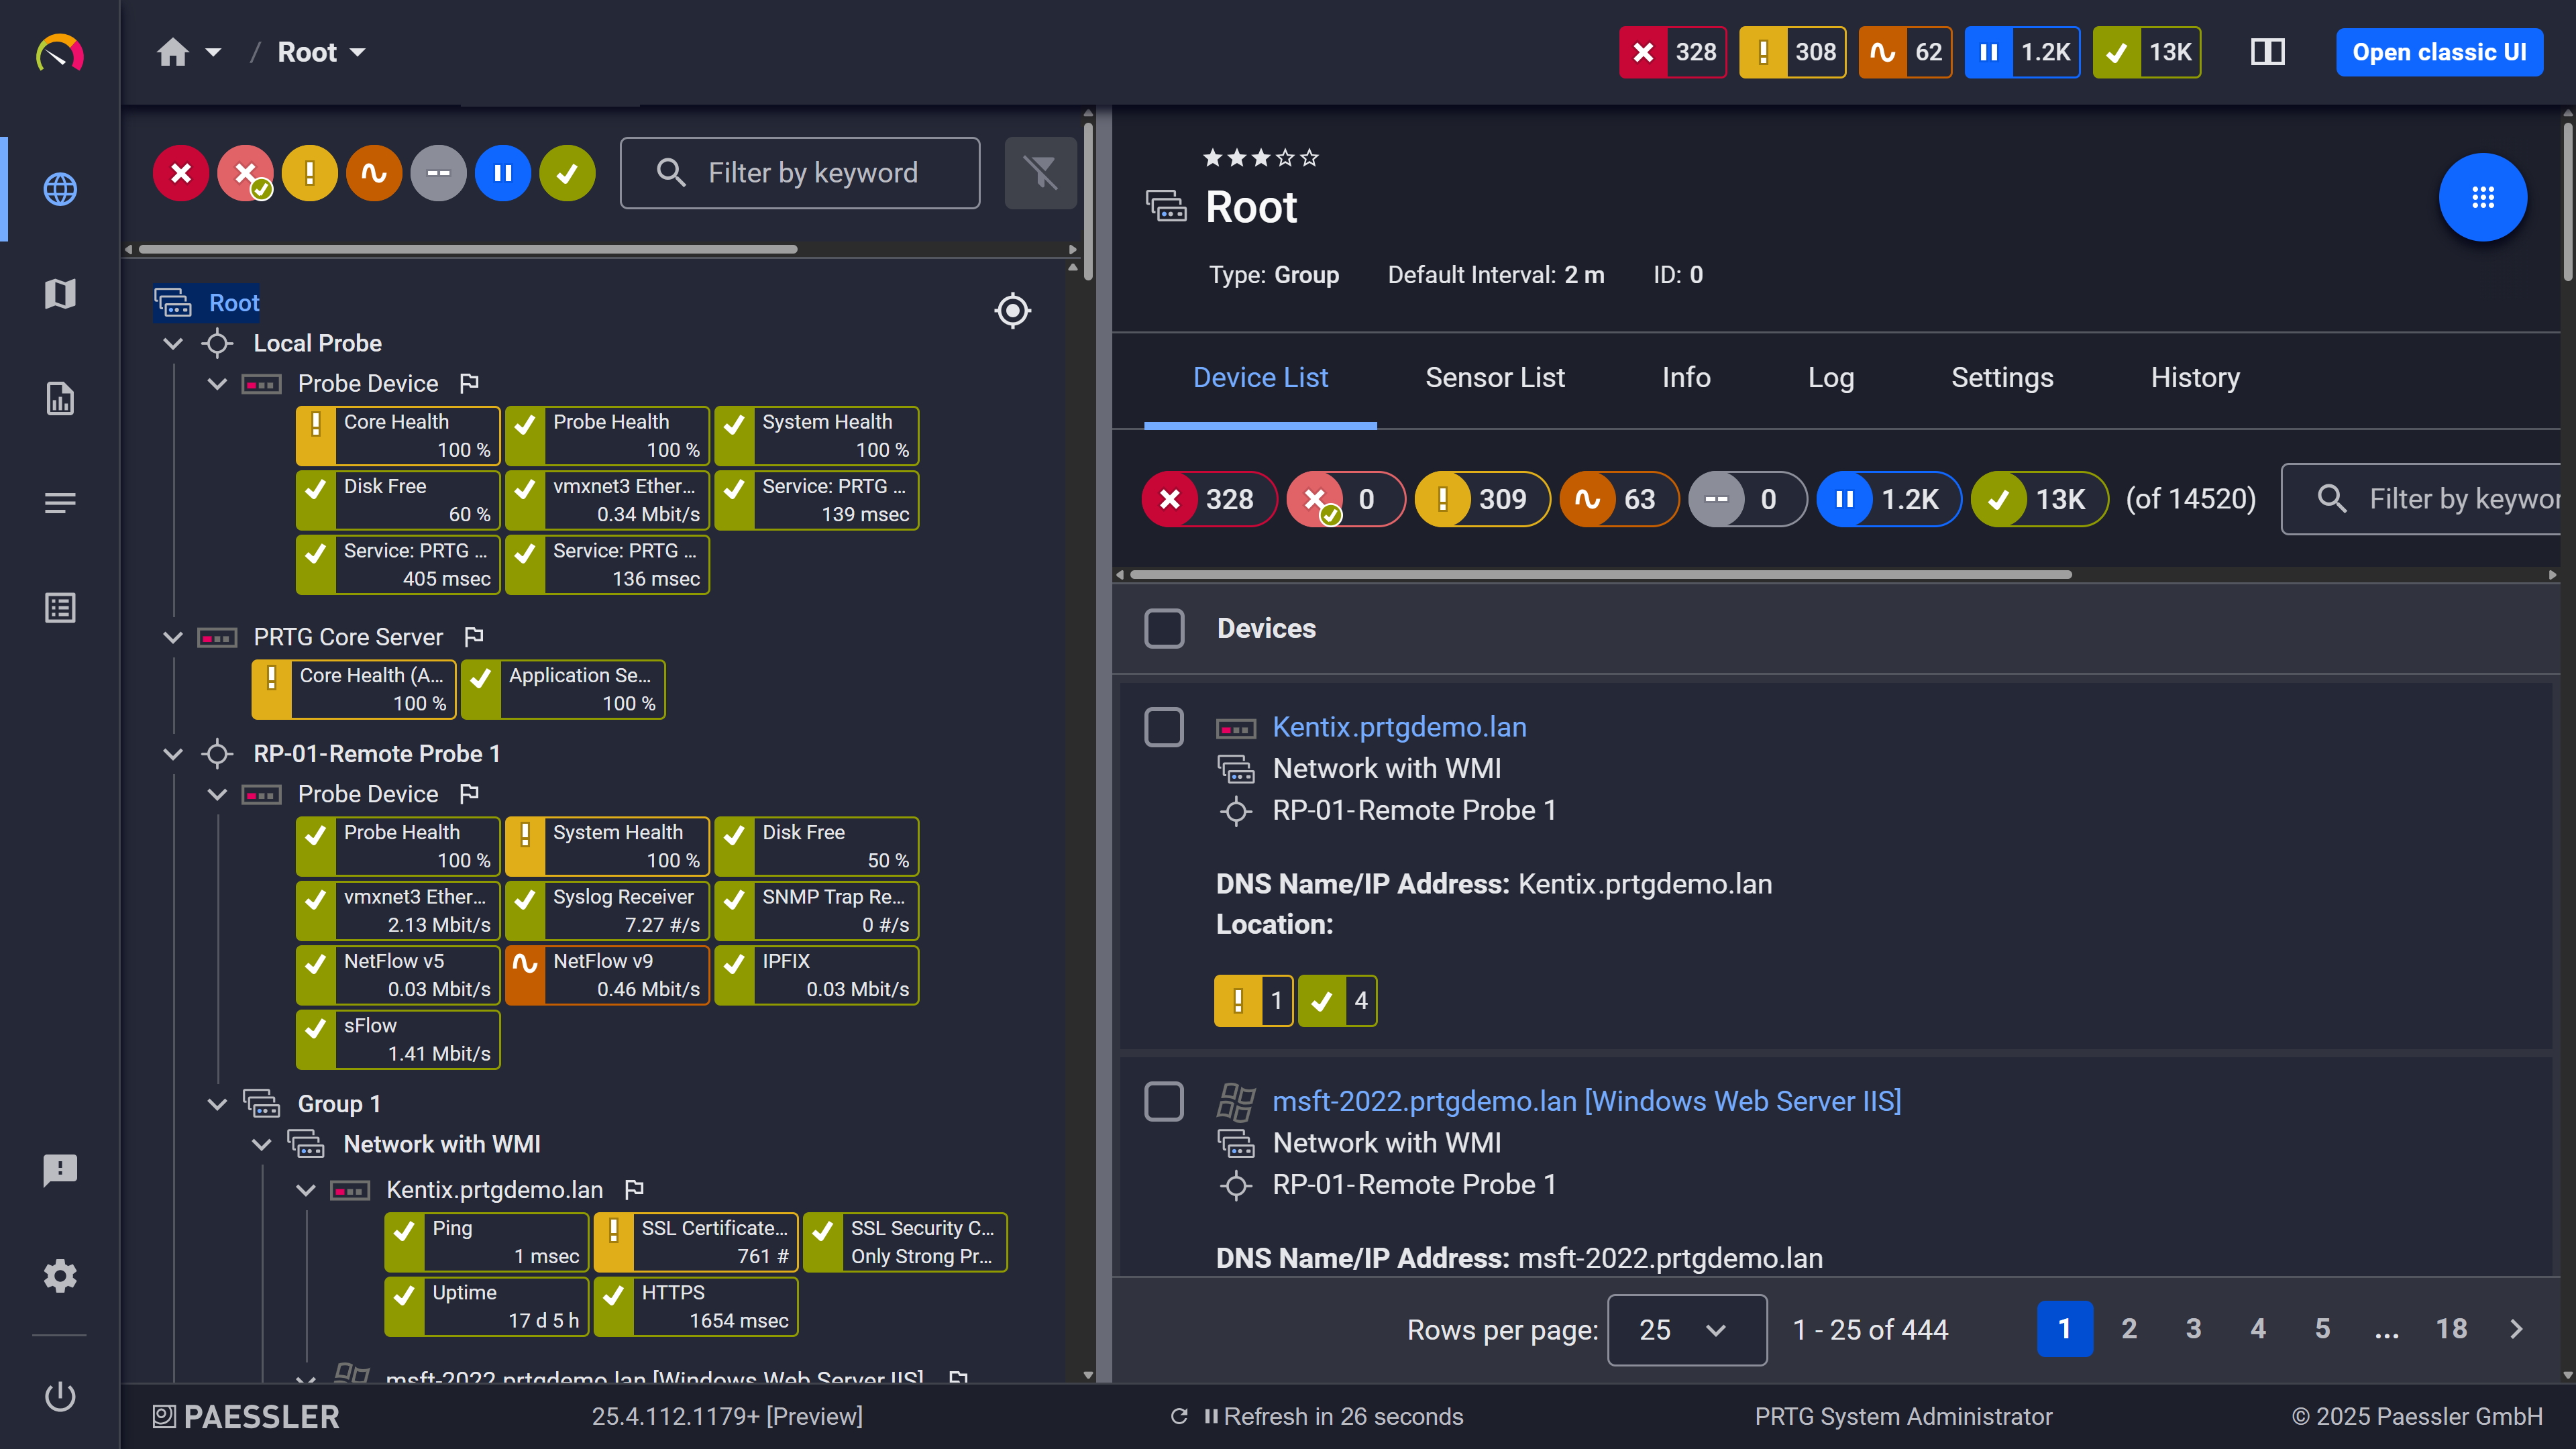
Device tree view: your full infrastructure, organized automatically after auto-discovery
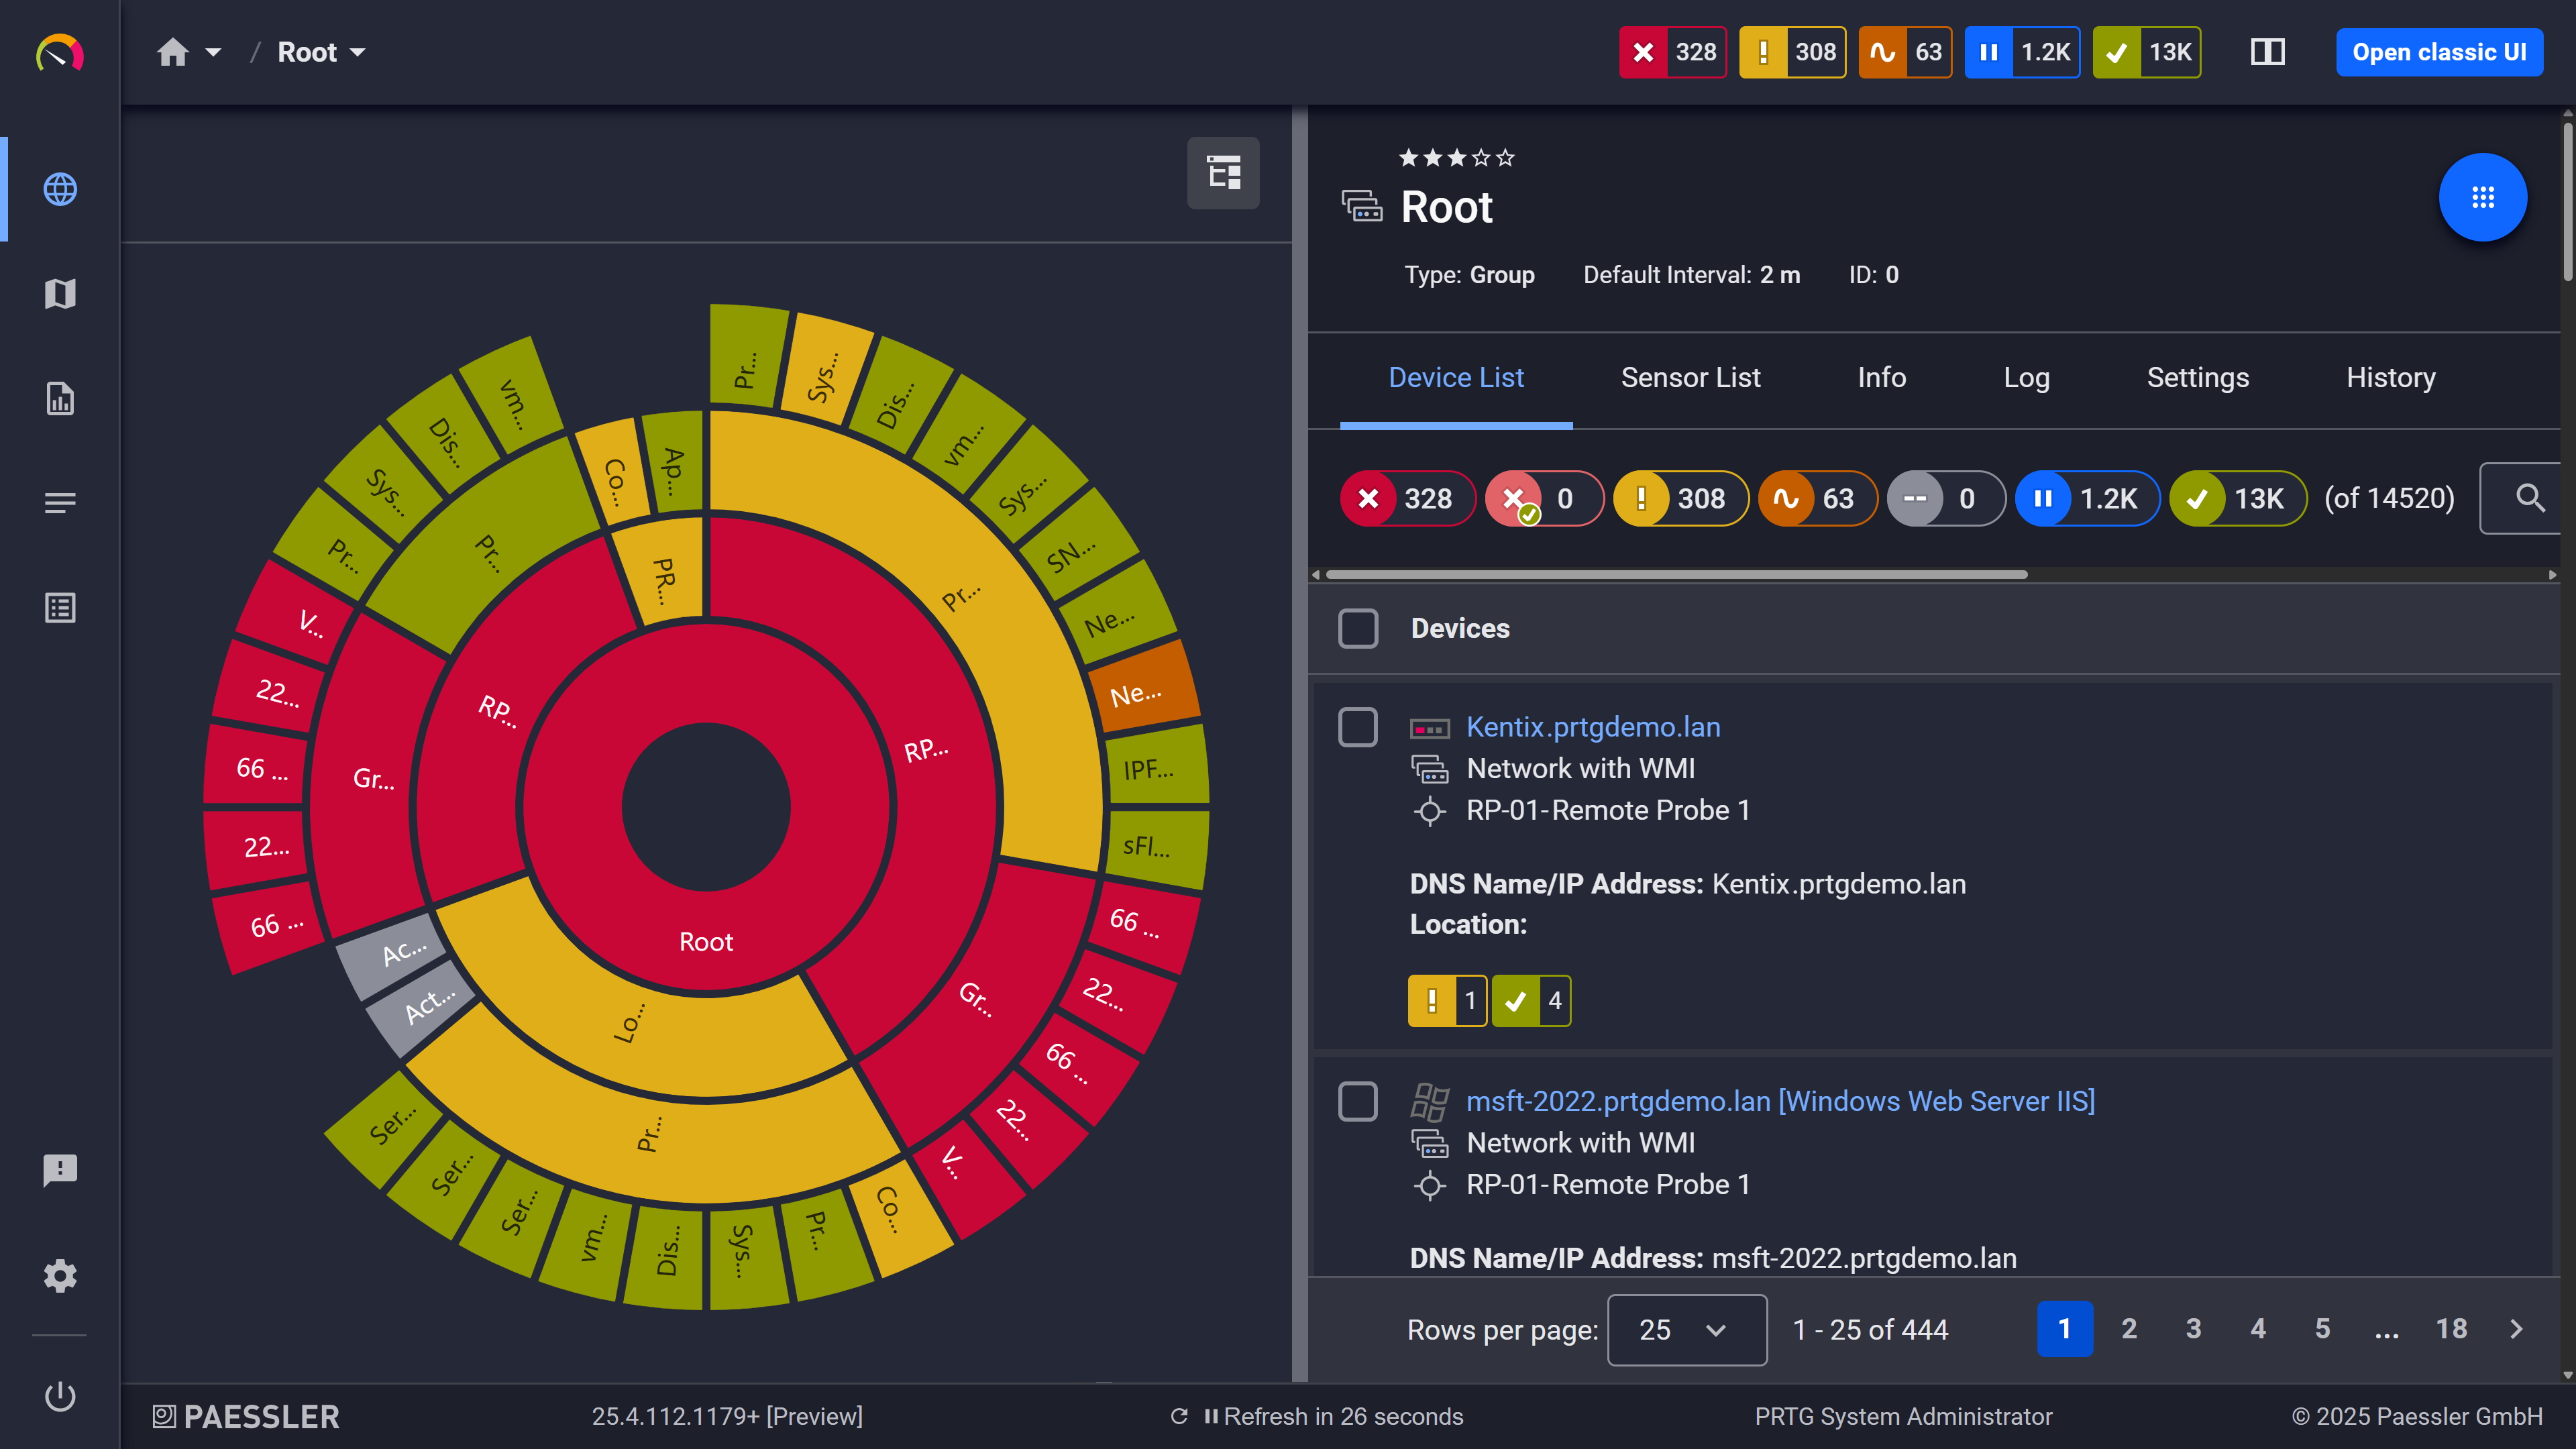
Custom dashboard: your easy-to-grasp overview built from your own sensors
Switching to PRTG follows one simple principle: your live network is the source. PRTG's auto-discovery reads what actually exists and rebuilds your monitoring directly from it. Four steps take you from your current setup to a running PRTG installation.
Have a list of hostnames or IP addresses of your current device. This can be from your own documentation, or get it from your current monitoring tool. In LogicMonitor, export your resource list from the Resource Inventory report (Reports > Add Report > Resource Inventory). This list is your completeness checklist for the entire switch. Then install PRTG alongside your current tool: both can run in parallel during the transition.
Let auto-discovery rebuild your monitoring. Enter your IP ranges and device credentials (e.g. for protocols like SNMP or WMI). PRTG's auto-discovery scans the network segments, identifies device types, and creates suitable sensors from built-in device templates. The rebuild comes from your live network, so it reflects what is really there. Compare the result against your device list from step 1 and add any sensors auto-discovery could not infer.
Translate concepts, not configurations. What you know maps cleanly to PRTG. Collectors become remote probes, resources become devices, DataSources become sensors, and dashboards become maps. Then recreate your alerting workflows with PRTG's notification templates and triggers.
Run both systems in parallel and tune. Compare alerts side by side for a few weeks. Adjust thresholds and schedules, and build the maps and reports your team and leadership rely on. Decommission the old tool once PRTG has proven itself in daily operation.
A tool switch is the ideal moment to find out what your old setup wasn't watching. PRTG UVexplorer, a separate product whose data is surfaced inside PRTG, runs scheduled discoveries that build a multi-vendor topology map and asset inventory of what actually exists on your network. Compare that inventory against what LogicMonitor was monitoring, and close any blind spots before they carry over. After cutover, the same point-in-time snapshot confirms that your PRTG rebuild caught everything.
Sensor-based licensing means you pay for the metrics you actually monitor, not a flat per-device or per-user fee. Every PRTG license tier includes the full feature set, so there's no separate charge to unlock OT protocols, cloud sensors, or remote probes as your environment grows. You choose the sensor tier that fits your current environment and move up only when you need more, with no unit conversions to calculate first.
Not anymore. LogicMonitor moved from a device-based pricing model to a package structure built on Hybrid Units in September 2025, sold in three tiers (Essentials, Advanced, and Signature plus Edwin AI). One Hybrid Unit can represent one on-premises collector-monitored device, one cloud IaaS instance, seven cloud PaaS resources, or five wireless access points, depending on what you're monitoring. PRTG's sensor-based model skips that conversion step entirely: a sensor is a sensor, regardless of what it's monitoring.
Yes. LM Envision is the name of LogicMonitor's unified observability platform, so comparing PRTG to LogicMonitor covers the same ground as comparing it to LM Envision.
Industrial protocols aren't among the data collection methods LogicMonitor documents for its Collector, which lists methods such as SNMP, WMI, and JMX. PRTG includes Modbus TCP, OPC UA, and MQTT sensors out of the box, so IT and OT devices share one license and one dashboard from day one.
You can monitor Kubernetes metrics through PRTG's REST or Prometheus-based custom sensors by pointing them at your cluster's metrics endpoints. PRTG doesn't include a dedicated, preconfigured Kubernetes sensor template.
Nothing imports directly from LogicMonitor. PRTG's auto-discovery scans your network and rebuilds your device tree with matching sensor templates, which is faster than manual setup but still a rebuild, not a one-click migration. Alerts, dashboards, and notification rules need to be recreated in PRTG to match how your team works.
Yes. PRTG Network Monitor runs entirely within your own network with no outbound connection required, including fully air-gapped deployments. That's a structural difference from LogicMonitor's collector-based architecture, where LogicMonitor's own security documentation confirms the Collector only makes outbound connections to LogicMonitor's cloud platform.
PRTG isn't a compliance tool on its own, but its monitoring data and logs support what auditors actually check for: proof that your infrastructure was monitored and that availability targets were met. According to our 2026 survey of 1,088 IT teams, compliance or regulatory requirements were a critical or major factor in tool selection for 49.7% of respondents. Running PRTG fully on-premises, including air-gapped, also keeps that monitoring data under your own control.
We also compared PRTG with other monitoring tools:
The basic version of the open-source tool Nagios is free of charge. But most users spent many hours to set up and customize the tool. In case of problems, browsing through forums is often the only solution.
ControlUp offers strong digital experience monitoring but complex pricing and limited network insights. PRTG provides full visibility, clear sensor-based pricing, and flexible deployment.
SolarWinds might be interesting for extremely complex network environments. But it also means you need to invest in higher costs for a platform made up of different modules and add-ons (that cost extra).
Checkmk is a comprehensive network monitoring tool, but it uses open-source add-ons for some functions. This means additional work in setting up, operating, and maintaining the monitoring systems.
Start a 30-day trial with unlimited sensors, no commitment required.
Tell us your device count and we'll send you a quote.
See PRTG in a live demo with one of our monitoring experts.
