
Last reviewed: 10/2026


PRTG licenses by sensor: each metric you monitor, a server's CPU load, a switch port's traffic, a service's status, counts as one sensor, and you choose a subscription tier sized to your total. That tier is a fixed monthly rate, so the number doesn't move depending on how much data you send or how many people log in. You know your cost before you deploy, not after the first invoice arrives. Environments that grow will eventually need a larger tier as sensor count rises, that part is honest, but it's still one number to plan around instead of several usage meters running at once.
PRTG collects, alerts, and visualizes from a single installation: auto-discovery finds your devices, built-in sensors start monitoring them, and dashboards and maps sit on the same screen you configure alerts from. That means one platform to patch and maintain instead of running a collector, a time-series database, and a visualization layer as three separate systems. It's also why PRTG shows up as a Grafana equivalent for teams that want collection and visualization in one place: in our 2026 survey of 1,088 IT teams, 60.2% of midmarket respondents picked PRTG because it's one tool that covers everything (blog.paessler.com/what-1088-it-teams-told-us-about-monitoring-in-2026). Teams moving over usually aren't fixing something broken, they're reclaiming the hours spent keeping a multi-tool stack current. If your setup already runs smoothly and your team enjoys maintaining it, that's worth honoring, the case for switching here is about the hours you get back, not a verdict on what you're running today.
PRTG's map and dashboard editor works by drag-and-drop: pull a sensor, a status icon, or a live graph onto a canvas, arrange it, and publish it, no query language required to see your first view. Because every element is tied directly to a sensor you're already monitoring, a working dashboard exists the same day you install, not after a build-out project. For most day-to-day monitoring views, uptime, bandwidth, capacity, that's exactly the depth teams need. If your team wants to construct highly specific, code-level custom panels for niche data sources, that kind of open-ended customization is a genuine strength on the other side, and worth weighing honestly.
Grafana suits teams that want to build their own monitoring stack. PRTG suits teams that want monitoring working the day they install it.
FEATURE | PRTG PRTG | Grafana Grafana |
|---|---|---|
Cover networks, servers, applications, and cloud with one license | PRTG Included in every PRTG license: network, server, application, and cloud sensors ship together | Grafana Limited: primarily a visualization layer, full coverage requires a separate collector such as Prometheus or InfluxDB |
Get automatic network discovery without a third-party plugin | PRTG Built-in auto-discovery scans IP ranges and creates sensors from device templates | Grafana Limited: no native discovery, targets are added manually via scrape configs or file-based service discovery |
Alert your on-call team without a separate on-call product | PRTG Multi-channel alerting (email, SMS, push, Slack, Teams) built into every license | Grafana Limited: on-call scheduling and escalation is Grafana IRM, billed per active user beyond the free allotment |
Run monitoring without deploying a separate time-series database | PRTG Sensors write to PRTG's own built-in database, no external database server to install | Grafana Limited: metrics need a backend such as Prometheus or Mimir, Grafana visualizes what that backend stores |
Monitor application performance without a separate paid module | PRTG Application and service monitoring sensors are included, no add-on to purchase | Grafana Limited: Application Observability is a separately metered Cloud product, priced per host-hour |
Add monitoring locations without extra license costs | PRTG Unlimited remote probes included in every license, add sites without buying more licenses | Grafana Limited: cost scales with active series and host-hours at each additional site |
Monitor bandwidth and traffic across branch offices | PRTG NetFlow, sFlow, and packet-sniffing sensors are built in for branch-office traffic | Grafana Visualizes flow data once a flow exporter or collector feeds it in |
Keep virtualization hosts and storage visible | PRTG Native VMware, Hyper-V, and Nutanix sensors, no exporter to install | Grafana Visualized through community exporters for your hypervisor once configured |
Alert the on-call engineer before users notice an outage | PRTG Threshold and state-based alerts trigger through email, SMS, push, Slack, or Teams the moment a sensor changes state | Grafana Alert rules trigger notifications, on-call scheduling and escalation run through the separate IRM product |
Build highly customized dashboards for niche or non-standard data sources | PRTG Limited: dashboards are ready-made and sensor-driven, not built for arbitrary custom panel types | Grafana 150+ plugins and a broad panel library support highly custom visualizations |
Correlate distributed traces and code-level profiling for custom applications | PRTG Limited: PRTG monitors infrastructure and application health, not code-level traces or profiling | Grafana Native OpenTelemetry-based tracing and continuous profiling are part of the stack |
PRTG is priced by sensor, not by data volume, host count, or active users. You choose a subscription tier sized to what you want to monitor, and every tier includes the same full feature set, no add-on modules to unlock alerting, application monitoring, or reporting. That's a different shape from Grafana Cloud, where metrics, logs, traces, dashboards, and on-call each carry their own separate charge, one of the clearest differences among alternatives to Grafana.
| License Name | License description | Price | License Details | Get started | Pricing Details | |
|---|---|---|---|---|---|---|
| PRTG 500 | $200 | per month paid annually | Buy nowBuy now | Enough to monitor multiple aspects of 50 devices | ||
| PRTG 1000 | $358 | per month paid annually | Buy nowBuy now | Enough to monitor multiple aspects of 100 devices | ||
| PRTG 2500 | $742 | per month paid annually | Buy nowBuy now | Enough to monitor multiple aspects of 250 devices | ||
| PRTG 5000 | $1,300 | per month paid annually | Buy nowBuy now | Enough to monitor multiple aspects of 500 devices | ||
| PRTG 10000 | $1,642 | per month paid annually | Buy nowBuy now | Enough to monitor multiple aspects of 1000 devices |
“Since using PRTG, we have matured how we report out overall application uptime, maintenance, and mean time between failure for all critical applications to our board of directors. PRTG allows us to not just look at a single event, but to leverage historical data to prevent future failures and to measure how we are making improvements over time.”
After auto-discovery finishes scanning your network, PRTG shows you what it found immediately: devices, sensors, and their current status, all in one interface. From there, you can build custom dashboards and maps without writing a query, and drill into live traffic graphs whenever you need the detail.
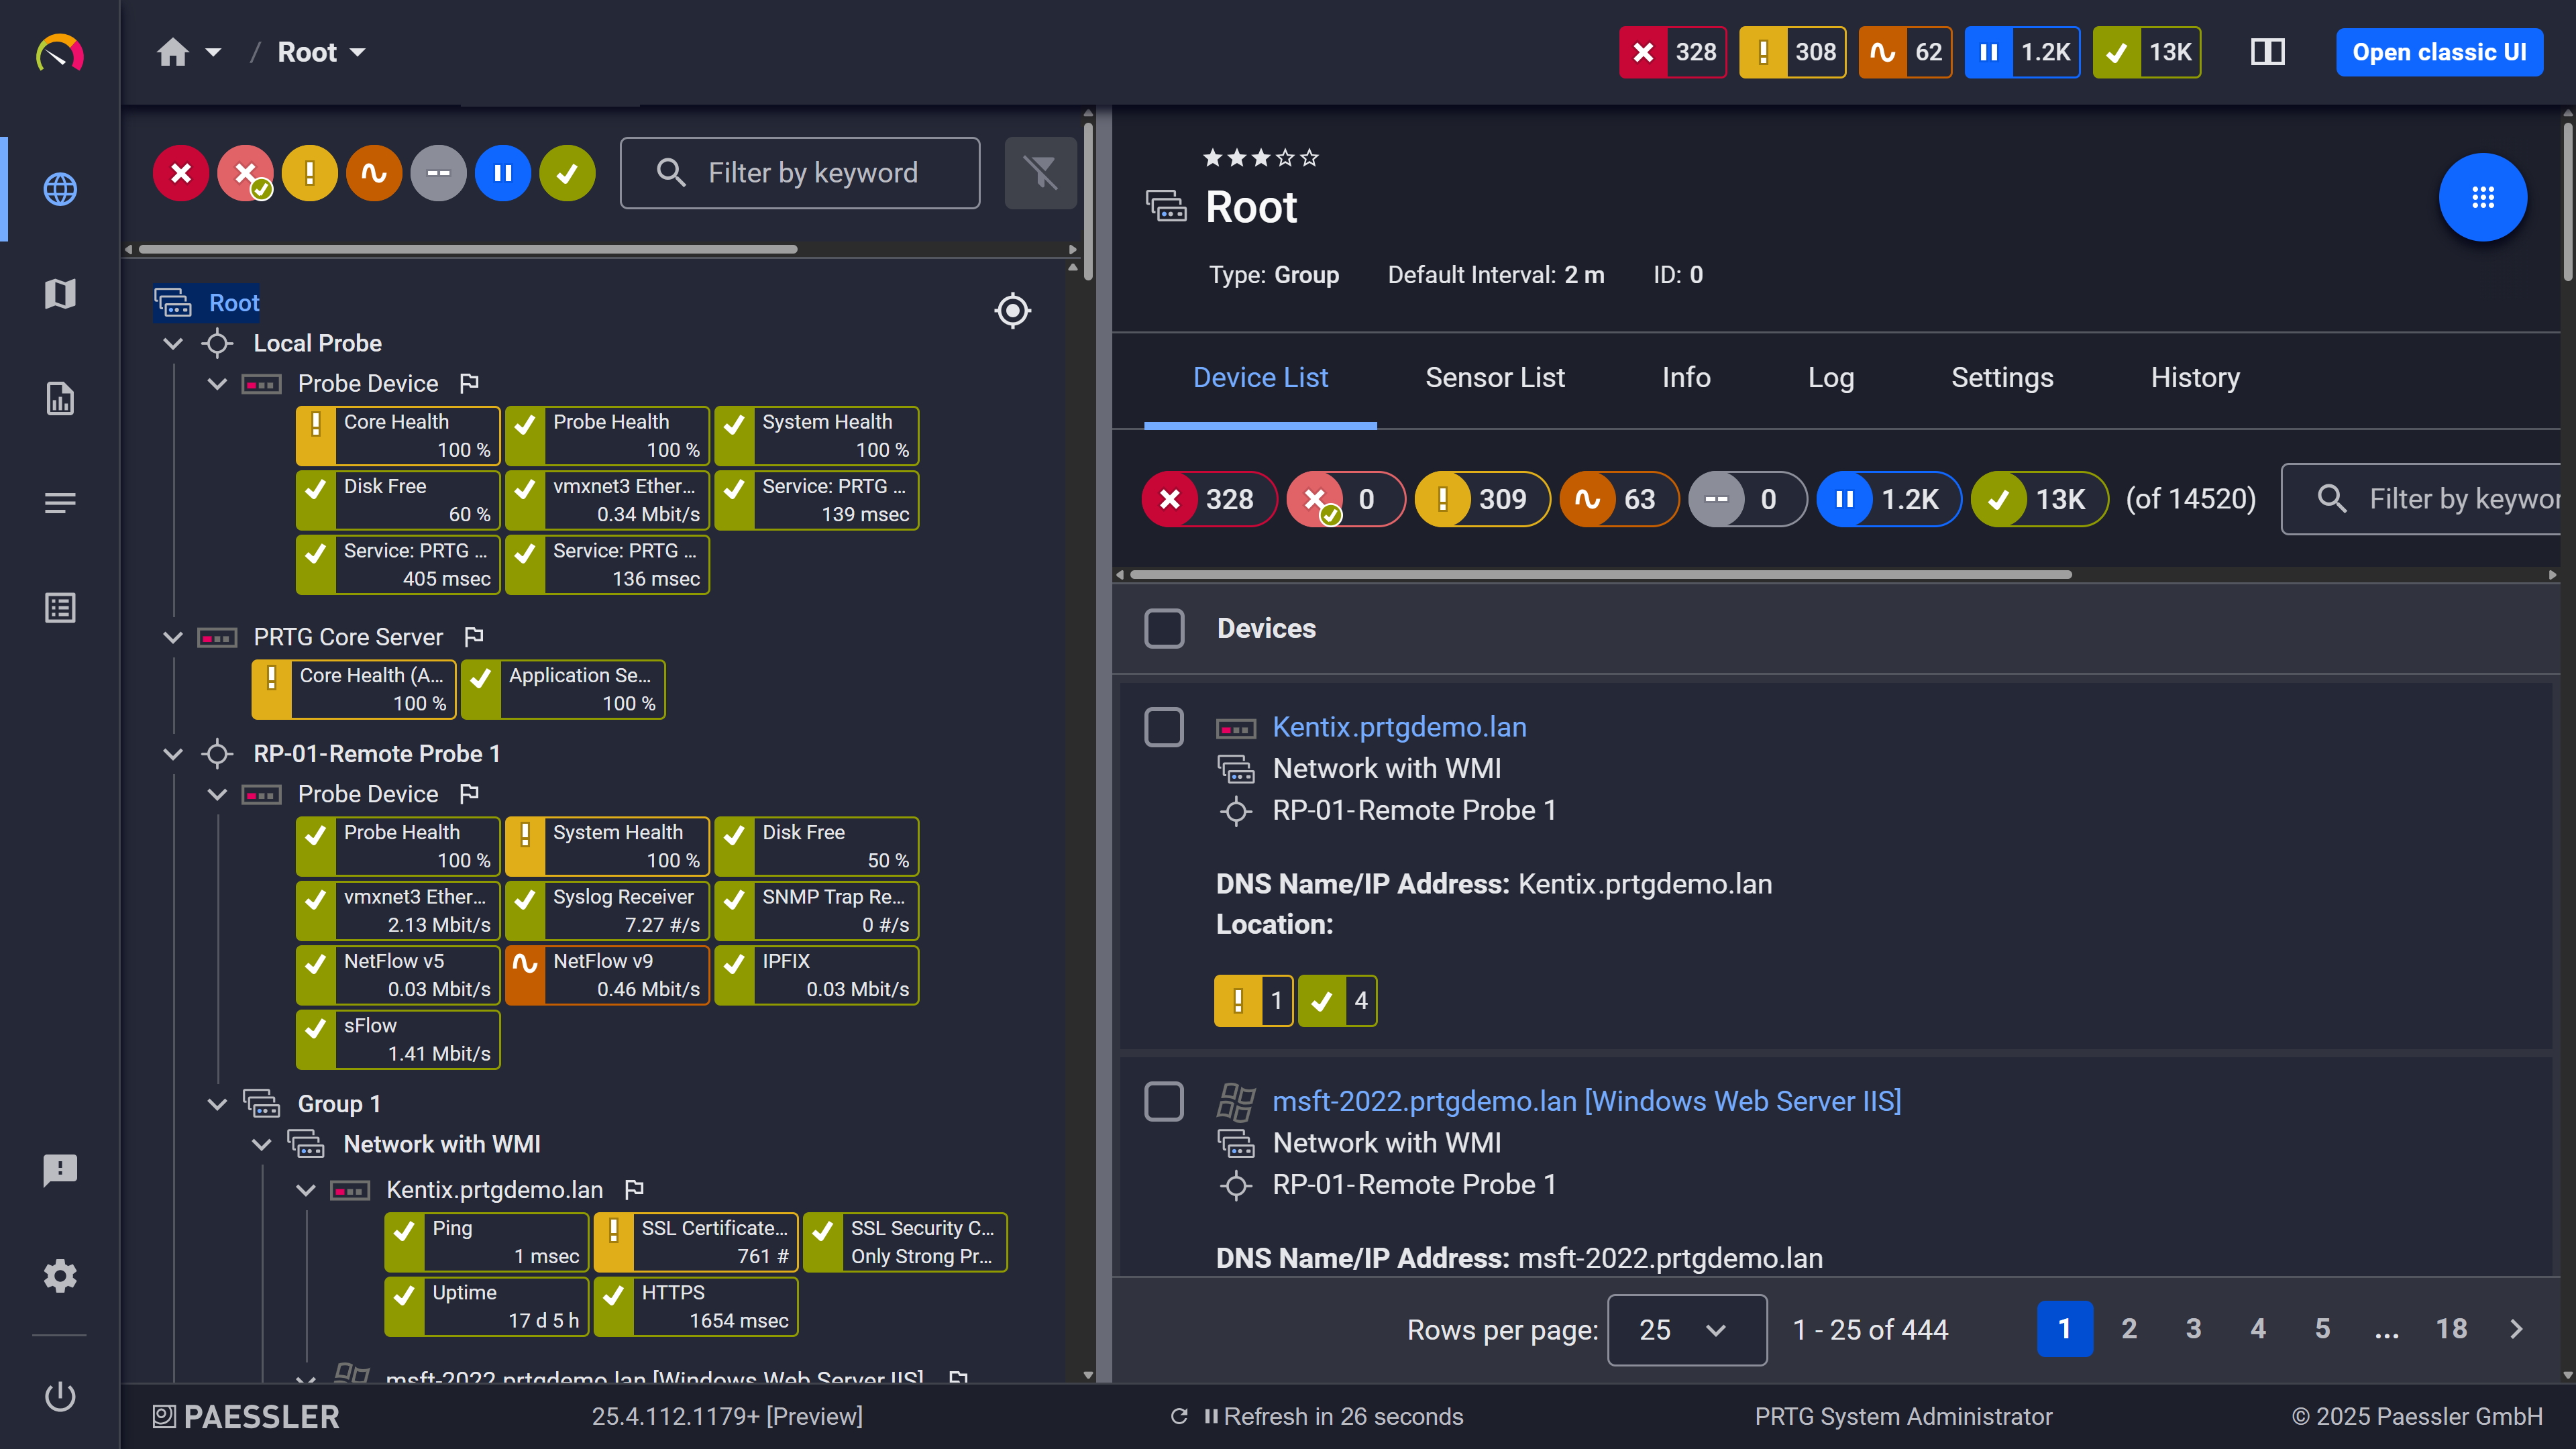
Device tree view: your full infrastructure, organized automatically after auto-discovery
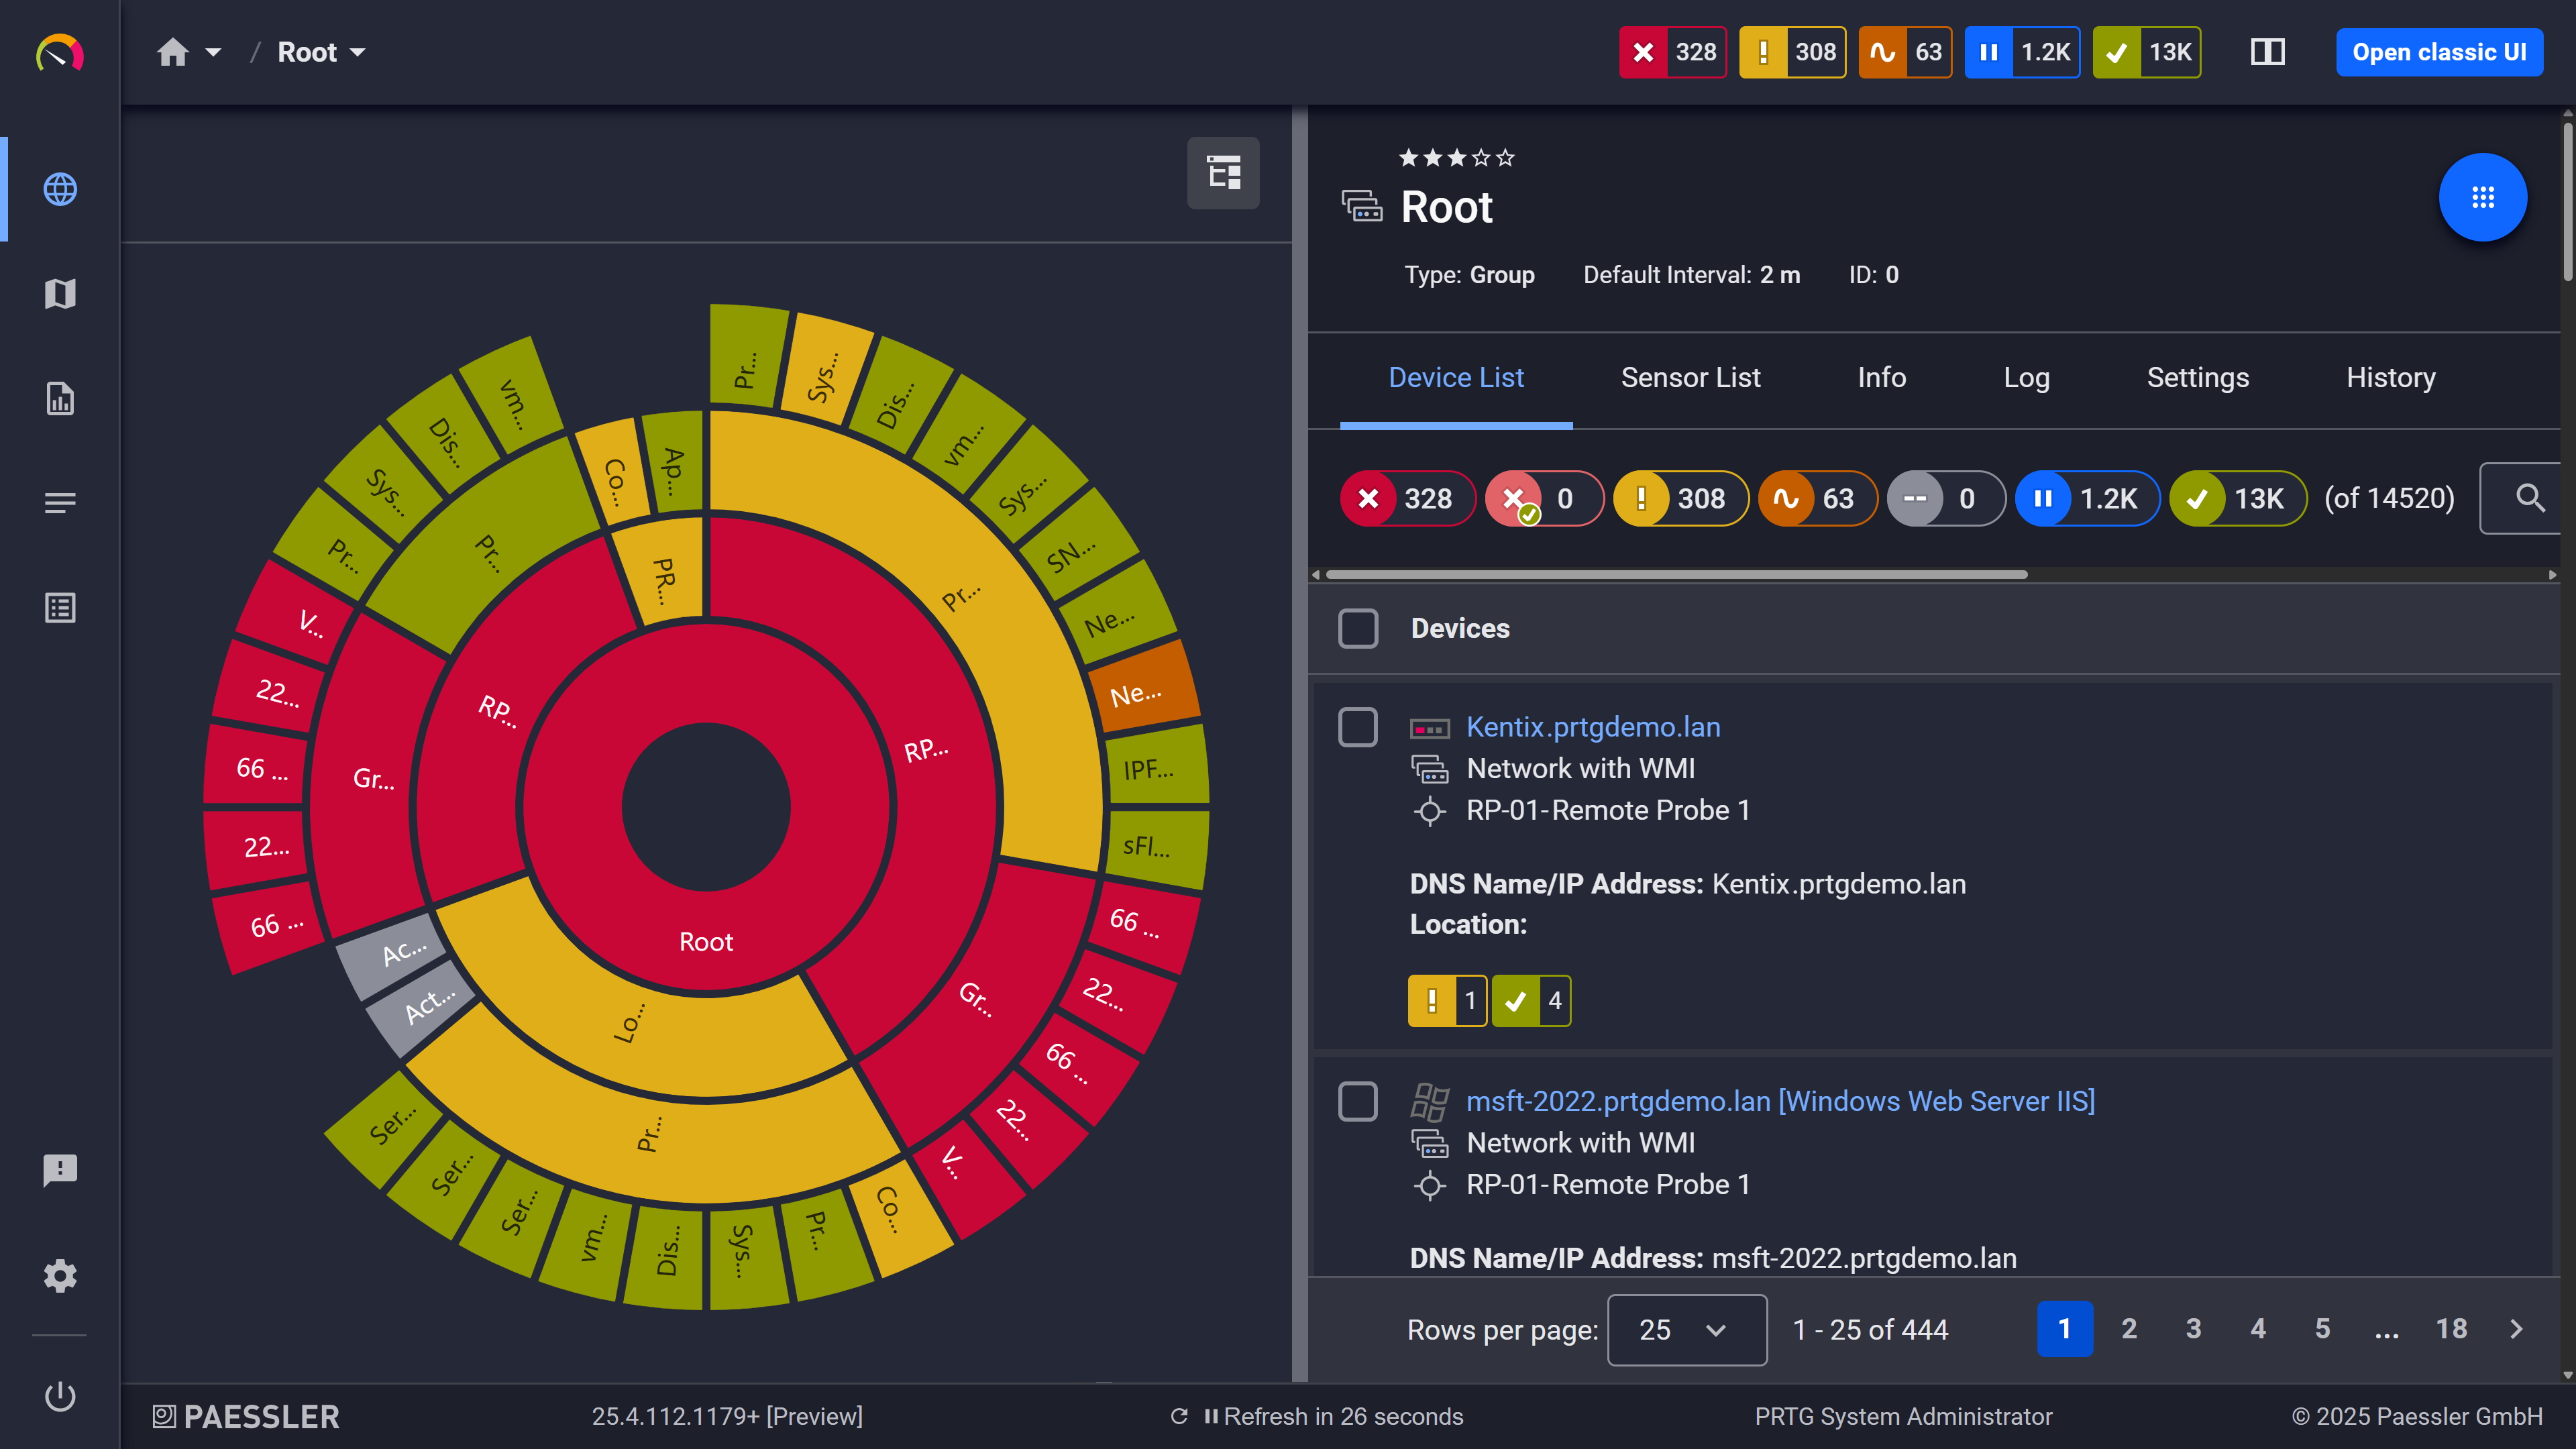
Custom dashboard: a drag-and-drop dashboard built from your own sensors
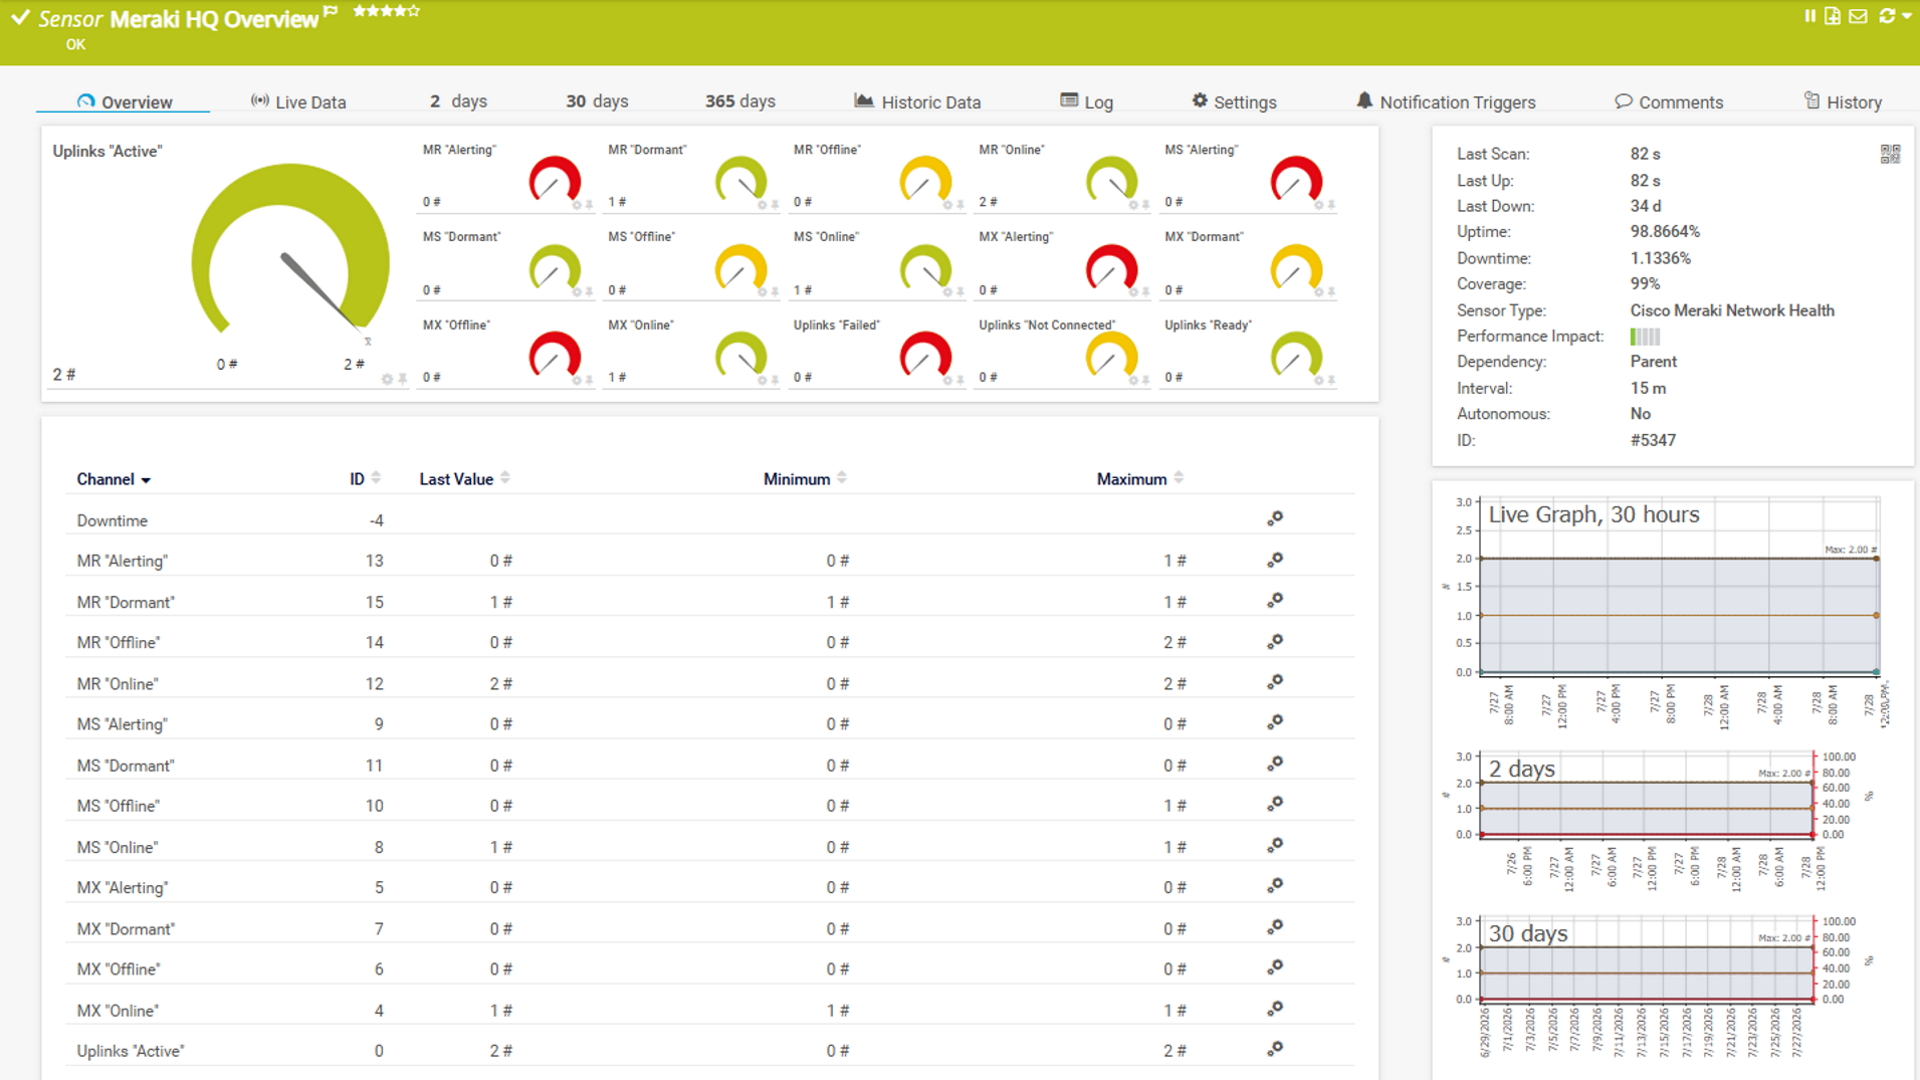
Live sensor traffic: live sensor data, updated on your configured scan interval
Switching to PRTG follows one simple principle: your live network is the source. PRTG's auto-discovery reads what actually exists and rebuilds your monitoring directly from it. Four steps take you from your current setup to a running PRTG installation.
Inventory what you monitor today: Have a list of hostnames or IP addresses of your current device. This can be from your own documentation, or get it from your current monitoring tool. Your monitored targets live in Prometheus or your metrics data source, not in Grafana itself, so pull the list from Prometheus's Status > Targets page or your scrape configuration. This list is your completeness checklist for the entire switch. Then install PRTG alongside your current tool: both can run in parallel during the transition.
Let auto-discovery rebuild your monitoring: Enter your IP ranges and device credentials (e.g. for protocols like SNMP or WMI). PRTG's auto-discovery scans the network segments, identifies device types, and creates suitable sensors from built-in device templates. The rebuild comes from your live network, so it reflects what is really there. Compare the result against your device list from step 1 and add any sensors auto-discovery could not infer.
Translate concepts, not configurations: What you know maps cleanly to PRTG. Scrape targets and exporters become devices, the individual metrics they expose become sensors, Grafana panels become PRTG maps and dashboards, and Grafana alert rules become notification triggers. Then recreate your alerting workflows with PRTG's notification templates and triggers.
Run both systems in parallel and tune: Compare alerts side by side for a few weeks. Adjust thresholds and schedules, and build the maps and reports your team and leadership rely on. Decommission the old tool once PRTG has proven itself in daily operation.
They're the same self-managed commercial product. Some review sites still list it under the older name Grafana Enterprise Stack, but Grafana's own site now calls it Grafana Enterprise. It sits alongside Grafana OSS (free, self-hosted) and Grafana Cloud (fully managed).
Yes. PRTG's REST API and REST Custom sensors can query CI/CD pipeline endpoints directly, tracking build times, deployment frequency, and uptime alongside your infrastructure monitoring. That means DevOps metrics show up on the same dashboards as your servers, network, and cloud resources, not in a separate tool.
Since this Paessler PRTG vs Grafana comparison references all three, here's the breakdown: Grafana OSS is the free, self-hosted visualization core. Grafana Enterprise adds enterprise security, additional data source plugins, and dedicated support on top of a self-managed installation. Grafana Cloud is Grafana Labs' fully managed version, billed separately for metrics, logs, traces, and other signals based on usage.
No. PRTG collects its own monitoring data directly through built-in protocols like SNMP, WMI, SSH, and packet sniffing, so there's no separate time-series database to install or maintain. You still get historical graphs and trend data, they just come from PRTG's own collection layer instead of a second system.
A sensor is the basic monitoring element in PRTG: one sensor tracks one measured value, like a switch port's traffic, a server's CPU load, or a disk's free space. Most devices need multiple sensors to cover everything you'd want visibility into, typically somewhere between 5 and 10 per device.
PRTG includes a map designer for building your own network views. For automatic Layer 2 and Layer 3 topology maps, PRTG UVexplorer is a separate product whose data is surfaced inside PRTG, refreshed through scheduled discoveries. Grafana has no native equivalent for network topology discovery; teams typically add a community panel and populate it manually.
In the same 2026 customer survey, 92.8% of respondents rated day-to-day PRTG monitoring as good or excellent. That held steady across both smaller IT teams and larger, multi-site organizations.
Yes. PRTG runs as its own independent installation and polls devices directly, so it doesn't need to touch your existing Prometheus or Grafana setup to start collecting data(for the Prometheus side of your stack, see our PRTG vs. Prometheus comparison) . Most teams run both side by side during the switch and retire the old stack once PRTG covers what they need.
We also compared PRTG with other monitoring tools:
The basic version of the open-source tool Nagios is free of charge. But most users spent many hours to set up and customize the tool. In case of problems, browsing through forums is often the only solution.
Checkmk is a comprehensive network monitoring tool, but it uses open-source add-ons for some functions. This means additional work in setting up, operating, and maintaining the monitoring systems.
PRTG and ManageEngine might seem similar at first. However, with ManageEngine, you have to choose between individual functions and purchase several modules to access the full range of features.
SolarWinds might be interesting for extremely complex network environments. But it also means you need to invest in higher costs for a platform made up of different modules and add-ons (that cost extra).
Start a 30-day trial with unlimited sensors, no commitment required.
Tell us your device count and we'll send you a quote.
See PRTG in a live demo with one of our monitoring experts.
