
- English
- Deutsch
- Español
- Français
- Italiano
- Português
Microsoft 365 service health affects every user in your organization, but the built-in Service Health Dashboard only shows what Microsoft decides to surface. It doesn't track mailbox-level metrics or correlate cloud issues with your on-premises infrastructure.
Paessler PRTG fills that gap by connecting to your tenant via the Microsoft Graph API, pulling service status, mailbox statistics, and workload health for Exchange Online, SharePoint, Teams, OneDrive for Business, and Intune directly into your monitoring platform.
What PRTG monitors: Overall Microsoft 365 subscription health, individual service status (Exchange Online, SharePoint, Teams, OneDrive, Intune), mailbox folder activity and email metrics, service disruptions and downtime, connectivity to Microsoft 365 endpoints

You can't sit there refreshing the Admin Center all day. So when Exchange goes down or Teams grinds to a halt, you find out the same way everyone else does: help desk tickets start flooding in.
PRTG tracks the operational status of every Office 365 Service automatically. You can monitor your overall subscription health or drill into specific workloads like Exchange Online, SharePoint, Teams, and Intune. Watch for performance issues, downtime, or warning states across the environment. You'll know what's actually happening with your cloud services without refreshing dashboards every hour or waiting for Microsoft to email you about it.
Mailbox problems don't announce themselves. Users don't tell you their inbox is slow until it's already impacting work. Email delays, folder sync failures, and stuck messages create help desk noise you could've prevented.
PRTG retrieves periodic snapshots of the mailbox folder sizes and item count via Graph API. Track email volume and message age in shared mailboxes, distribution lists, or executive accounts. Spot unusual activity patterns before active users complain. Identify folder sync delays that signal authentication or connectivity trouble. Turn reactive mailbox troubleshooting into proactive Performance Monitoring.
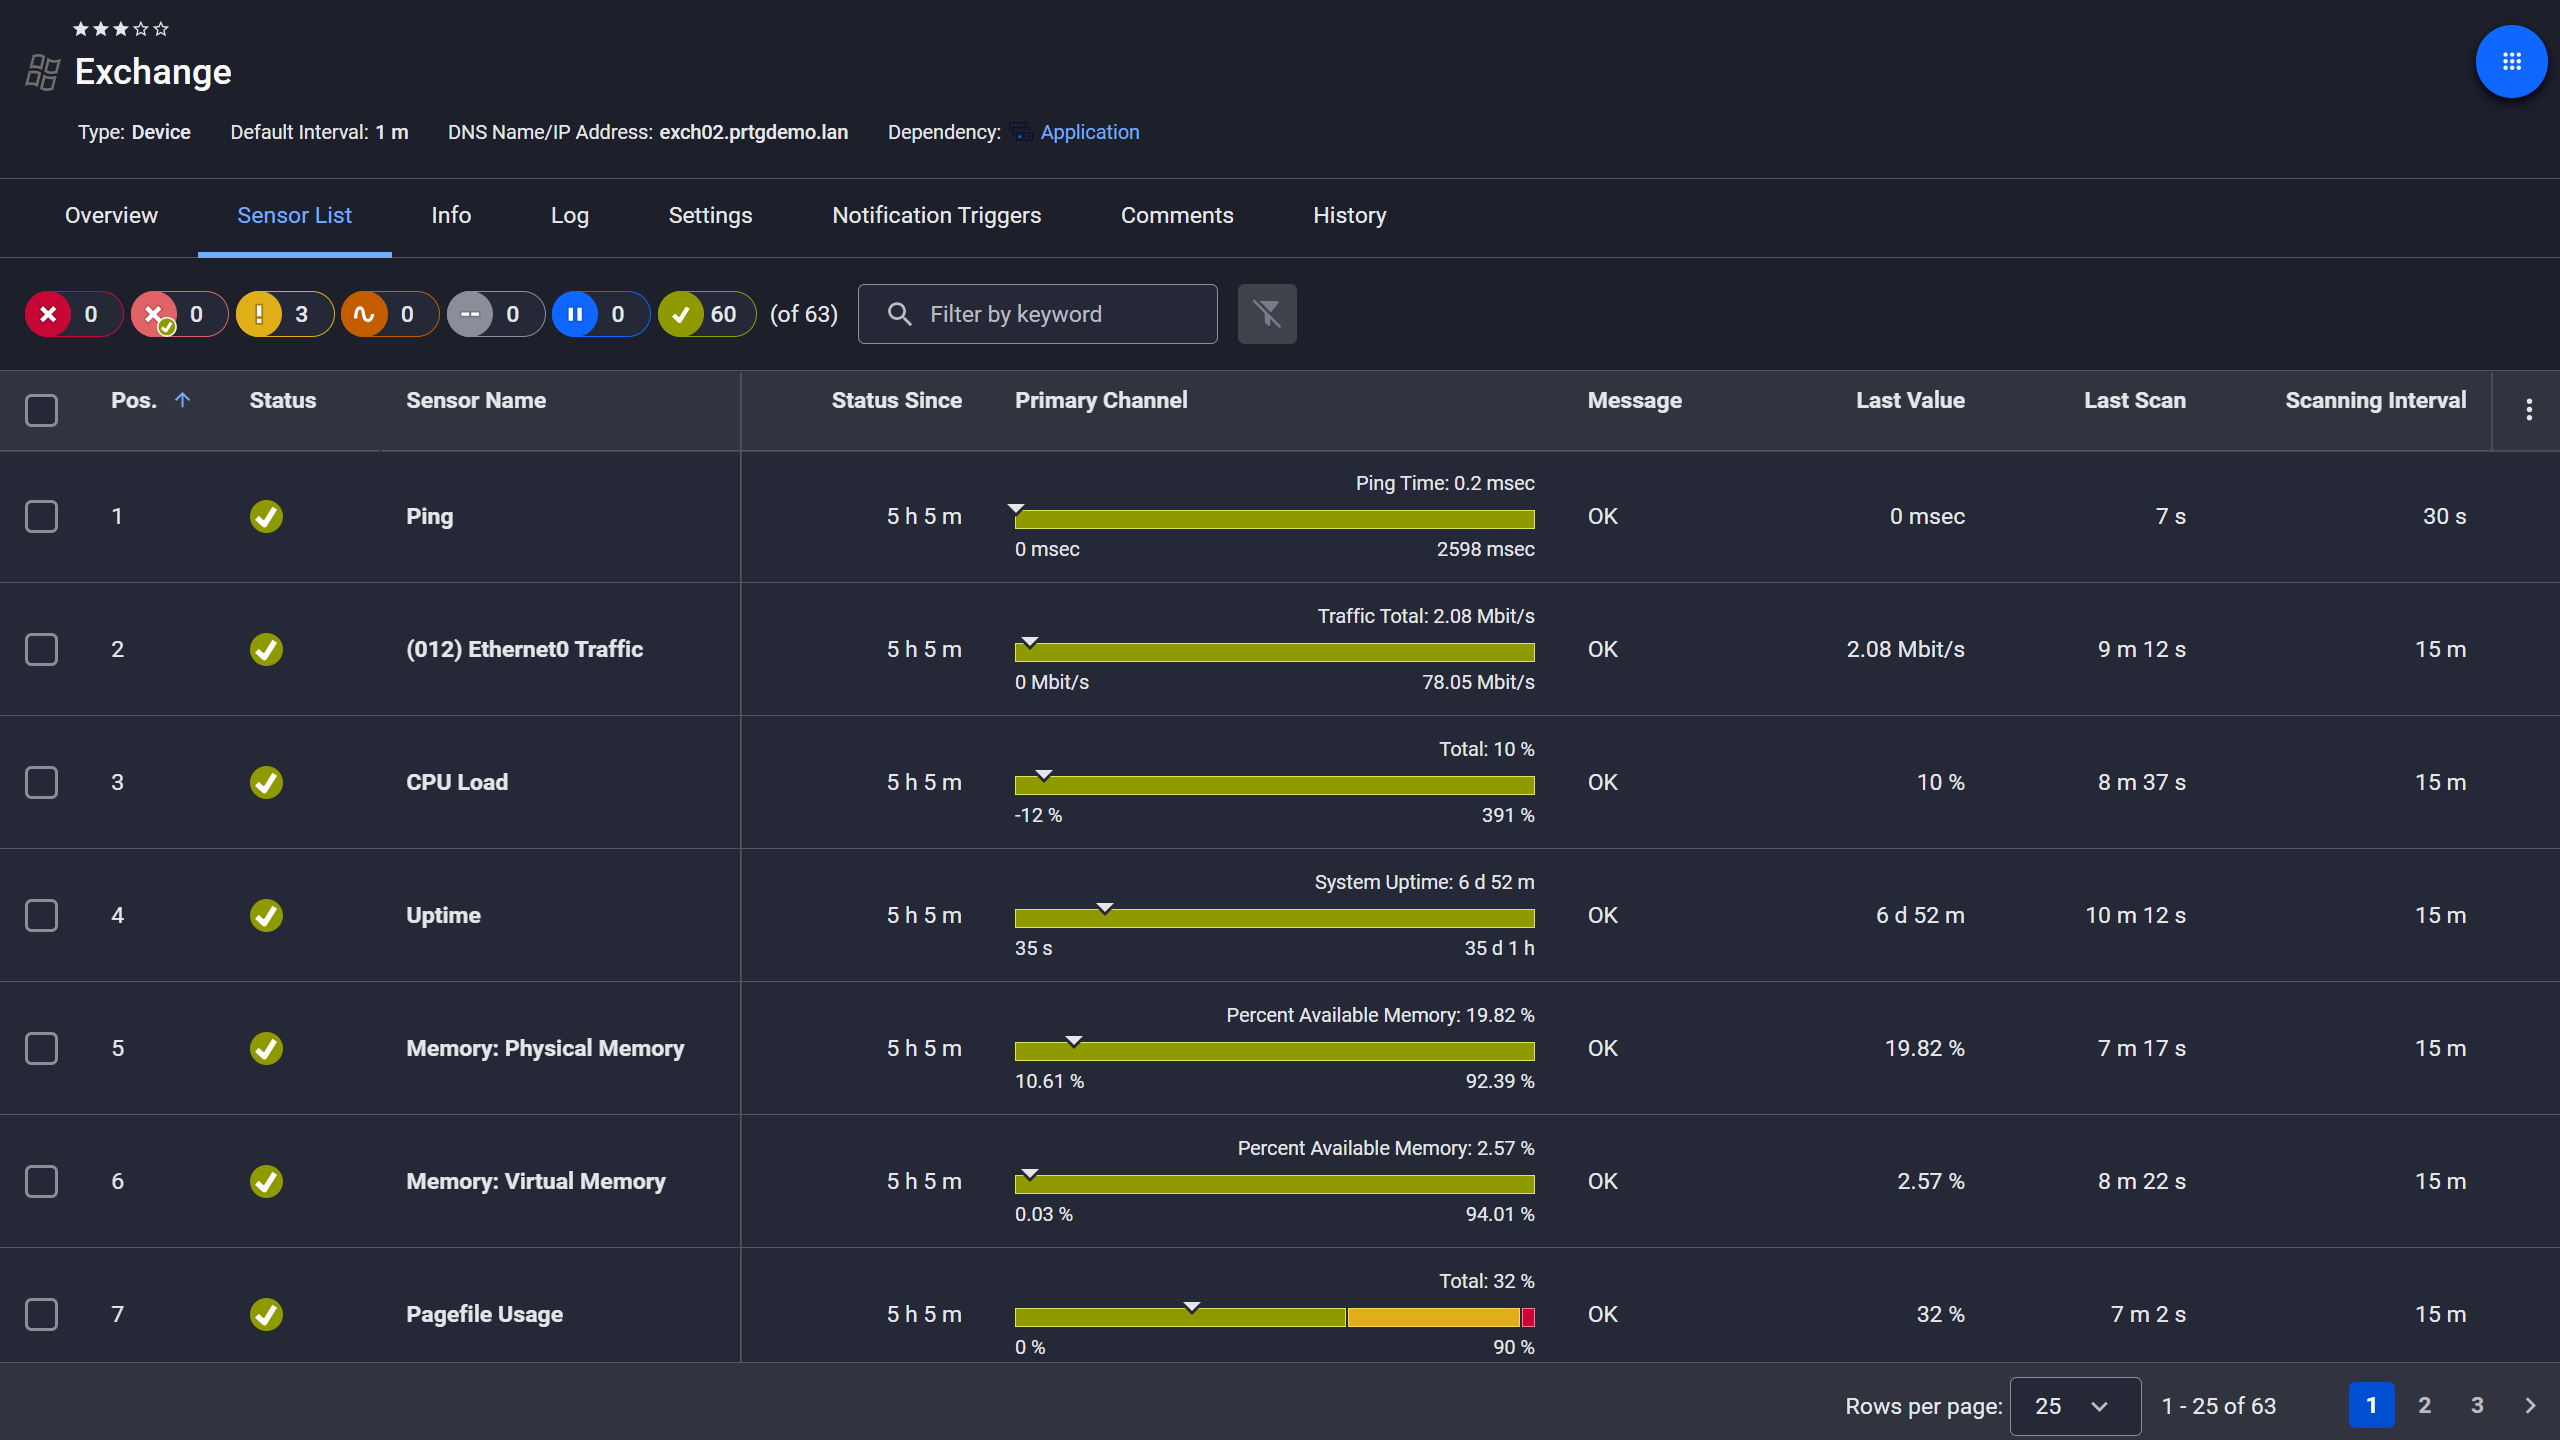
Exchange server, fully under control
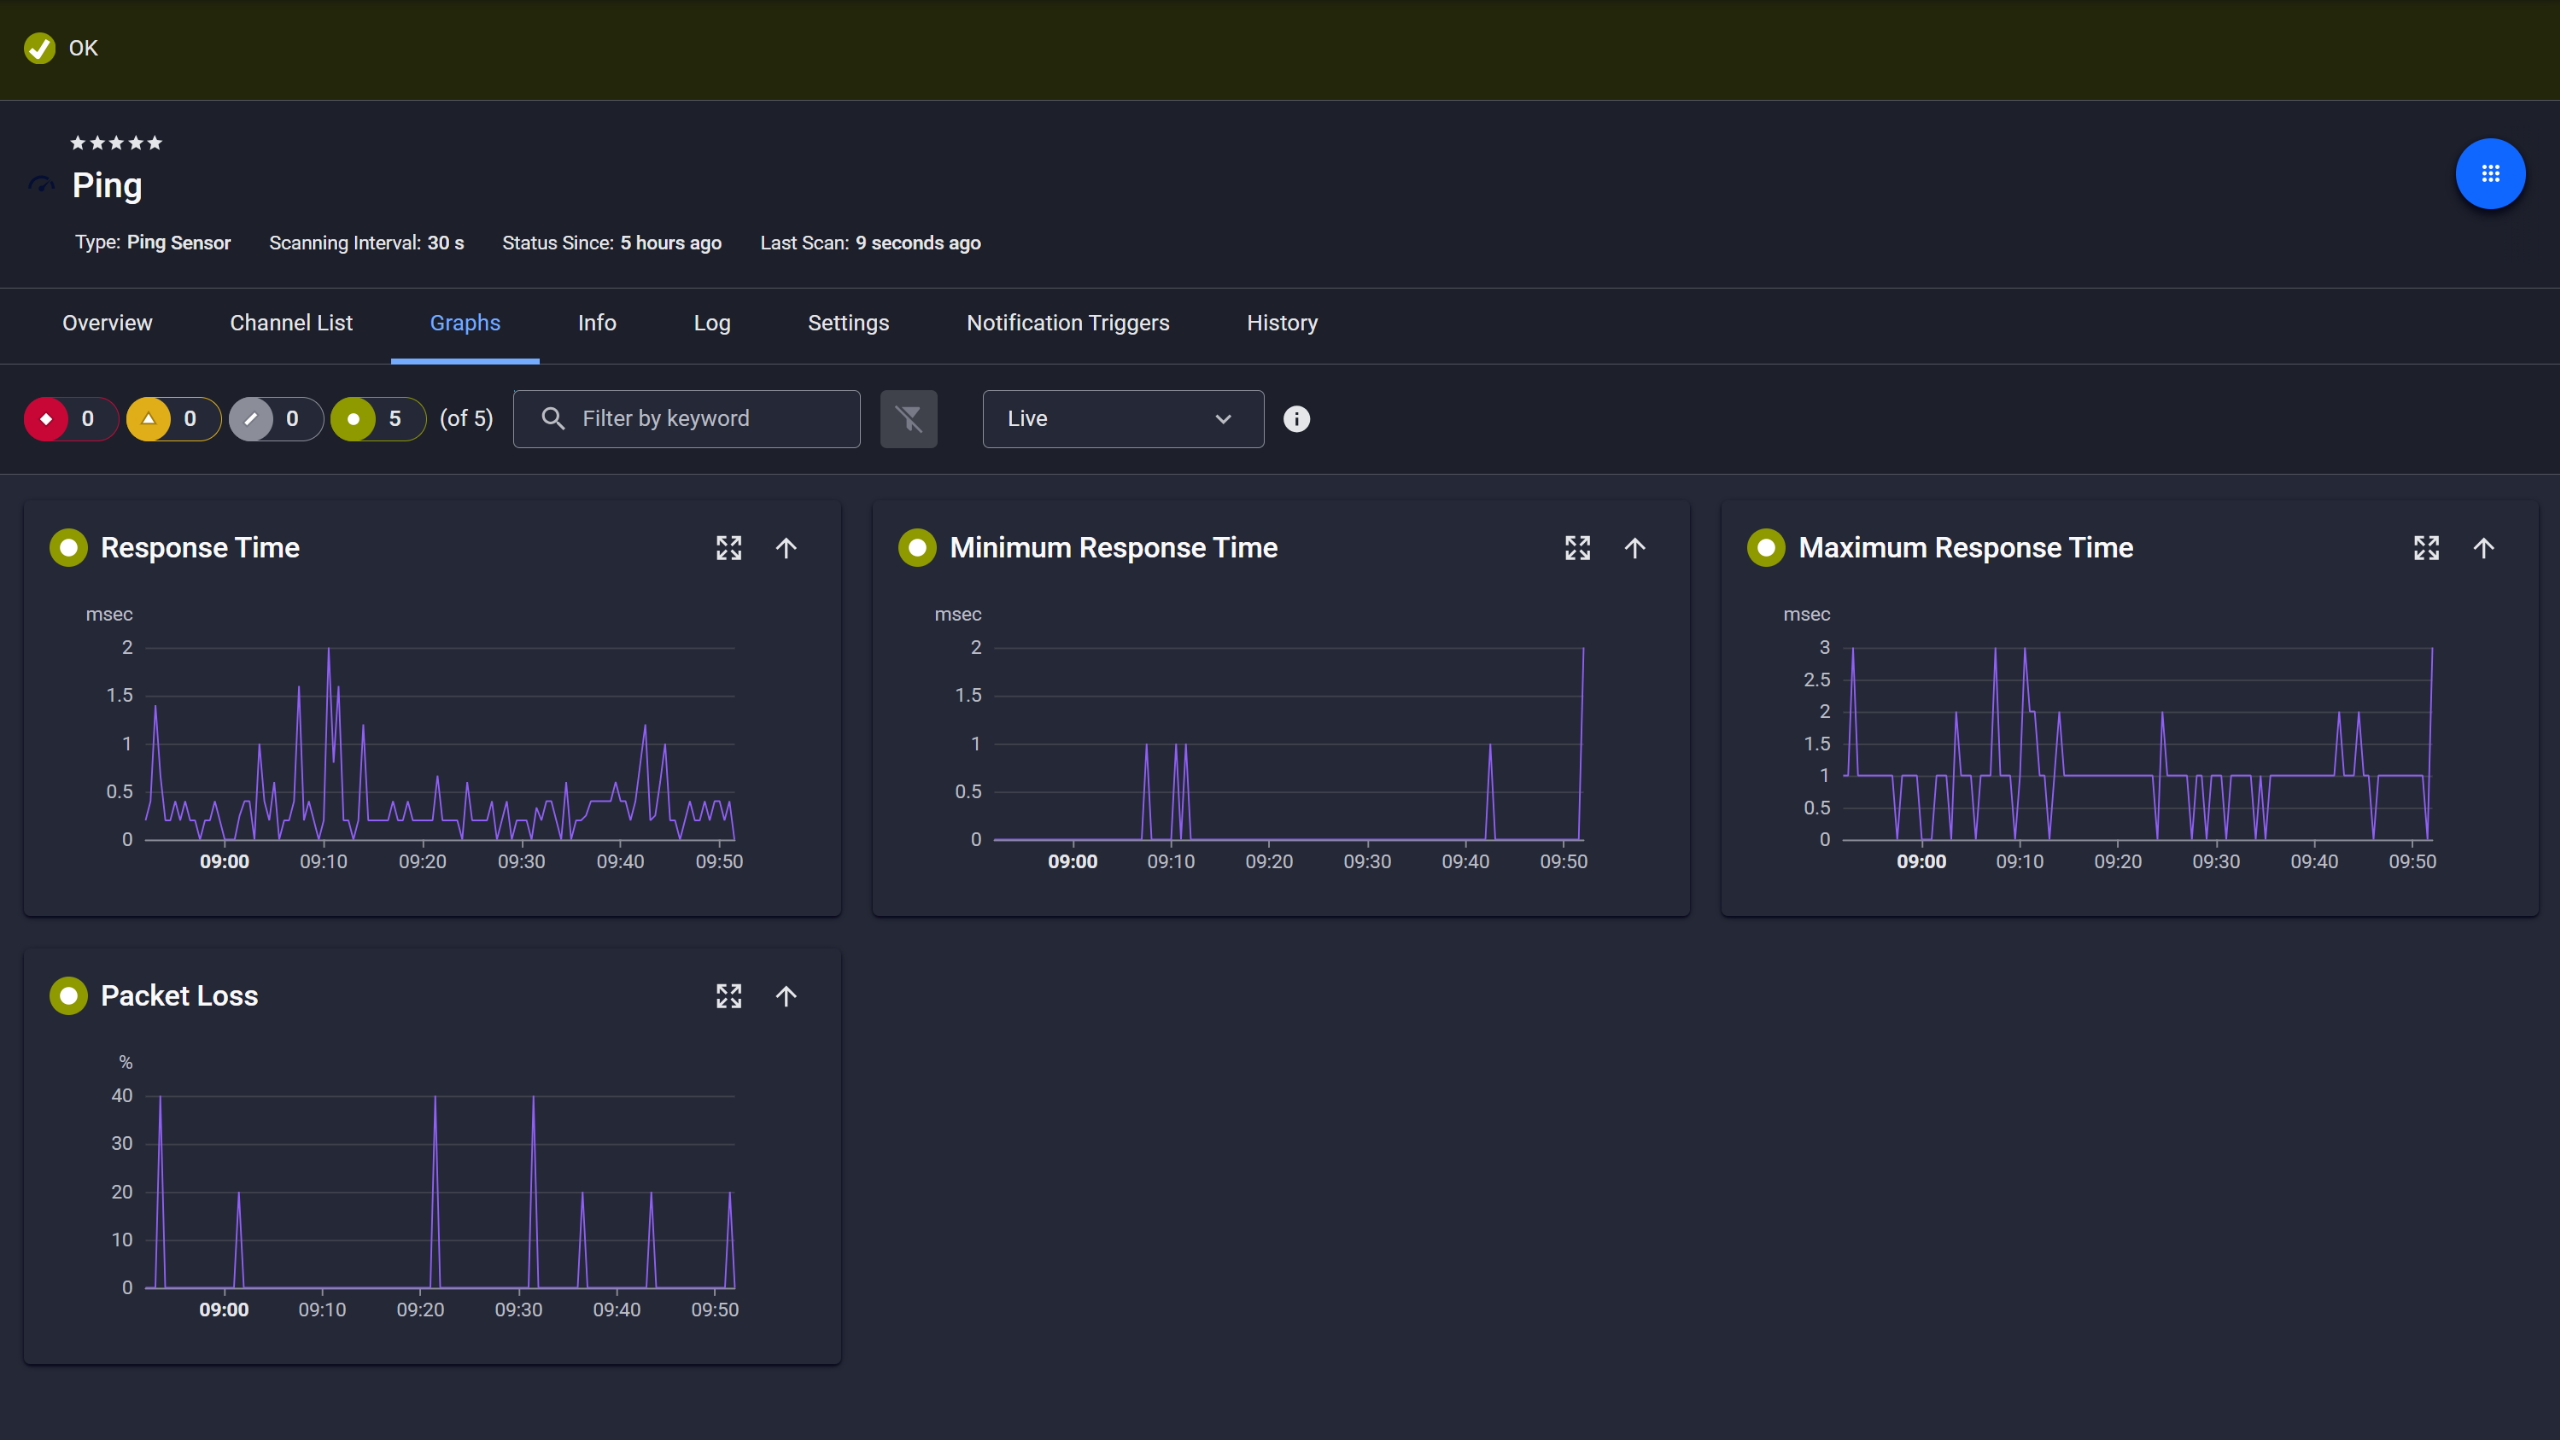
Ping response and packet loss

Live graphs, real-time performance data
Start monitoring your infrastructure in minutes. No professional services, no complex configuration, no risk.
Microsoft Office 365 depends on stable connectivity to dozens of SaaS endpoints. Bandwidth bottlenecks or network path problems hurt the user experience, but Microsoft's Service Health Dashboard won't tell you that.
Track connectivity, latency, and response times to critical Office 365 endpoints. Want to see bandwidth consumption? Monitor OneDrive sync, Teams calls, and Outlook traffic. You can combine cloud metrics with network-level data to get the full picture. Answer the "Is it Microsoft or is it us?" question with real metrics, not guesswork.

Scheduled reports, always on time
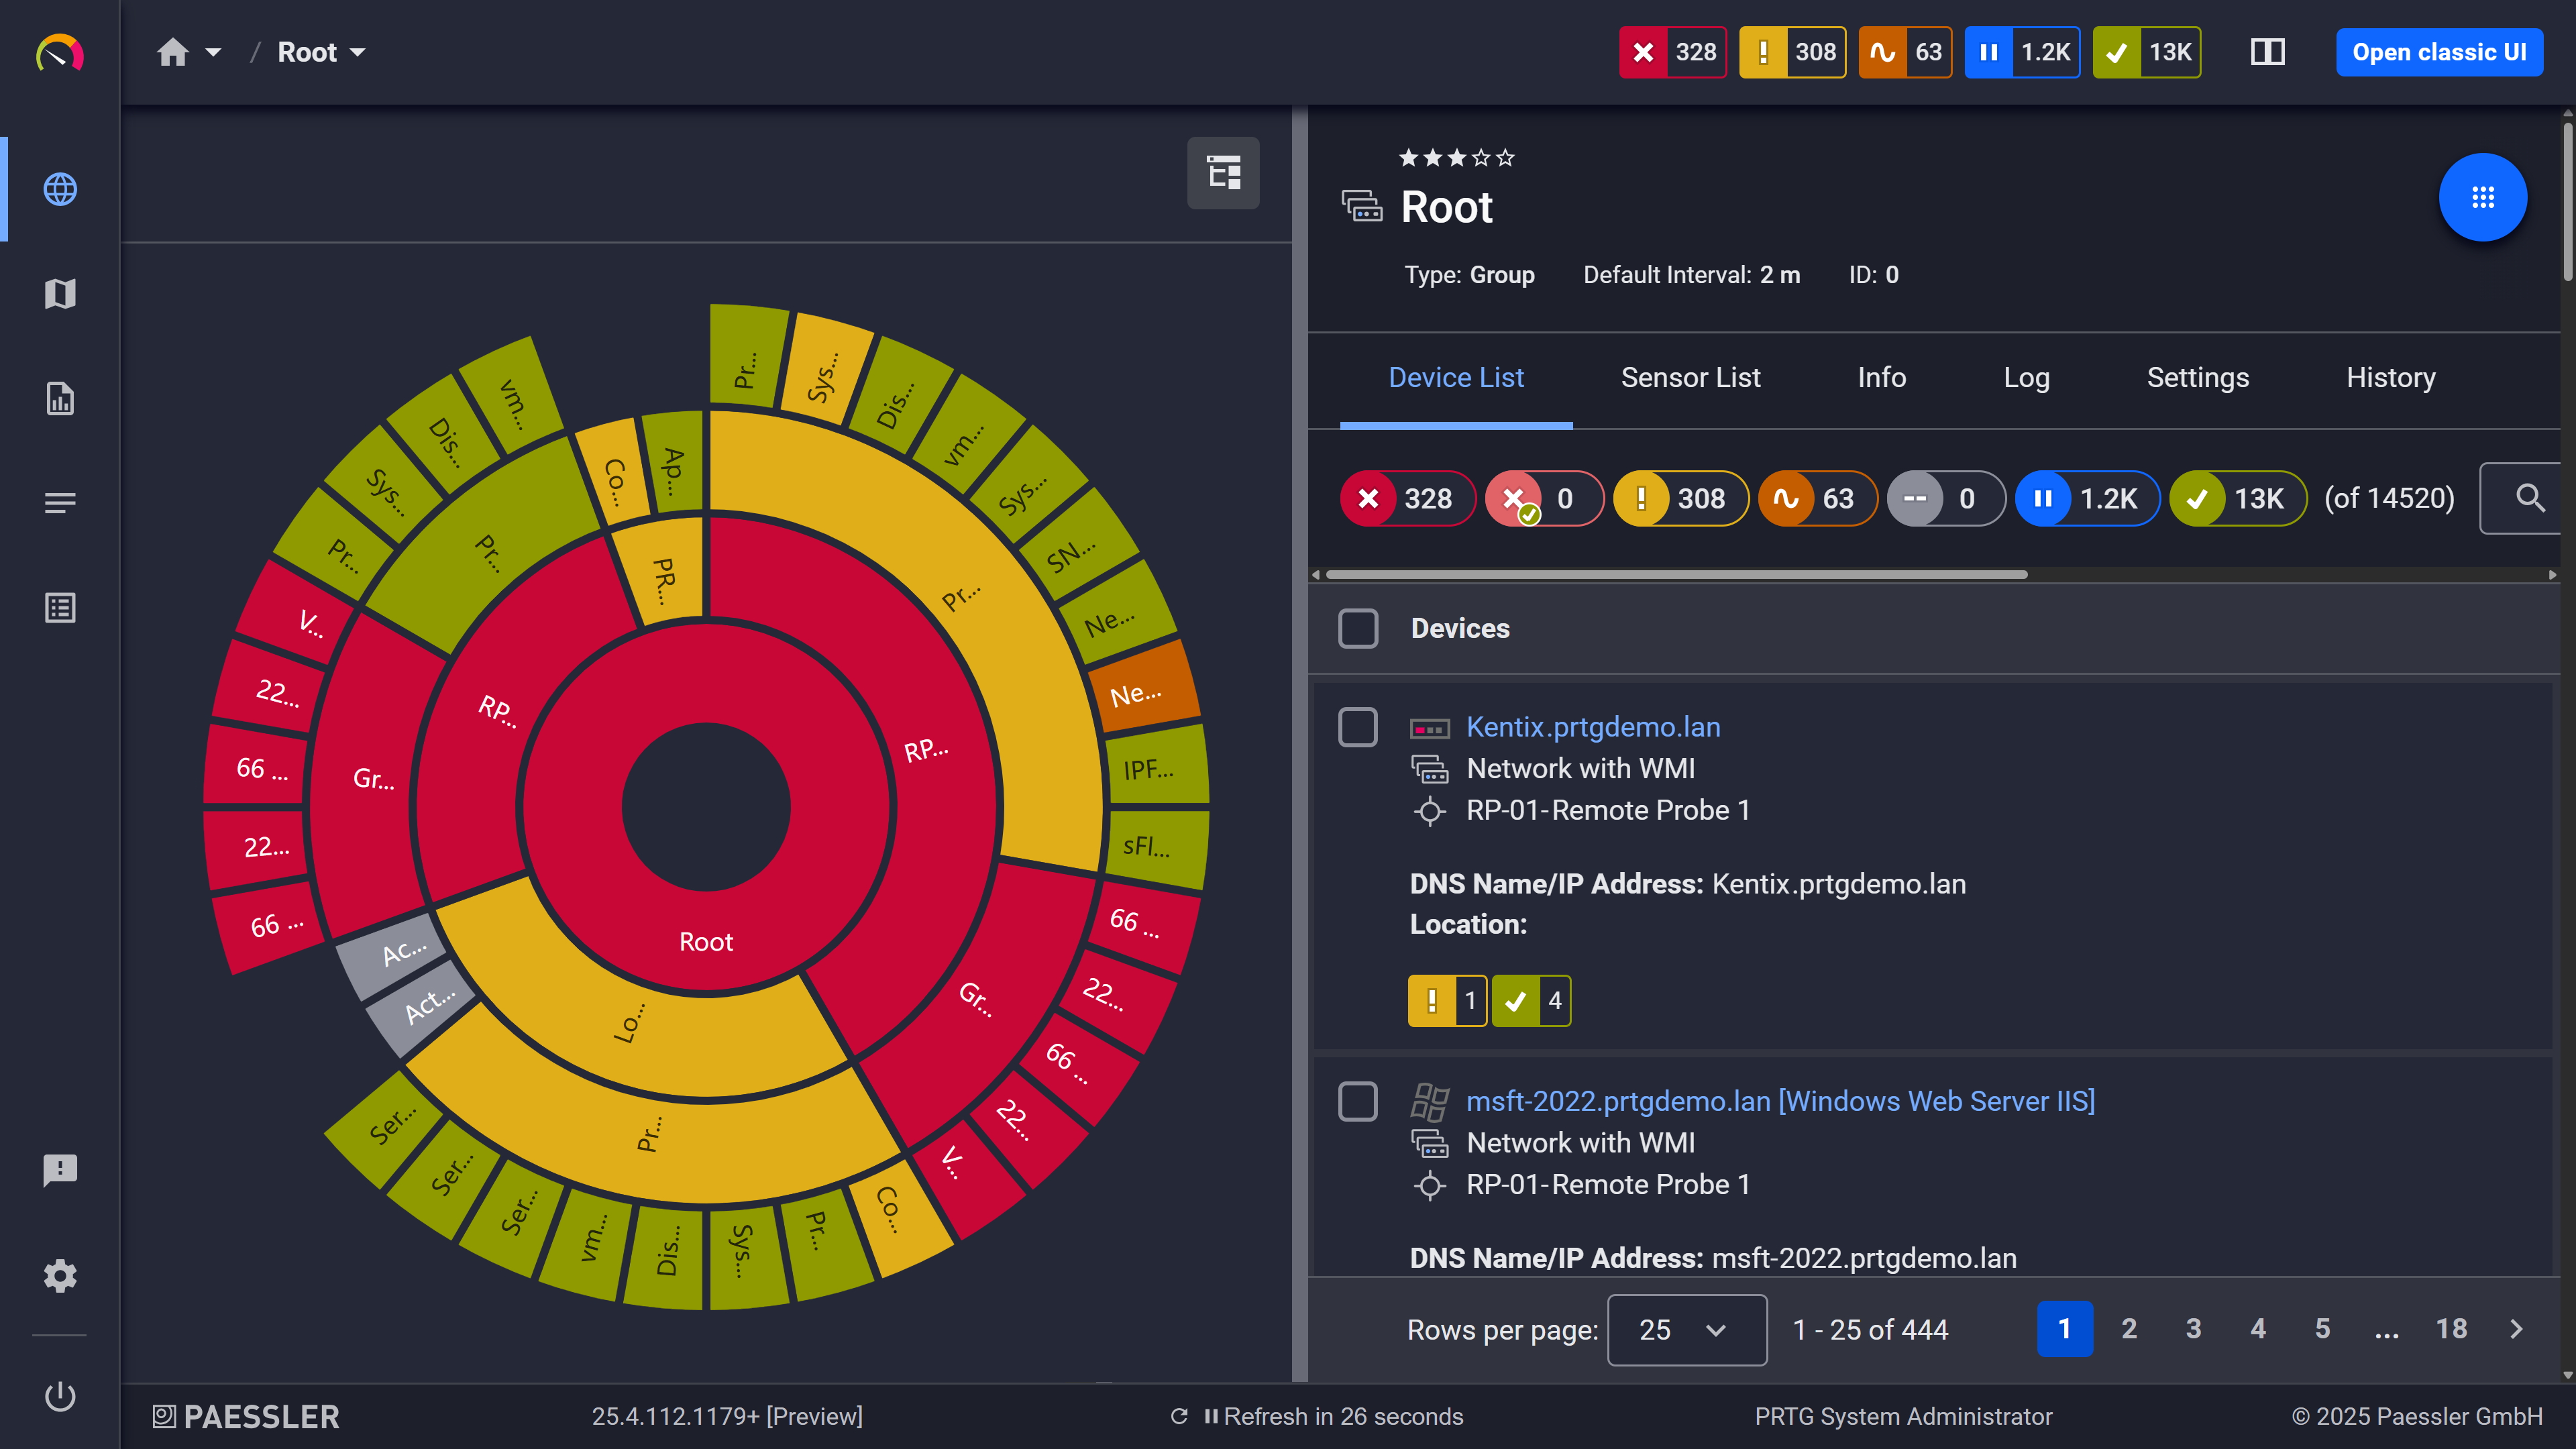
Your entire network, visualized instantly
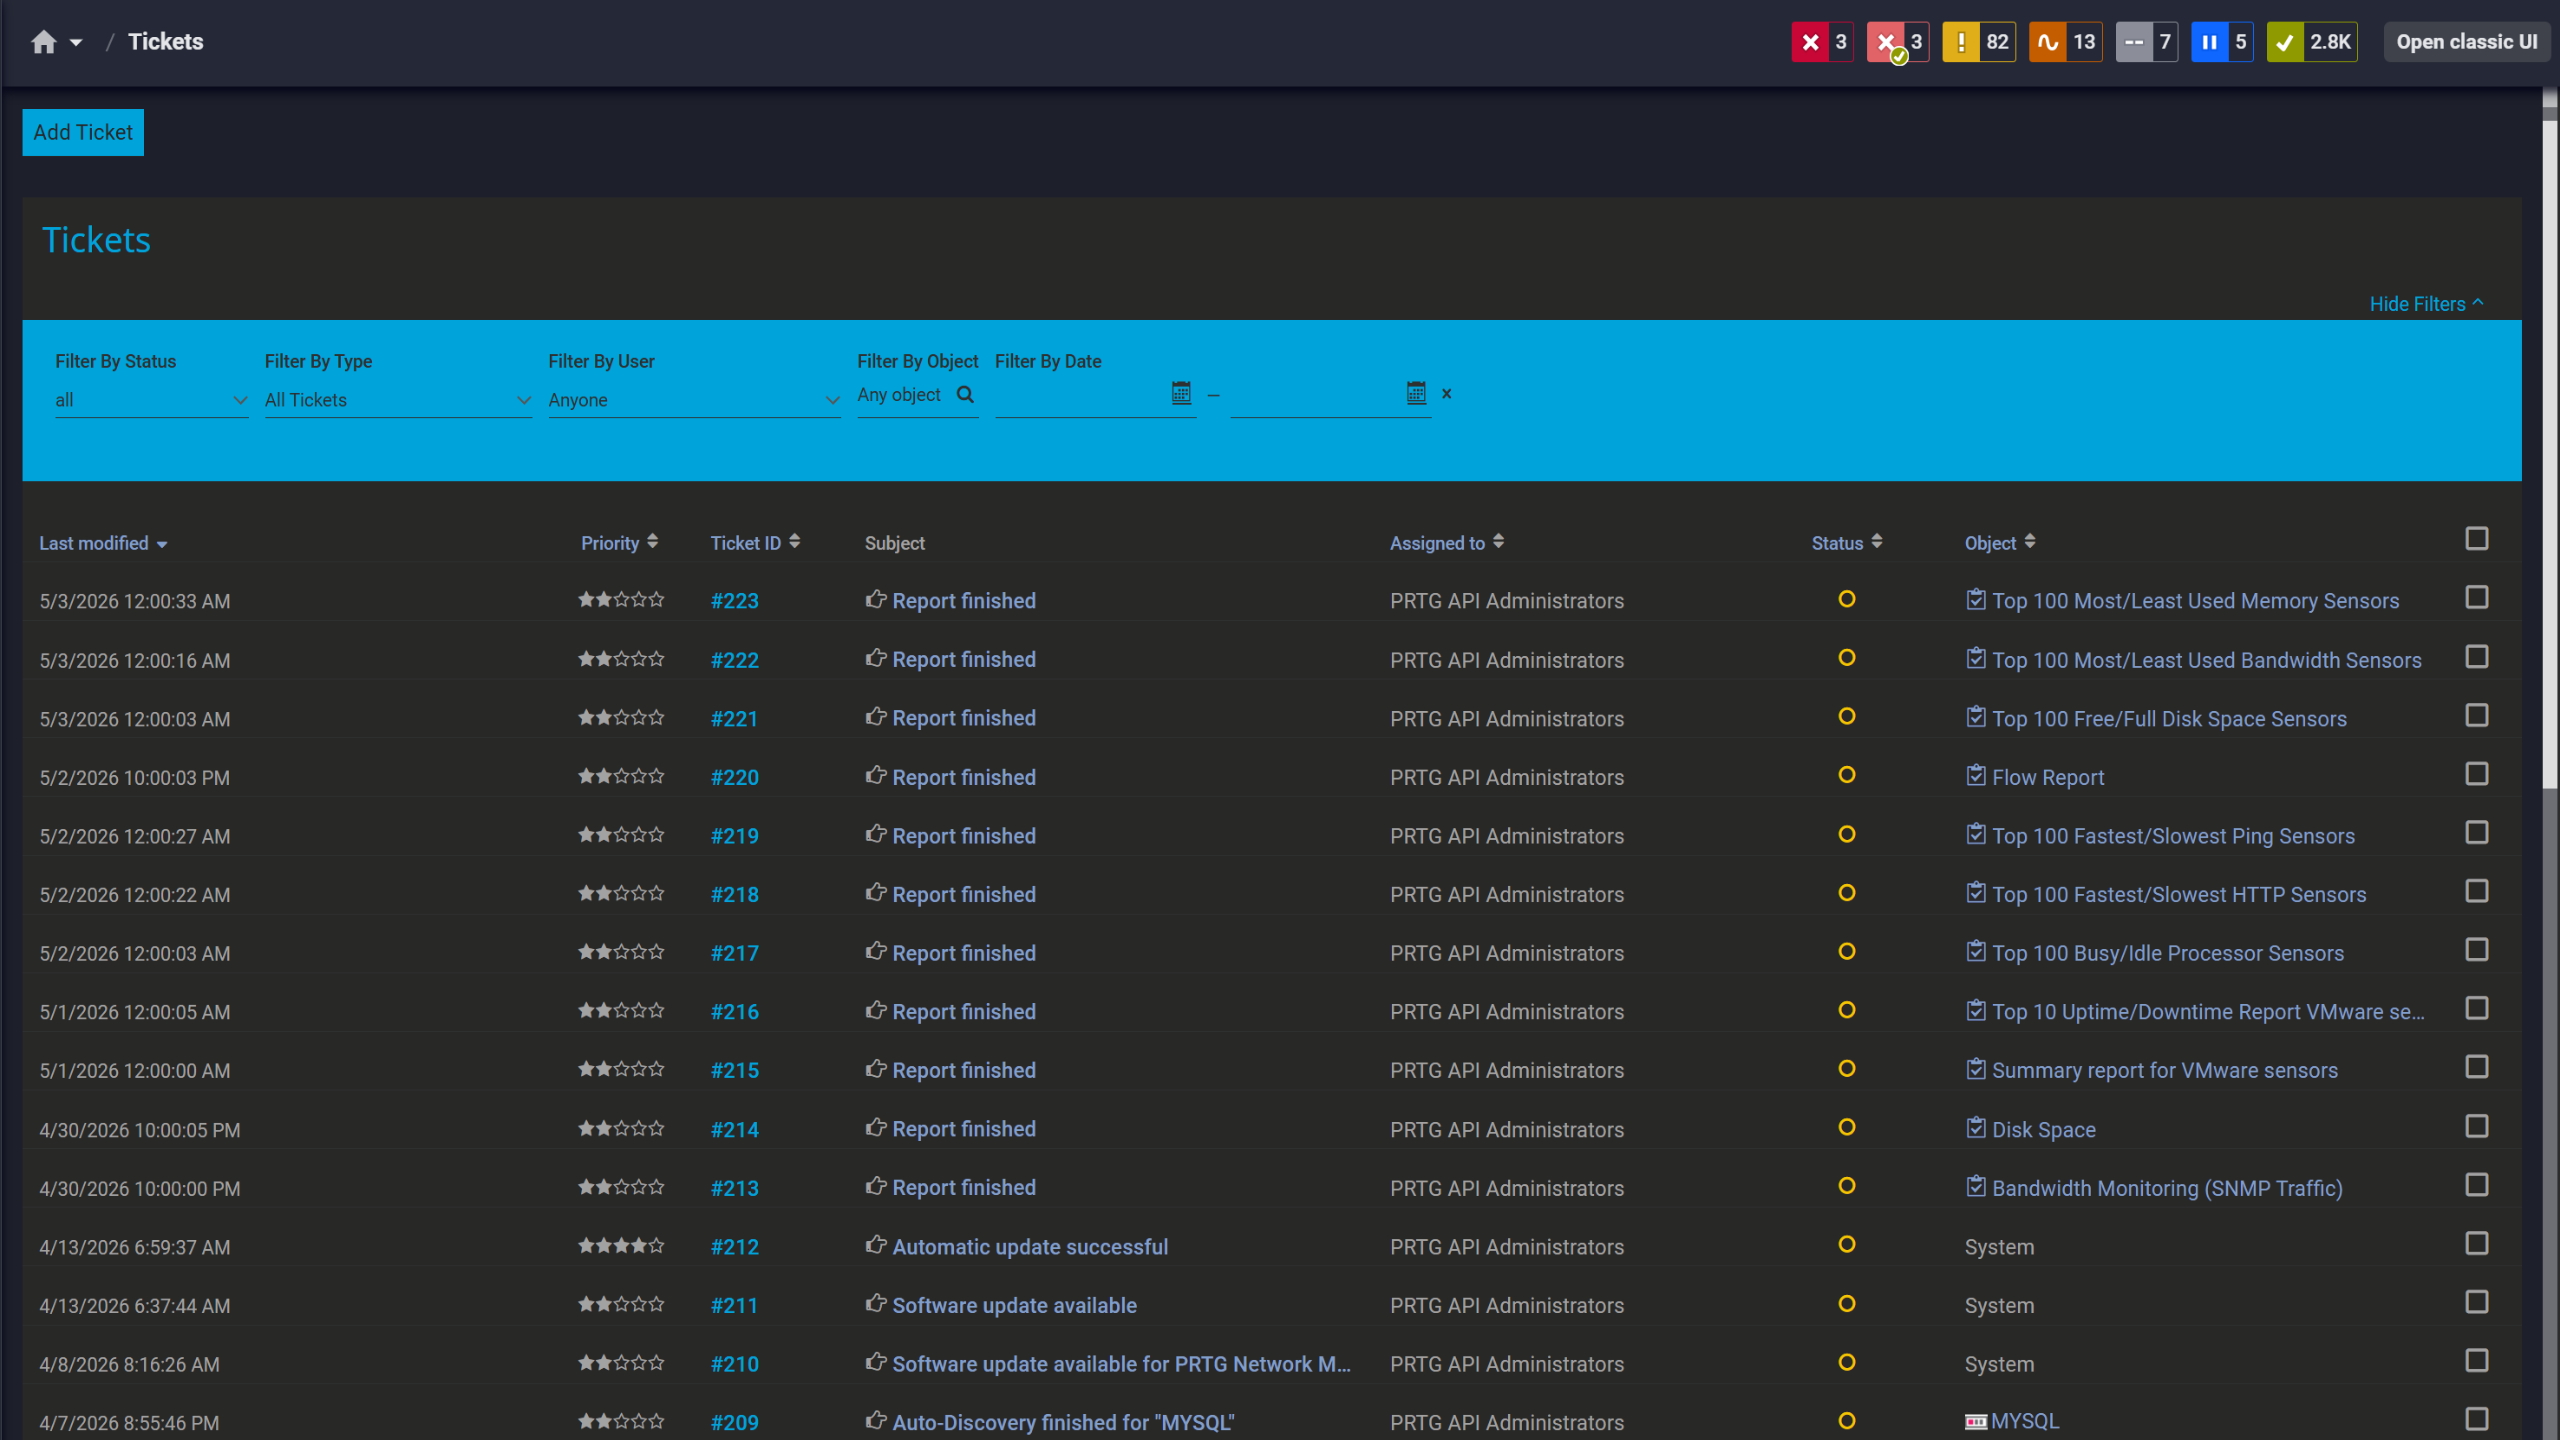
Tickets keep your team aligned
Your infrastructure doesn't stop at the firewall. Exchange Online runs alongside on-premises mailboxes. SharePoint splits between SaaS and local. User experience depends on both but troubleshooting means jumping between monitoring tools and manually piecing together what's broken.
See Office 365 Services alongside your on-premises infrastructure. Exchange Online health next to domain controller performance. Teams connectivity next to VPN metrics. Active Directory, DNS, and firewall data all in one view. No tool switching. No manual data reconciliation during incidents.
PRTG combines Microsoft API integration, REST queries, and network-level Performance Monitoring to give you visibility beyond what the Service Health Dashboard shows. Customize monitoring depth, combine cloud metrics with infrastructure data, and automate alerts for scenarios that matter in your environment. PRTG's Microsoft 365 sensors connect outbound over HTTPS (port 443). You do not need any inbound firewall rules.
FEATURE | Without PRTG Without PRTG | With PRTG With PRTG |
|---|---|---|
Monitor service status in near real-time | Without PRTG Refresh the Service Health Dashboard every hour (or more), hope Microsoft's email notifications arrive before users complain, keep your own spreadsheet for historical tracking | With PRTG Automated checks every minute, alerts fire instantly when Exchange or Teams show issues, historical graphs built-in |
Track individual mailbox and email flow | Without PRTG Log into each mailbox separately (security risk) or spend hours writing PowerShell scripts to query mailbox stats, build custom alerting logic, maintain scripts as your environment grows | With PRTG Configure mailbox, folder, and filter criteria in 5-10 minutes per mailbox, automatic alerts on stuck emails or unusual activity, no scripting |
Unify cloud and on-premises monitoring | Without PRTG Open Microsoft 365 Admin Center for cloud, separate tools for Exchange/AD on-prem, another console for network bandwidth, manually correlate data across systems when incidents hit | With PRTG Add Microsoft 365 sensors to the same device groups as domain controllers and network switches, see Exchange Online and AD performance side-by-side, troubleshoot in minutes instead of hours |
Monitor network connectivity and bandwidth to Office 365 endpoints | Without PRTG Deploy NetFlow analyzers, run packet captures, review firewall logs to identify Office 365 traffic patterns, manually cross-reference network performance with service status when users complain about slowness | With PRTG HTTP sensors track endpoint latency and response times, Flow/SNMP sensors measure OneDrive, Teams, and Outlook bandwidth, all metrics visible alongside service data in the same dashboard |
Customize alerting and integrate with ticketing systems | Without PRTG Wait for Microsoft's email notifications (no threshold control, email-only, can't filter by service), notifications often arrive after help desk already has tickets | With PRTG Define custom thresholds per sensor, route alerts via email, SMS, push, webhook, or integrate with ServiceNow/Jira, multi-level escalation, 10-15 minutes setup |
Choose the PRTG Network Monitor subscription that's best for you.
| License Name | License description | Price | License Details | Get started | Pricing Details | |
|---|---|---|---|---|---|---|
| PRTG 500 | $200 | per month paid annually | Buy nowBuy now | Enough to monitor multiple aspects of 50 devices | ||
| PRTG 1000 | $358 | per month paid annually | Buy nowBuy now | Enough to monitor multiple aspects of 100 devices | ||
| PRTG 2500 | $742 | per month paid annually | Buy nowBuy now | Enough to monitor multiple aspects of 250 devices | ||
| PRTG 5000 | $1,300 | per month paid annually | Buy nowBuy now | Enough to monitor multiple aspects of 500 devices | ||
| PRTG 10000 | $1,642 | per month paid annually | Buy nowBuy now | Enough to monitor multiple aspects of 1000 devices |

PRTG monitors service status for Exchange Online, SharePoint Online, Teams, OneDrive for Business, Intune, and other Microsoft 365 services. You can track your overall subscription status, individual workload status, mailbox folder metrics, and connectivity to Microsoft 365 endpoints. If you're running a hybrid setup, PRTG also monitors on-premises Exchange, Active Directory, DNS, and network infrastructure right alongside your cloud services.
It uses Microsoft Entra ID (Azure AD) app registrations with OAuth 2.0. You'll create an app registration in your Azure portal, grant delegated permissions (ServiceHealth.Read.All, User.Read, Mail.Read or Mail.Read.Shared), then configure the tenant ID, client ID, and client secret in PRTG. Token refresh happens automatically. No user passwords get stored anywhere. You control permissions through Azure AD role-based access.
Yes. The Mailbox sensor monitors specific folders, like inbox, sent items, custom folders, for email count, message age, and filter-matched emails. It's especially useful for shared mailboxes, service accounts, or executive inboxes. You decide which mailboxes to monitor and set your own thresholds for volume, message age, or sender/subject patterns.
Absolutely. Add Microsoft 365 Monitoring sensors to the same device groups and maps where you're already monitoring on-premises servers and network devices. You'll see Exchange Online health status next to domain controller performance, or track Microsoft 365 metrics alongside your internet bandwidth usage. Everything feeds into the same alerting, reporting, and notification system.
You configure scanning intervals per sensor. The default for Service Status sensors is usually 60 seconds, but you can adjust it based on how quickly you need to detect issues. For mailbox monitoring, longer intervals (5 to 15 minutes) reduce API call volume. PRTG respects API rate limits and throttles automatically if it needs to.
If the Service Health API goes down (rare, even during major outages), PRTG sensors will show a connection error or timeout. But PRTG keeps monitoring network-level connectivity to Microsoft 365 endpoints through HTTP or ping sensors, so you can still tell whether the problem is on Microsoft's side or your local network. During most Microsoft 365 disruptions, the Service Health API stays operational and PRTG reports the degraded state normally.
Network Monitoring Software – Version 26.3.124.1727 (September 16, 2026)
Download for Windows and cloud-based version PRTG Hosted Monitor available
English, German, Spanish, French, Portuguese, Dutch, Russian, Japanese, and Simplified Chinese
Network devices, bandwidth, servers, applications, virtual environments, remote systems, IoT, and more
Choose the PRTG Network Monitor subscription that's best for you



