• Company
    • About Us
    • Case Studies
    • Press Center
    • Careers
    • Blog
    • Contact us
  • Contact us
  • Login
 
  • English
    • Deutsch
    • Español
    • Français
    • Italiano
    • Português
Paessler
                    - The Monitoring Experts
  • Products
    • Paessler PRTG
      Paessler PRTGMonitor your whole IT infrastructure
      • PRTG Network Monitor
      • PRTG Enterprise Monitor
      • PRTG Hosted Monitor
      • PRTG UVexplorer
      • PRTG extensionsExtensions for Paessler PRTGExtend your monitoring to a new level
    • Icon Features
      FeaturesExplore all monitoring features
      • Maps & dashboards
      • Alerts & notifications
      • Multiple user interfaces
      • Distributed monitoring
      • Customizable reporting
  • Solutions
    • By TeamFor your organization size
      • Small Business IT
      • Mid-Market IT
      • Enterprise IT
      • MSP Network Monitoring
    • Industries
      By IndustryFor your business sector
      • Industrial
      • Healthcare
      • Government
      • Education
      • Data Center
      • Finance
    • IT Topics
      By Use CaseFor every technical scenario
      • Network Monitoring
      • Server Monitoring
      • OT Monitoring
      • Distributed Monitoring
      • Network Topology Mapping
      • SNMP Monitoring
      • Bandwidth Monitoring
  • Pricing
  • Resources
    • Getting Started
      Getting StartedModules for self-paced learning
    • How-to Guides
      How-to GuidesGet the most out of PRTG
    • Videos & Webinars
      Videos & WebinarsLearn from Paessler experts
    • IT  Knowledge
      IT KnowledgeExpand your IT knowledge
    • PRTG Manual
      PRTG ManualFull documentation
    • Knowledge Base
      Knowledge BaseShare community knowledge
    • PRTG Sensor Hub
      PRTG Sensor HubGet sensors, scripts & templates
    • Trainings
      PRTG TrainingLearn how to work with PRTG
  • Partners
    • Icon Handshake
      Become a PartnerFor resellers and channel partners
    • Icon MSP
      Become an MSPDeliver monitoring as a managed service
    • icon partner
      Partner PortalLog in to your partner account
    • Deal Registration
      Deal RegistrationRegister your sales opportunities
    • icon search
      Find a PartnerFind partners selling Paessler products
    • icon technology
      Technology AlliancesSee Paessler technology partnerships
    • Partner HubTools for Your Success
  • Company
    • About Us
    • Case Studies
    • Press Center
    • Careers
    • Blog
    • Contact us
  • Contact us
  • Login
  • English
    • Deutsch
    • Español
    • Français
    • Italiano
    • Português
  • Get a quote
  • Free trial
  1. Home>
  2. Company>
  3. Case Studies>
  4. Centroflora Group

From 7 hours to minutes: how Centroflora Group monitors its pharmaceutical factory floor with PRTG

Challenge: No unified OT visibility across factory floor; fault diagnosis took 6-7 hours per incident

download PDF
Logo Centroflora Group

COMPANY
Centroflora Group

INDUSTRY
Healthcare and Manufacturing

COMPANY SIZE
Midsized Company

COUNTRY
Brazil

SCALE
Siemens PLC network, 3 production segments, OT and IT

Icon Boost

Fault diagnosis time reduced from 6-7 hours to just minutes

Icon Plug

Power costs reduced by 3% to 4% through consumption monitoring and anomaly detection

Icon Dashboard

All three factory segments integrated into a single PRTG dashboard

The problem

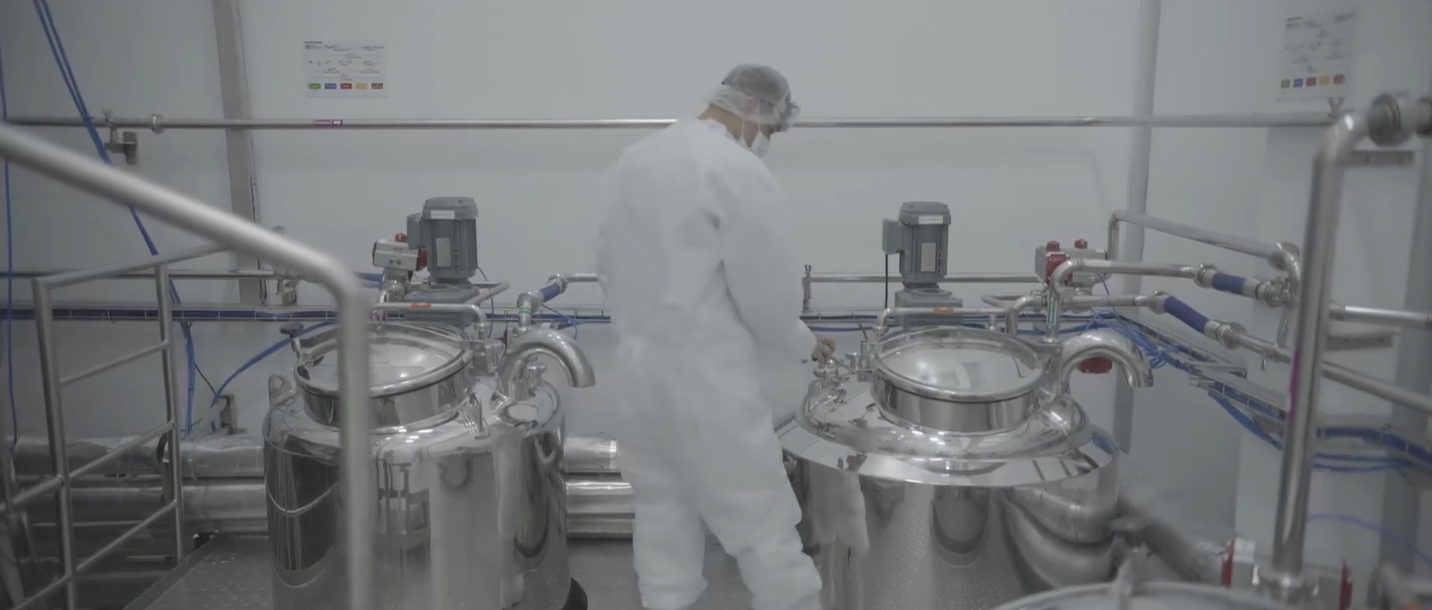
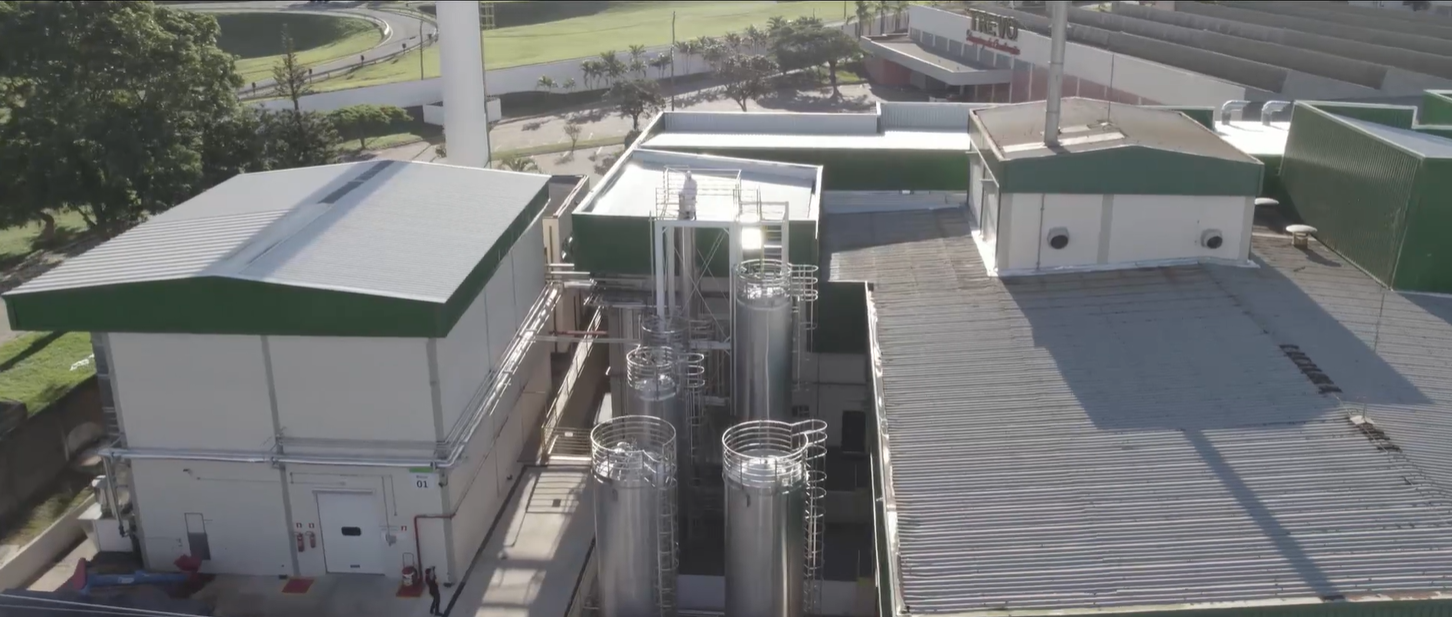
Centroflora Group is a Brazilian manufacturer of botanical extracts, essential oils, and active pharmaceutical ingredients, with over 65 years of operation. Its production runs across three distinct factory segments: evaporation, drying, and supply extraction, each controlled by Siemens PLCs.

With no unified monitoring platform, the only way to analyze PLC data was for maintenance staff to physically visit each segment. Faults could take six to seven hours to diagnose. Equipment that should have been offline was sometimes still running and drawing power undetected.

The team needed a platform that could provide a predictive view of the entire OT environment and integrate with Siemens TIA Portal, the operating system running their PLCs.

What changed with PRTG

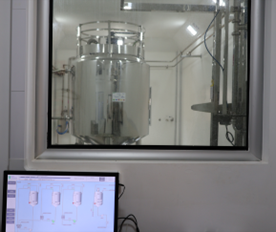
PRTG runs on a dedicated virtual server at Centroflora's CentroINOVA data center. It connects PLCs across all three factory segments through supervisor microcomputers that consolidate PLC data, then feeds everything into a single centralized dashboard.

PRTG's native OPC UA support and TIA Portal integration streamlined deployment. The facilities and maintenance team now receives alerts when industrial equipment behaves abnormally, triggering immediate checks on the factory floor without waiting for a physical walkthrough.

For power management, Paessler partner RBS Service developed a converter appliance that transforms electrical current into a digital signal, feeding power consumption data directly into PRTG. The team can now see which equipment depends on the external grid and which has switched to generator, acting quickly when anomalies appear.

The PRTG sensors help us anticipate failures – an alert triggers actions such as checking what is happening on the factory floor and restarting equipment.

Julio Moura, Maintenance and Facilities Supervisor
Centroflora Group
PRTG Logo

PRTG gives pharmaceutical manufacturers the OT and IT visibility they need to protect production, cut downtime, and reduce energy waste.

CONTACT SALES
case study centroflora hq view botucatu sao paulo
case study centroflora screenshot natural asset drying boiler
case study centroflora screenshot drying boilers

Discover more monitoring insights and stories

Solution illustration

Solutions for all your monitoring needs

  • Network Monitoring Tool
  • LAN Monitoring
  • SNMP Monitoring
Content illustration

Powerful stories from the monitoring world

  • Customer success story Centroflora Group
  • Customer success stories - Paessler
  • Customer success story SMS group
Support illustration

Resources to master your monitoring challenges

  • Quick Start Guide
  • PRTG Apps for Mobile Network Monitoring
  • How can I move or migrate a PRTG installation to a different system or server?
Explore All Case Studies

Products

  • Paessler PRTG
    Paessler PRTGMonitor your whole IT infrastructure
    • PRTG Network Monitor
    • PRTG Enterprise Monitor
    • PRTG Hosted Monitor
    • PRTG UVexplorer
    • PRTG extensions
      Extensions for Paessler PRTGExtend your monitoring to a new level
  • Icon Features
    FeaturesExplore all monitoring features

Monitoring with PRTG

  • Network monitoring
  • Bandwidth monitoring
  • SNMP monitoring
  • Network mapping
  • Wi-Fi monitoring
  • Server monitoring
  • Network traffic analyzer
  • NetFlow monitoring
  • Syslog server

Useful Links

  • PRTG Manual
  • Knowledge Base
  • Customer Success Stories
  • About Paessler
  • Subscribe to newsletter
  • PRTG Support
  • PRTG Consulting
  • PRTG Feedback & Roadmap

Contact

Paessler GmbH
Thurn-und-Taxis-Str. 14, 
90411 Nuremberg 
Germany

[email protected]

+49 911 93775-0

  • Contact us
©2026 Paessler GmbHTerms & ConditionsPrivacy PolicyImprintReport VulnerabilityDownload & InstallSitemap
Cisco Router Monitoring Cisco Router Monitoring Cisco Router Monitoring