Custom alerts and data visualization let you quickly identify and prevent email sending and retrieval issues.
Few companies can afford a disruption in email. Paessler PRTG functions as an early warning system for incoming challenges. Our POP3 monitoring software offers the complete package for overseeing the performance and security of your POP3 servers and other infrastructure. It tracks response times, monitors authentication processes, and provides a 360-degree view of your email system.
Transform complex metrics like email authentication success rates into easily digestible visual data. PRTG is an expert digital analyst, reading vital server metrics in its native language.
Measure response time, tracking how quickly your POP3 server responds to client requests. Gauge server health at a glance with CPU and memory usage monitoring.
The privacy of email messages is compliance critical. Your mail server couldn’t be in better hands with PRTG. Continuously monitor SSL/TLS encryption to keep all POP3 connections securely encrypted. Track authentication attempts and flagged suspicious activities for review.
PRTG also keeps a close eye on SSL certificate validity, alerting administrators to expiring or invalid certificates well in advance.
When you have multiple email server environments, compatibility and protocol support are crucial. PRGT’S cross-platform compatibility ensures smooth operation across Windows, Linux, and virtual systems.
Whether you’re using multiple protocols like SNMP, WMI, SSH, POP3, IMAP, or SMTP, or overseeing a complex network of SMPT servers and Exchange servers, PRTG adapts to your specific needs.
Being able to understand the data you’re seeing is as important as seeing the data. PRTG's intuitive dashboards serve as a clear window into your server for better management of your POP3 service.
Transform raw data into actionable insights, converting response times, authentication rates, and encryption statuses into easily understandable visual representations.
Diagnose network issues by continuously tracking the health and performance of POP3 servers and processes. Monitor configurations, and show response time, bandwidth usage per IP address, the number of emails, and other key metrics in real time. Visualize monitoring data in clear graphs and dashboards to identify problems more easily. Gain the overview you need to troubleshoot timeouts.

Device tree view of the complete monitoring setup

Custom PRTG dashboard for keeping an eye on the entire IT infrastructure

Live traffic data graph in PRTG
“All-around winning
network monitor”
“The real beauty of PRTG is the endless possibilities it offers”
“PRTG Network Monitor
is very hard to beat”
PRTG delivers real-time insights and alerts in multiple ways, including push notifications and SMS. In the fast-paced world of email communication, this timely information is crucial.
The system provides up-to-the-minute statistics on your POP3 server's performance, with instant alerts for any irregularities.
Another advantage is PRTG's predictive analysis capabilities. By setting custom thresholds for key metrics, administrators receive alerts before minor issues escalate into significant problems.
This proactive approach helps maintain optimal server performance, reducing downtime and ensuring consistent email retrieval for end-users and solid uptime statistics.
PRTG offers adaptive monitoring for environments at scale. Its flexibility allows it to adapt to various email server configurations, supporting different setups, and integrating seamlessly with other email protocols.
This adaptability makes PRTG suitable for a wide range of use cases, from small business email management to enterprise-scale email infrastructures and managed service providers.
PRTG combines a user-friendly user interface with advanced capabilities. Despite its sophisticated features, it's designed with ease of use in mind.
The intuitive interface and preconfigured sensors facilitate quick setup, while comprehensive visualization tools make interpreting email system performance straightforward, even for those new to mail server monitoring.
PRTG comes with more than 250 native sensor types for monitoring your entire on-premises, cloud, and hybrid cloud environment out of the box. Check out some examples below!
The POP3 sensor monitors an email server via the Post Office Protocol version 3 (POP3). It can show the following:
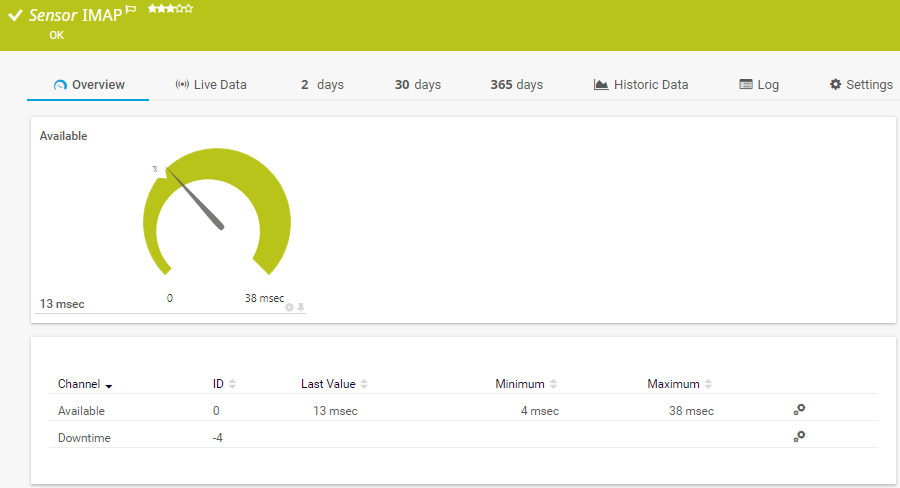
The IMAP sensor monitors an email server via the Internet Message Access Protocol (IMAP). It checks the content of emails for certain keywords. It can show the following:
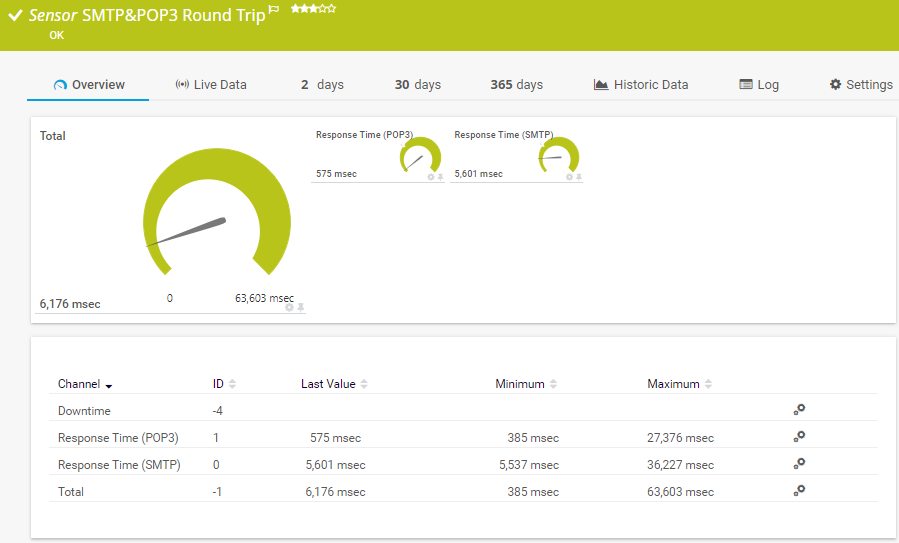
The SMTP&POP3 Round Trip sensor monitors the time it takes for an email to reach a Post Office Protocol version 3 (POP3) mailbox using the Simple Mail Transfer Protocol (SMTP). It sends an email using the parent device (an SMTP server) and then scans a dedicated POP3 mailbox until the email comes in. It can show the following:
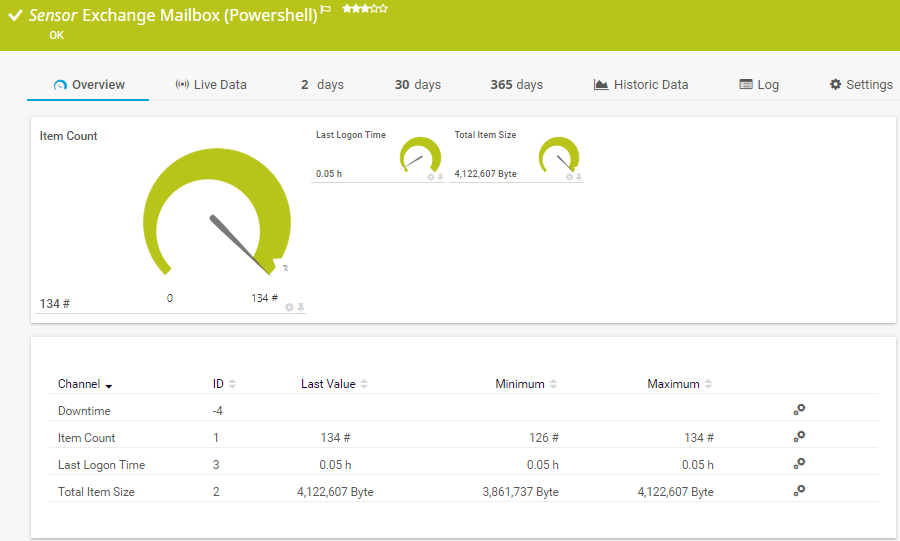
The Exchange Mailbox (PowerShell) sensor monitors mailboxes of an Exchange server. It can show the following:
See the PRTG Manual for a list of all available sensor types.

Custom alerts and data visualization let you quickly identify and prevent email sending and retrieval issues.
PRTG is set up in a matter of minutes and can be used on a wide variety of mobile devices.


“Great interface, intuitive, full REST support. custom scripts, rest sensors add extra value. We have been using PRTG for 10 years now in multiple environments and use cases. it has by far the best interface and very easy to setup without prior experience.”
Partnering with innovative IT vendors, Paessler unleashes synergies to create
new and additional benefits for joined customers.
baramundi and PRTG create a secure, reliable and powerful IT infrastructure where you have everything under control - from the traffic in your firewall to the configuration of your clients.
With the combination of PRTG and Insys, the monitoring specialist Paessler and the industrial gateway manufacturer INSYS icom offer a practical possibility to merge IT and OT.
Siemon and Paessler bring together intelligent building technology and advanced monitoring and make your vision of intelligent buildings and data centers become reality.
Real-time notifications mean faster troubleshooting so that you can act before more serious issues occur.
Network Monitoring Software – Version 25.3.110.1313 (August 27, 2025)
Download for Windows and cloud-based version PRTG Hosted Monitor available
English, German, Spanish, French, Portuguese, Dutch, Russian, Japanese, and Simplified Chinese
Network devices, bandwidth, servers, applications, virtual environments, remote systems, IoT, and more
Choose the PRTG Network Monitor subscription that's best for you


POP3 (Post Office Protocol version 3) is a standard email protocol used for retrieving emails from a remote mail server to a local client. It enables users to download messages from their email server to their local device (such as a computer or smartphone), where they can be read offline. POP3 is one of the oldest protocols for handling email. POP3 connections usually use port numbers 110 or 995 for communication.
Yes, PRTG fully supports monitoring of SSL/TLS encrypted POP3 connections. It not only tracks the encryption status but also monitors SSL certificate validity to ensure secure email retrieval processes. It also alerts you to repeated login attempts or potential security breaches.
Absolutely. PRTG offers integrated monitoring for POP3, IMAP, and SMTP protocols, allowing you to oversee your entire email infrastructure from a single platform. This comprehensive approach is particularly valuable for organizations using multiple email protocols.
For instance, you can simultaneously monitor POP3 for email retrieval, IMAP for synchronized access across devices, and SMTP for outgoing mail. PRTG's unified dashboard provides a holistic view of your email system's health, making it easier to identify issues that might affect multiple protocols and streamline your email service management.
The Post Office Protocol Version 3 (POP3) and the Internet Message Access Protocol (IMAP) are both protocols used to retrieve messages from an email client. The difference between these protocols is that POP3 downloads messages from the mail server to the recipient's computer. As a result, the email is only available locally in the POP3 mailbox. IMAP, on the other hand, downloads a copy of the email to the recipient’s computer and leaves the original message on the server.
PRTG uses preconfigured sensors to monitor the sending and receiving of emails that originate in your system. It starts by sending an email to a given email address. This allows you to immediately see whether – and how fast – the email reaches the recipient, and how long it takes for the recipient to retrieve the email via POP3. If the delivery and retrieval are successful, the email is automatically deleted.
PRTG tracks emails by leveraging regular expression matching within log files for advanced analysis. This feature allows PRTG to identify specific patterns, anomalies, or issues in email logs, such as delivery failures, unusual access patterns, or errors. By analyzing these logs, PRTG can help you spot potential security threats or performance issues in your email system early on, enabling you to address them before they escalate into serious problems.
In PRTG, “sensors” are the basic monitoring elements. One sensor usually monitors one measured value in your network, for example the traffic of a switch port, the CPU load of a server, or the free space on a disk drive. On average, you need about 5-10 sensors per device or one sensor per switch port.
Paessler conducted trials in over 600 IT departments worldwide to tune its network monitoring software closer to the needs of sysadmins. The result of the survey: over 95% of the participants would recommend PRTG – or already have.

Paessler PRTG is used by companies of all sizes. Sysadmins love PRTG because it makes their job a whole lot easier.
Bandwidth, servers, virtual environments, websites, VoIP services – PRTG keeps an eye on your entire network.
Everyone has different monitoring needs. That’s why we let you try PRTG for free.