Create maps and dashboards based on different objectives, for example, based on specific sites, vendors, or monitoring purposes.
Clear color coding helps you to quickly detect issues at one glance and to troubleshoot potential issues even before they occur.
Make use of the map rotation feature and let different perspectives of your IT infrastructure rotate on a screen.
Use the built-in map editor to create customized visualizations of your IT infrastructure via drag-and-drop widgets.
Integrate all your network components using more than 300 different widgets – from device and status icons to traffic charts, toplists, or custom images.
Use custom HTML to design your own map elements or to create multi-layer dashboards.
Each created dashboard has a unique URL that you can use for internal or external access.
Publish the dashboard internally for colleagues or the management, or to show it on network operation center screens, for example.
Or make the dashboard publicly available using a public URL, or integrate it directly in other web pages via iFrame.
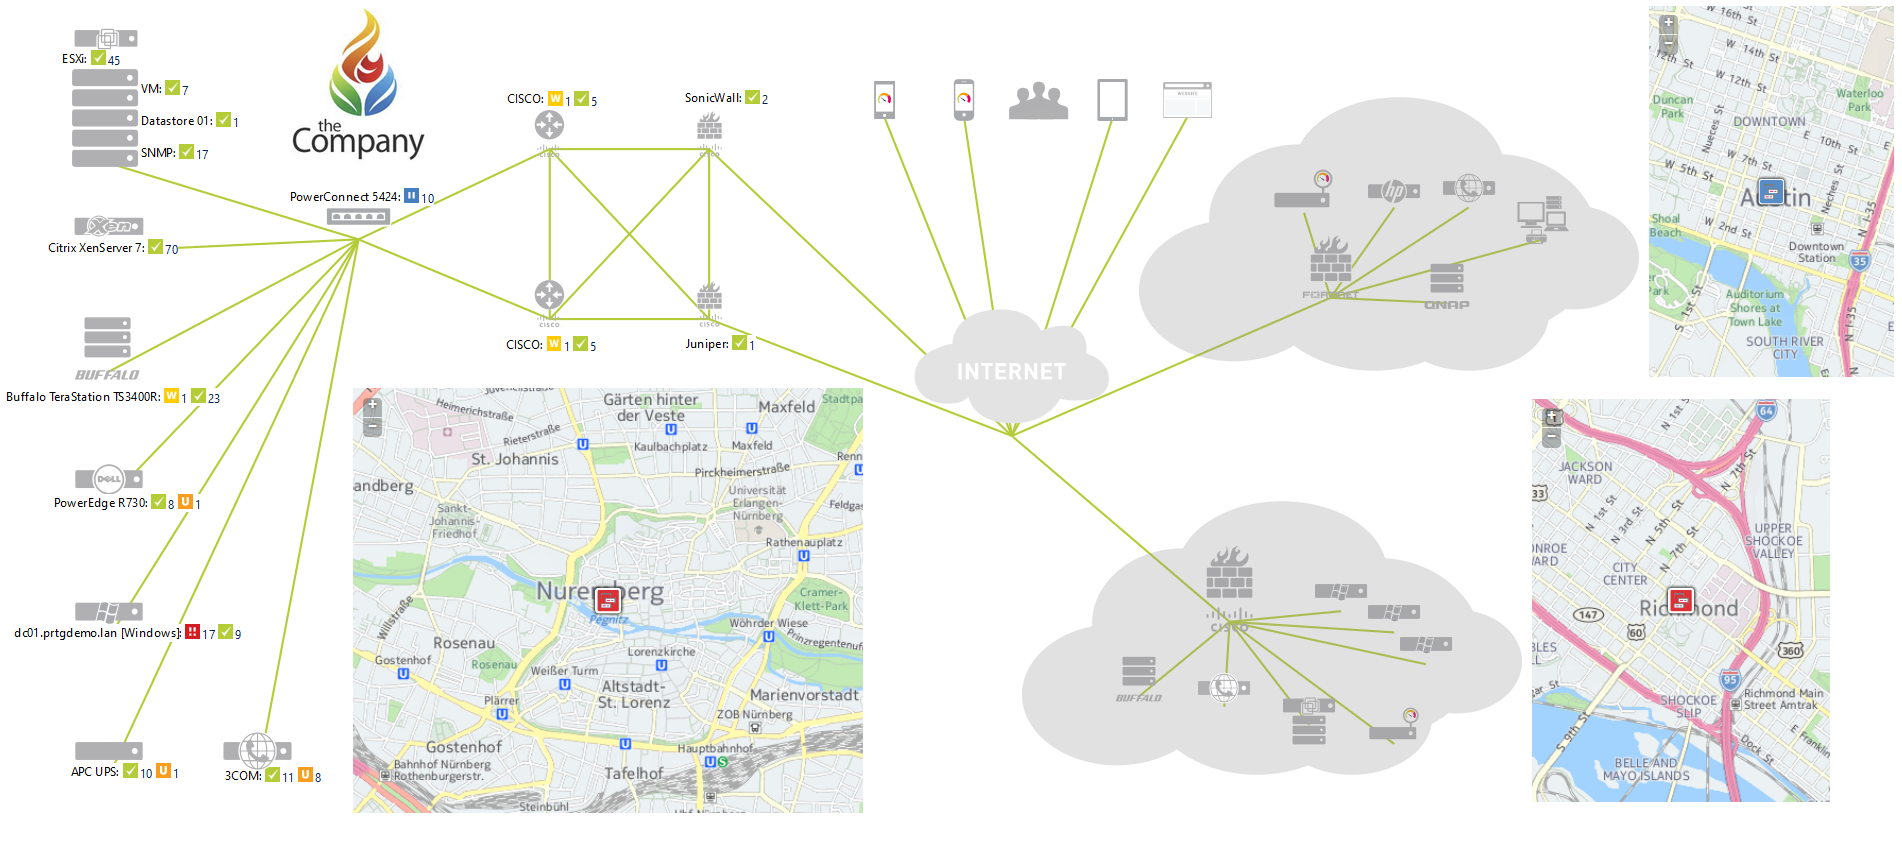
Know exactly what's happening at your remote sites with a branch office network map
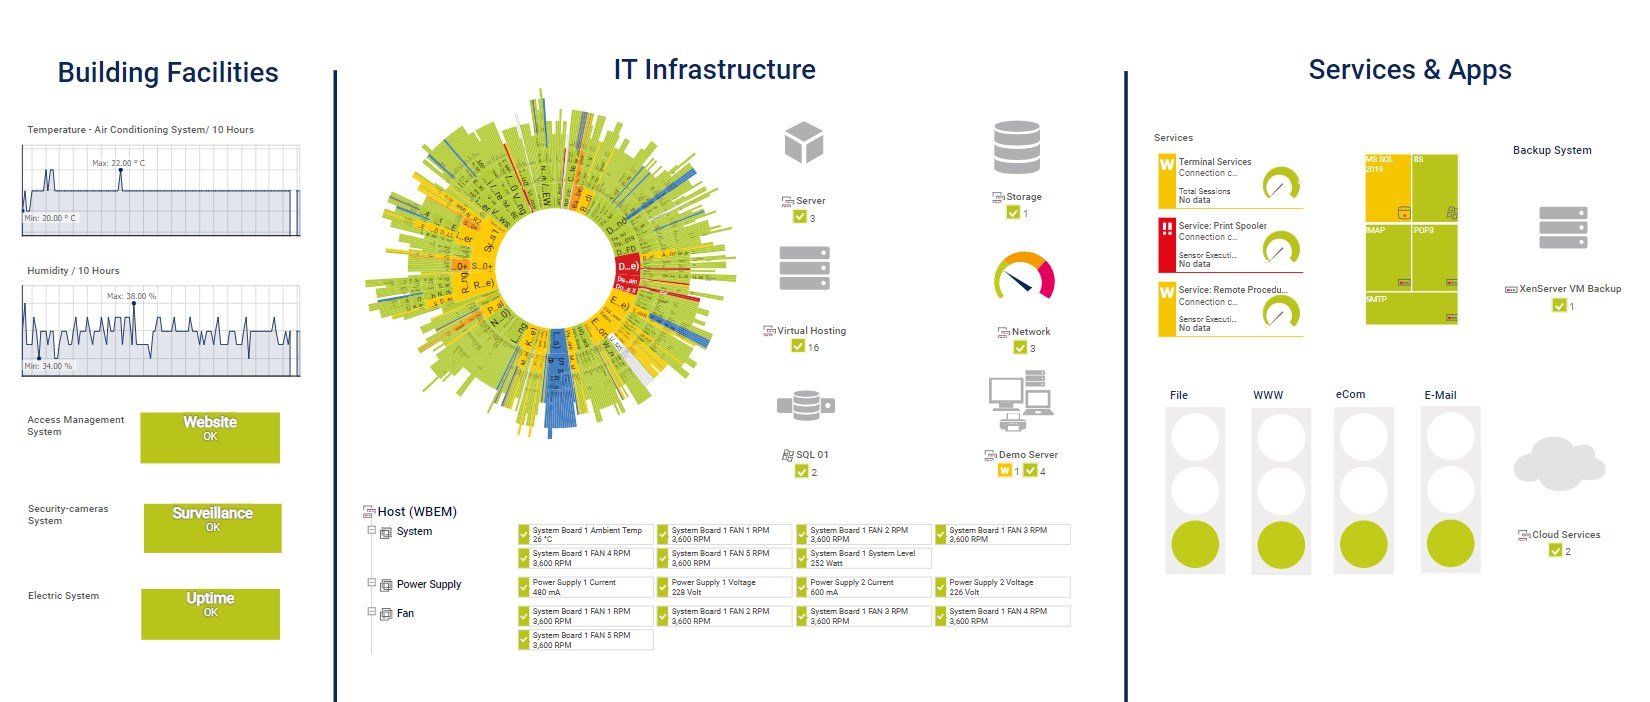
Keep an eye on your network with an IT infrastructure monitoring dashboard
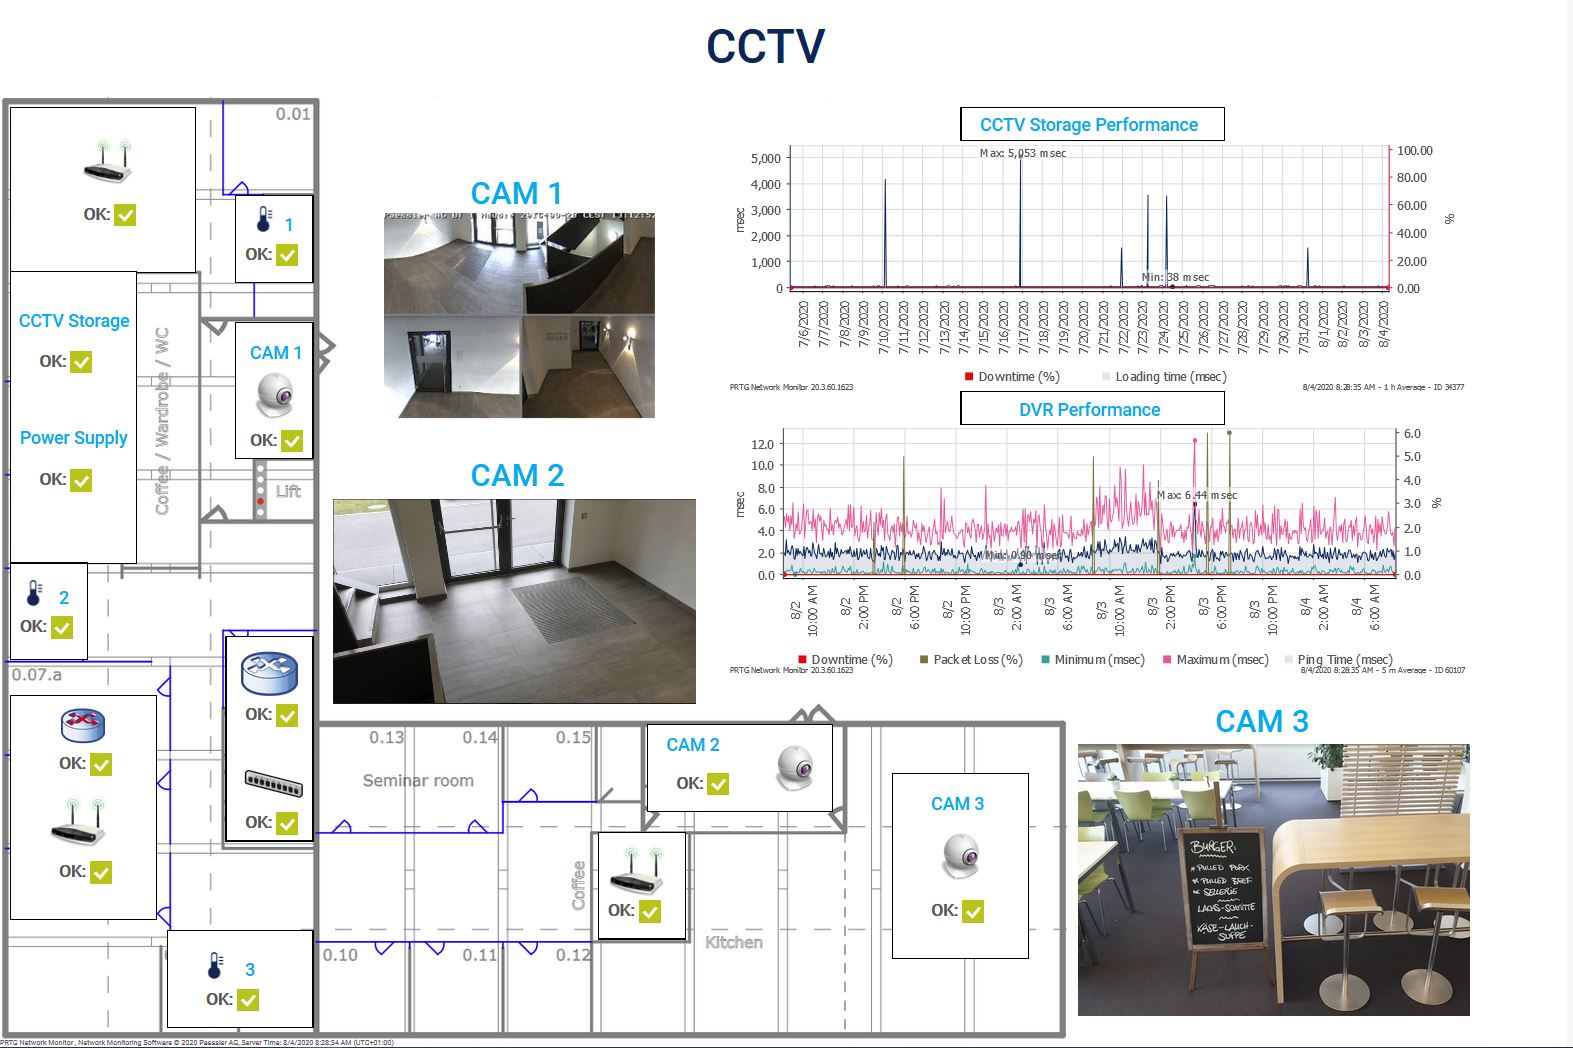
Stay informed about what's going on in your headquarters with a CCTV monitoring dashboard