
Last reviewed: 10/2026


Start with what a license is built around: Opsview’s Essentials and Enterprise packages differ in the capabilities they include, while PRTG license sizes differ only in how many sensors you can run. A sensor usually measures one value, such as the traffic on a switch port, the CPU load of a server or the free space on a disk, and every license includes all monitoring features and unlimited remote probes. So you plan around what you want to watch and license exactly that, without choosing a tier first. Devices with many monitoring points, such as switches, use more sensors, so you decide which ports and metrics matter and move up to a larger license when your setup grows. According to our 2026 survey of 1,088 IT teams, 60.2% of midmarket respondents (250 to 999 employees) picked PRTG because one tool covers everything.
An on-premises Opsview installation runs on a master server, collectors and a MySQL or MariaDB database. PRTG installs as a PRTG core server with its own database and a local probe, so there’s no database server to run. After installation, PRTG runs a quick auto-discovery of your network and creates sensors from preconfigured device templates, so your first devices and their status appear without scripting. If you rely on Nagios-compatible plugins today, you’ll rebuild those checks as PRTG custom sensors, with some scripting. The 30-day trial has no sensor limit, so you can set PRTG up next to your current tool, see what it finds and then fine-tune thresholds, notifications and dashboards step by step while monitoring is already running.
Where Opsview uses collectors for distributed monitoring, PRTG uses remote probes that you install in each network. The probe collects data on site and sends it to your PRTG core server, so you see every site in one PRTG web interface and manage alerts in one place. Probes come as a classic remote probe for Windows or a multi-platform probe for Linux/Unix and Docker, and they let you monitor remote networks without exposing them to the outside. Every license includes unlimited remote probes, so the sensors you run count toward your license, not the number of sites. For very large or multi-server environments, Paessler offers PRTG Enterprise Monitor.
FEATURE | PRTG PRTG | Opsview Opsview |
|---|---|---|
Analyze bandwidth and traffic flows without an add-on | PRTG NetFlow, sFlow and IPFIX sensors, with toplists, are included in every license. | Opsview Limited: NetFlow is part of Network Analyzer, which is included in the Enterprise package. |
Run monitoring without a separate database server | PRTG PRTG stores monitoring data in its own database, so no database server is needed. | Opsview Limited: Runs on a MySQL or MariaDB database, which the installer sets up locally by default. |
Add monitoring locations without extra license costs | PRTG Unlimited remote probes are included in every license. | Opsview Limited: Additional Opsview-managed collectors in Opsview Cloud carry an extra cost on the plan, while self-managed collectors run on your own servers. |
Be monitoring your network on day one | PRTG A quick auto-discovery runs after installation and creates sensors from preconfigured device templates. | Opsview Autodiscovery and AutoMonitor Express Scans cover Windows, VMware vSphere and Azure hosts. |
Alert the on-call engineer before users notice | PRTG Notification triggers with escalation levels send alerts by email, SMS, push, Teams or Slack. | Opsview Notification methods and notification profiles control who is alerted and how. |
Monitor branch offices and sites from one dashboard | PRTG A remote probe in each site reports to one PRTG core server and one PRTG web interface. | Opsview Collector clusters in each site report to the master server, with Remote Collector Management for multi-site setups. |
Map your topology and keep a device configuration history | PRTG Limited: PRTG UVexplorer, a separate product whose data is surfaced inside PRTG, adds automated topology, dependency views, asset inventory, and configuration backup through scheduled discoveries. | Opsview Limited: Network Topology and NetAudit are part of Network Analyzer in the Enterprise package. |
Monitor business applications beyond standard checks | PRTG Limited: Custom sensors such as EXE/Script and SSH Script extend monitoring to your applications with scripting. | Opsview Opspacks and Nagios-compatible plugins extend monitoring to applications. |
PRTG licenses by sensor, so you pay for the values you monitor instead of choosing a package first. Every license includes all monitoring features and unlimited remote probes, and the sizes below differ only in how many sensors they cover. The prices are public, and updates and email support come with every subscription.
| License Name | License description | Price | License Details | Get started | Pricing Details | |
|---|---|---|---|---|---|---|
| PRTG 500 | $200 | per month paid annually | Buy nowBuy now | Enough to monitor multiple aspects of 50 devices | ||
| PRTG 1000 | $358 | per month paid annually | Buy nowBuy now | Enough to monitor multiple aspects of 100 devices | ||
| PRTG 2500 | $742 | per month paid annually | Buy nowBuy now | Enough to monitor multiple aspects of 250 devices | ||
| PRTG 5000 | $1,300 | per month paid annually | Buy nowBuy now | Enough to monitor multiple aspects of 500 devices | ||
| PRTG 10000 | $1,642 | per month paid annually | Buy nowBuy now | Enough to monitor multiple aspects of 1000 devices |
“From a server perspective, we're monitoring all of the key components of our service such as CPU usage, RAM disk space, the Windows services that it's running, and network connectivity of that server. In terms of networks, we’re monitoring all of our switches, firewalls, and access points. It’s really useful to be able to easily pull performance metrics from the PRTG dashboard.”
Auto-discovery fills the device tree with your devices and their sensors, and every sensor shows its current status at a glance. From there you can build maps and dashboards, set up alerts and dig into historical data. Here are four views of everyday monitoring in PRTG.
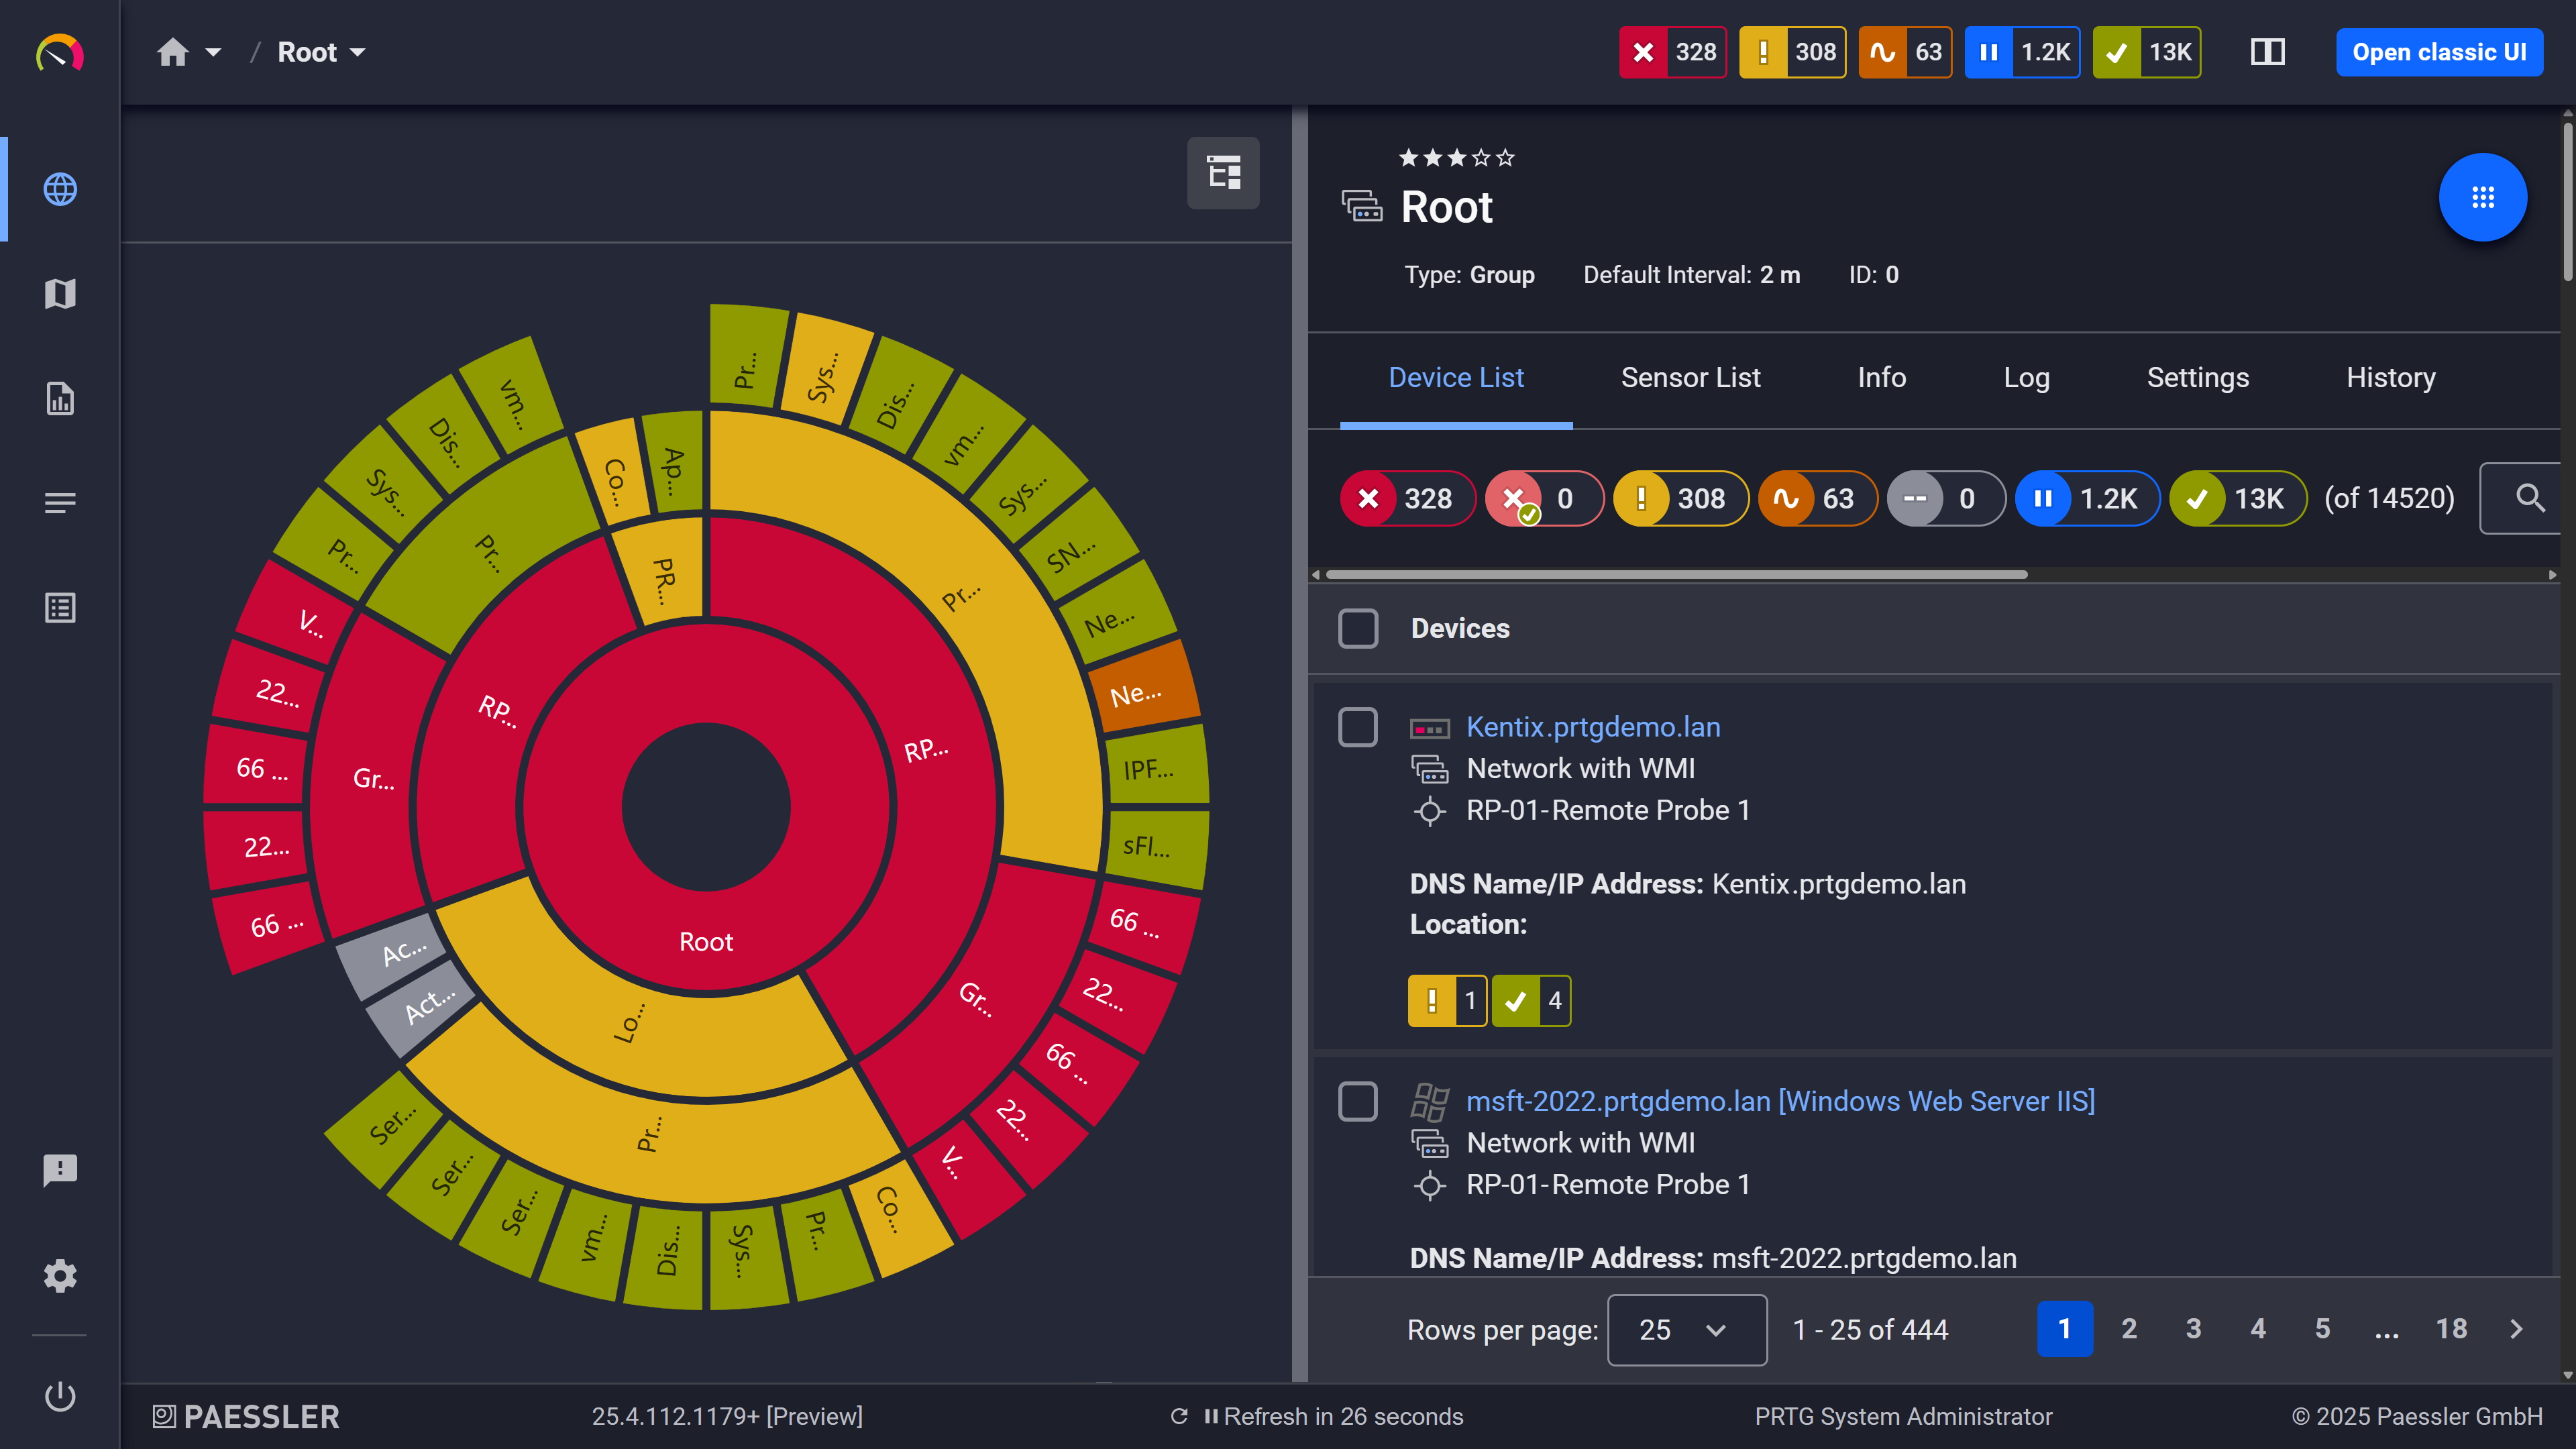
Custom dashboard: your easy-to-grasp overview built from your own sensors
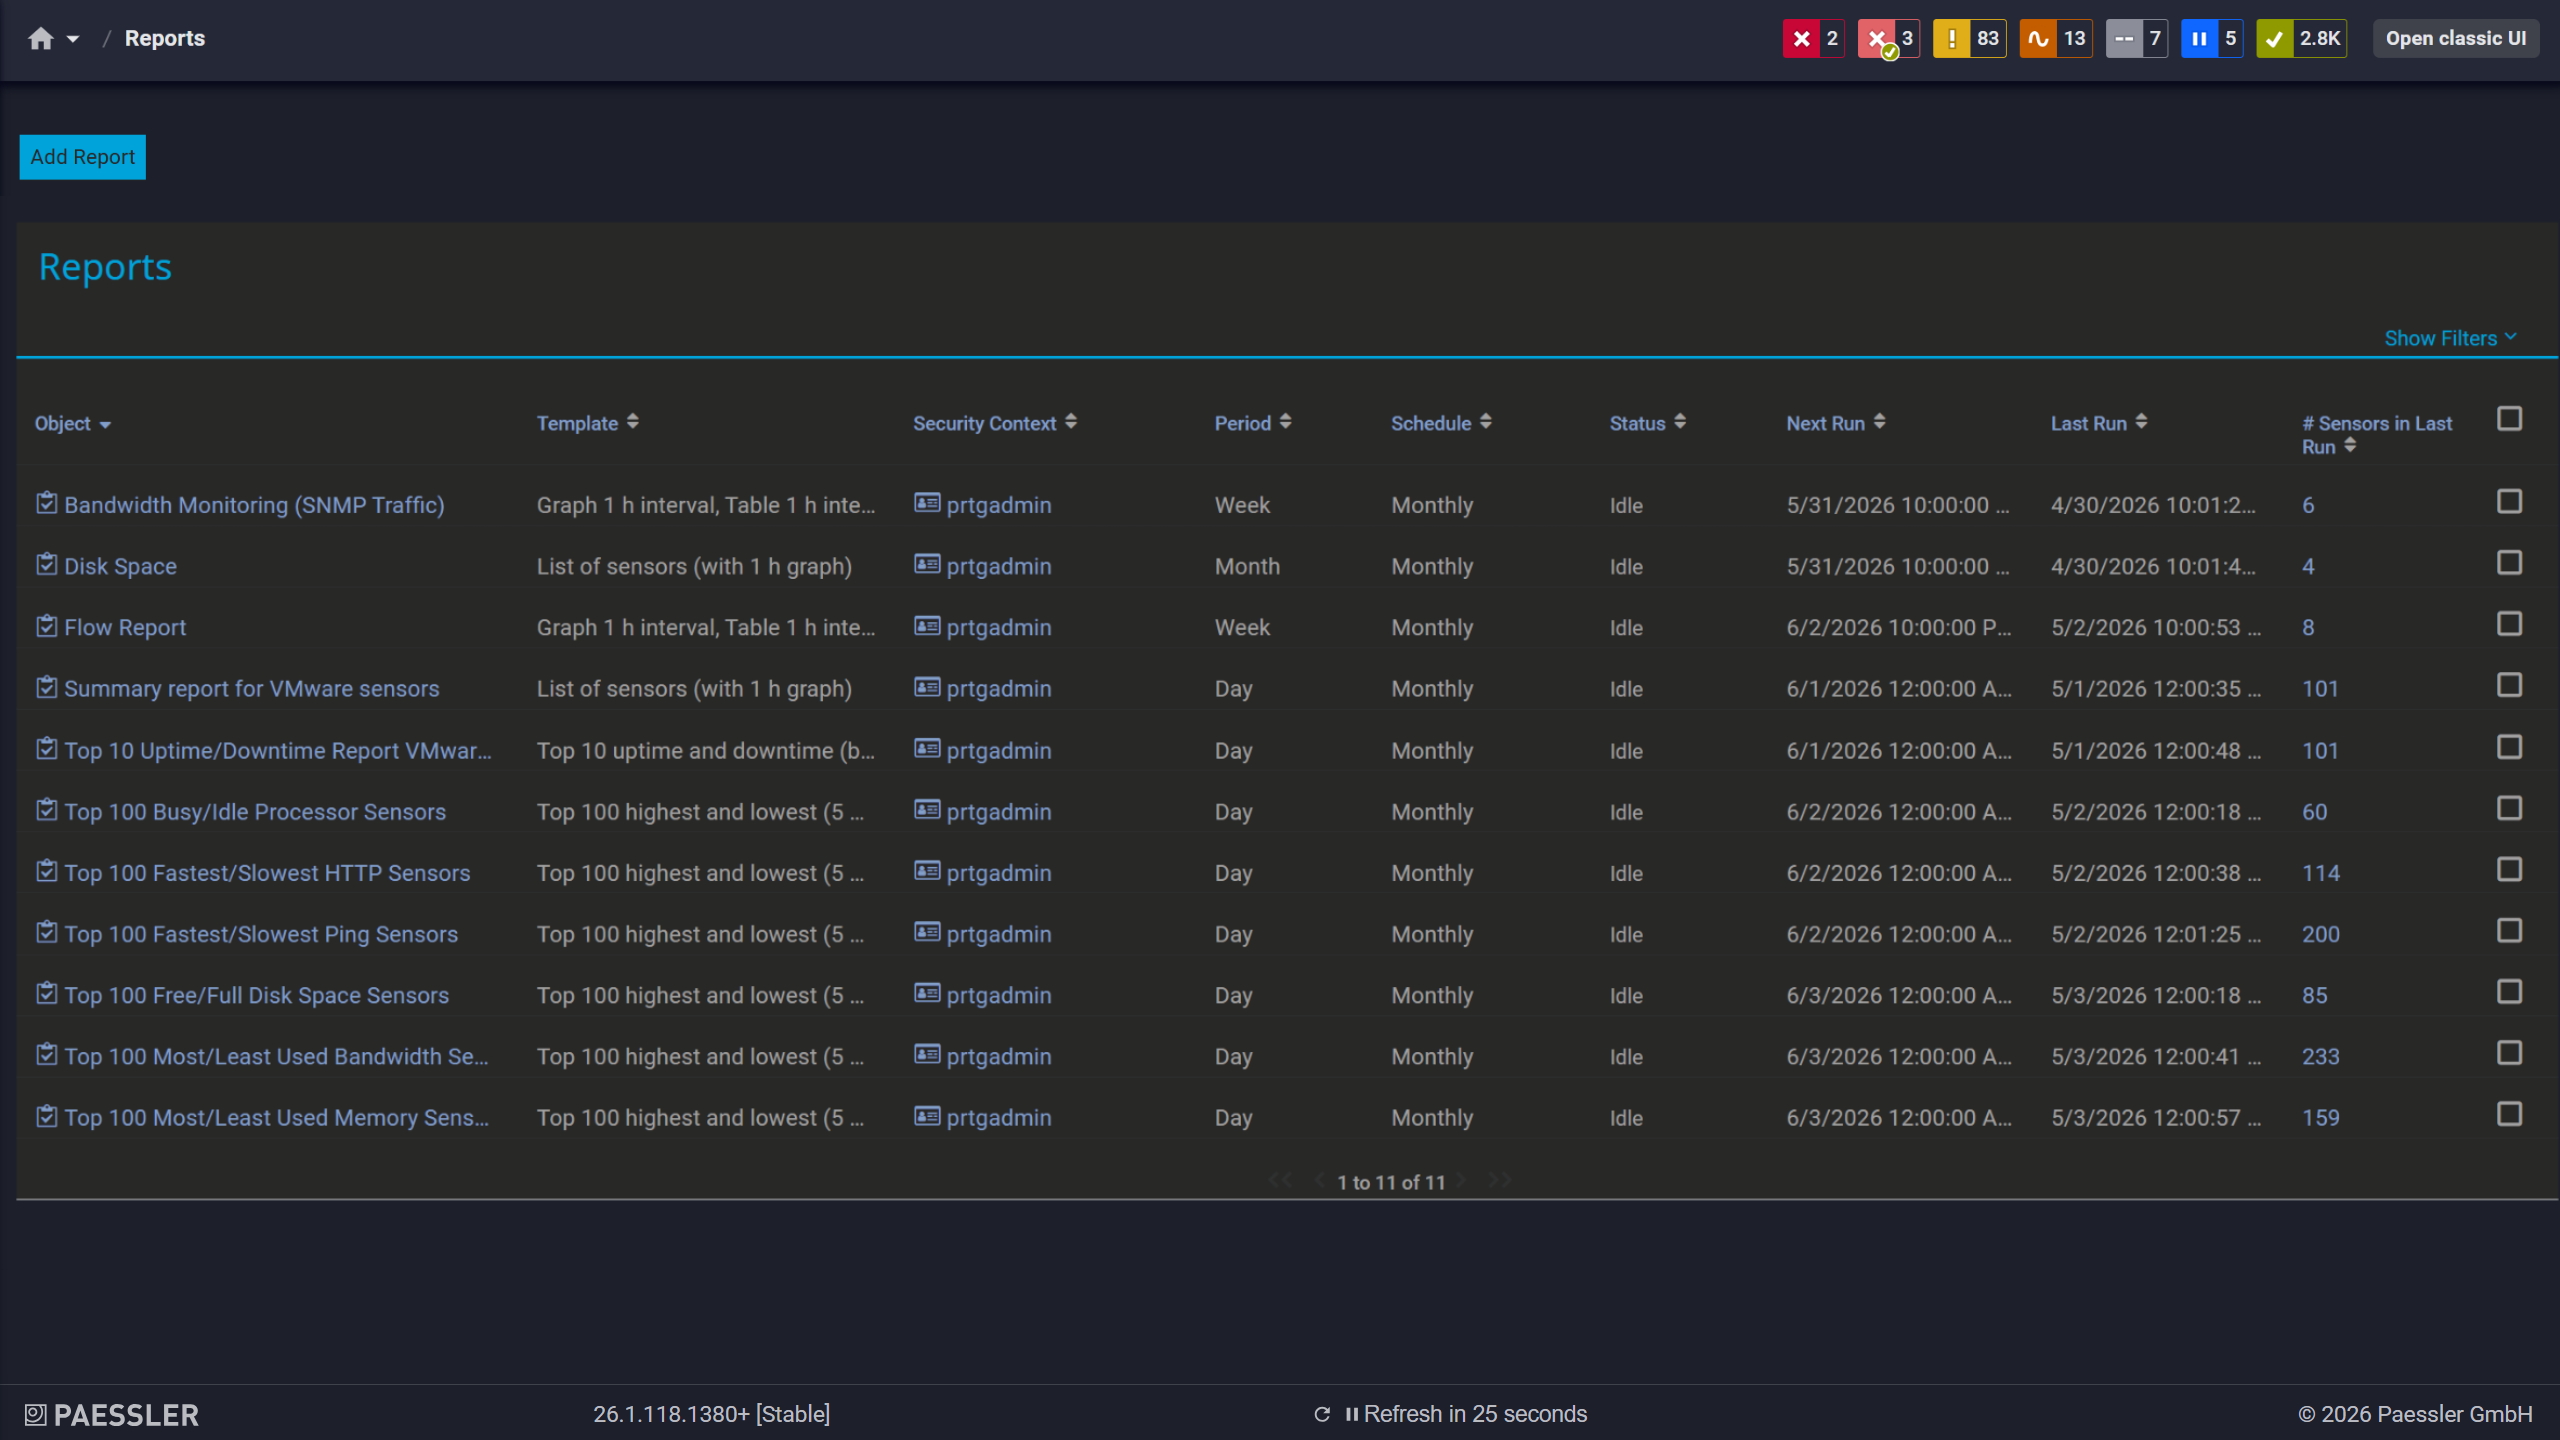
PRTG report screen: See all the reports generated and available to you in one easy to grasp overview
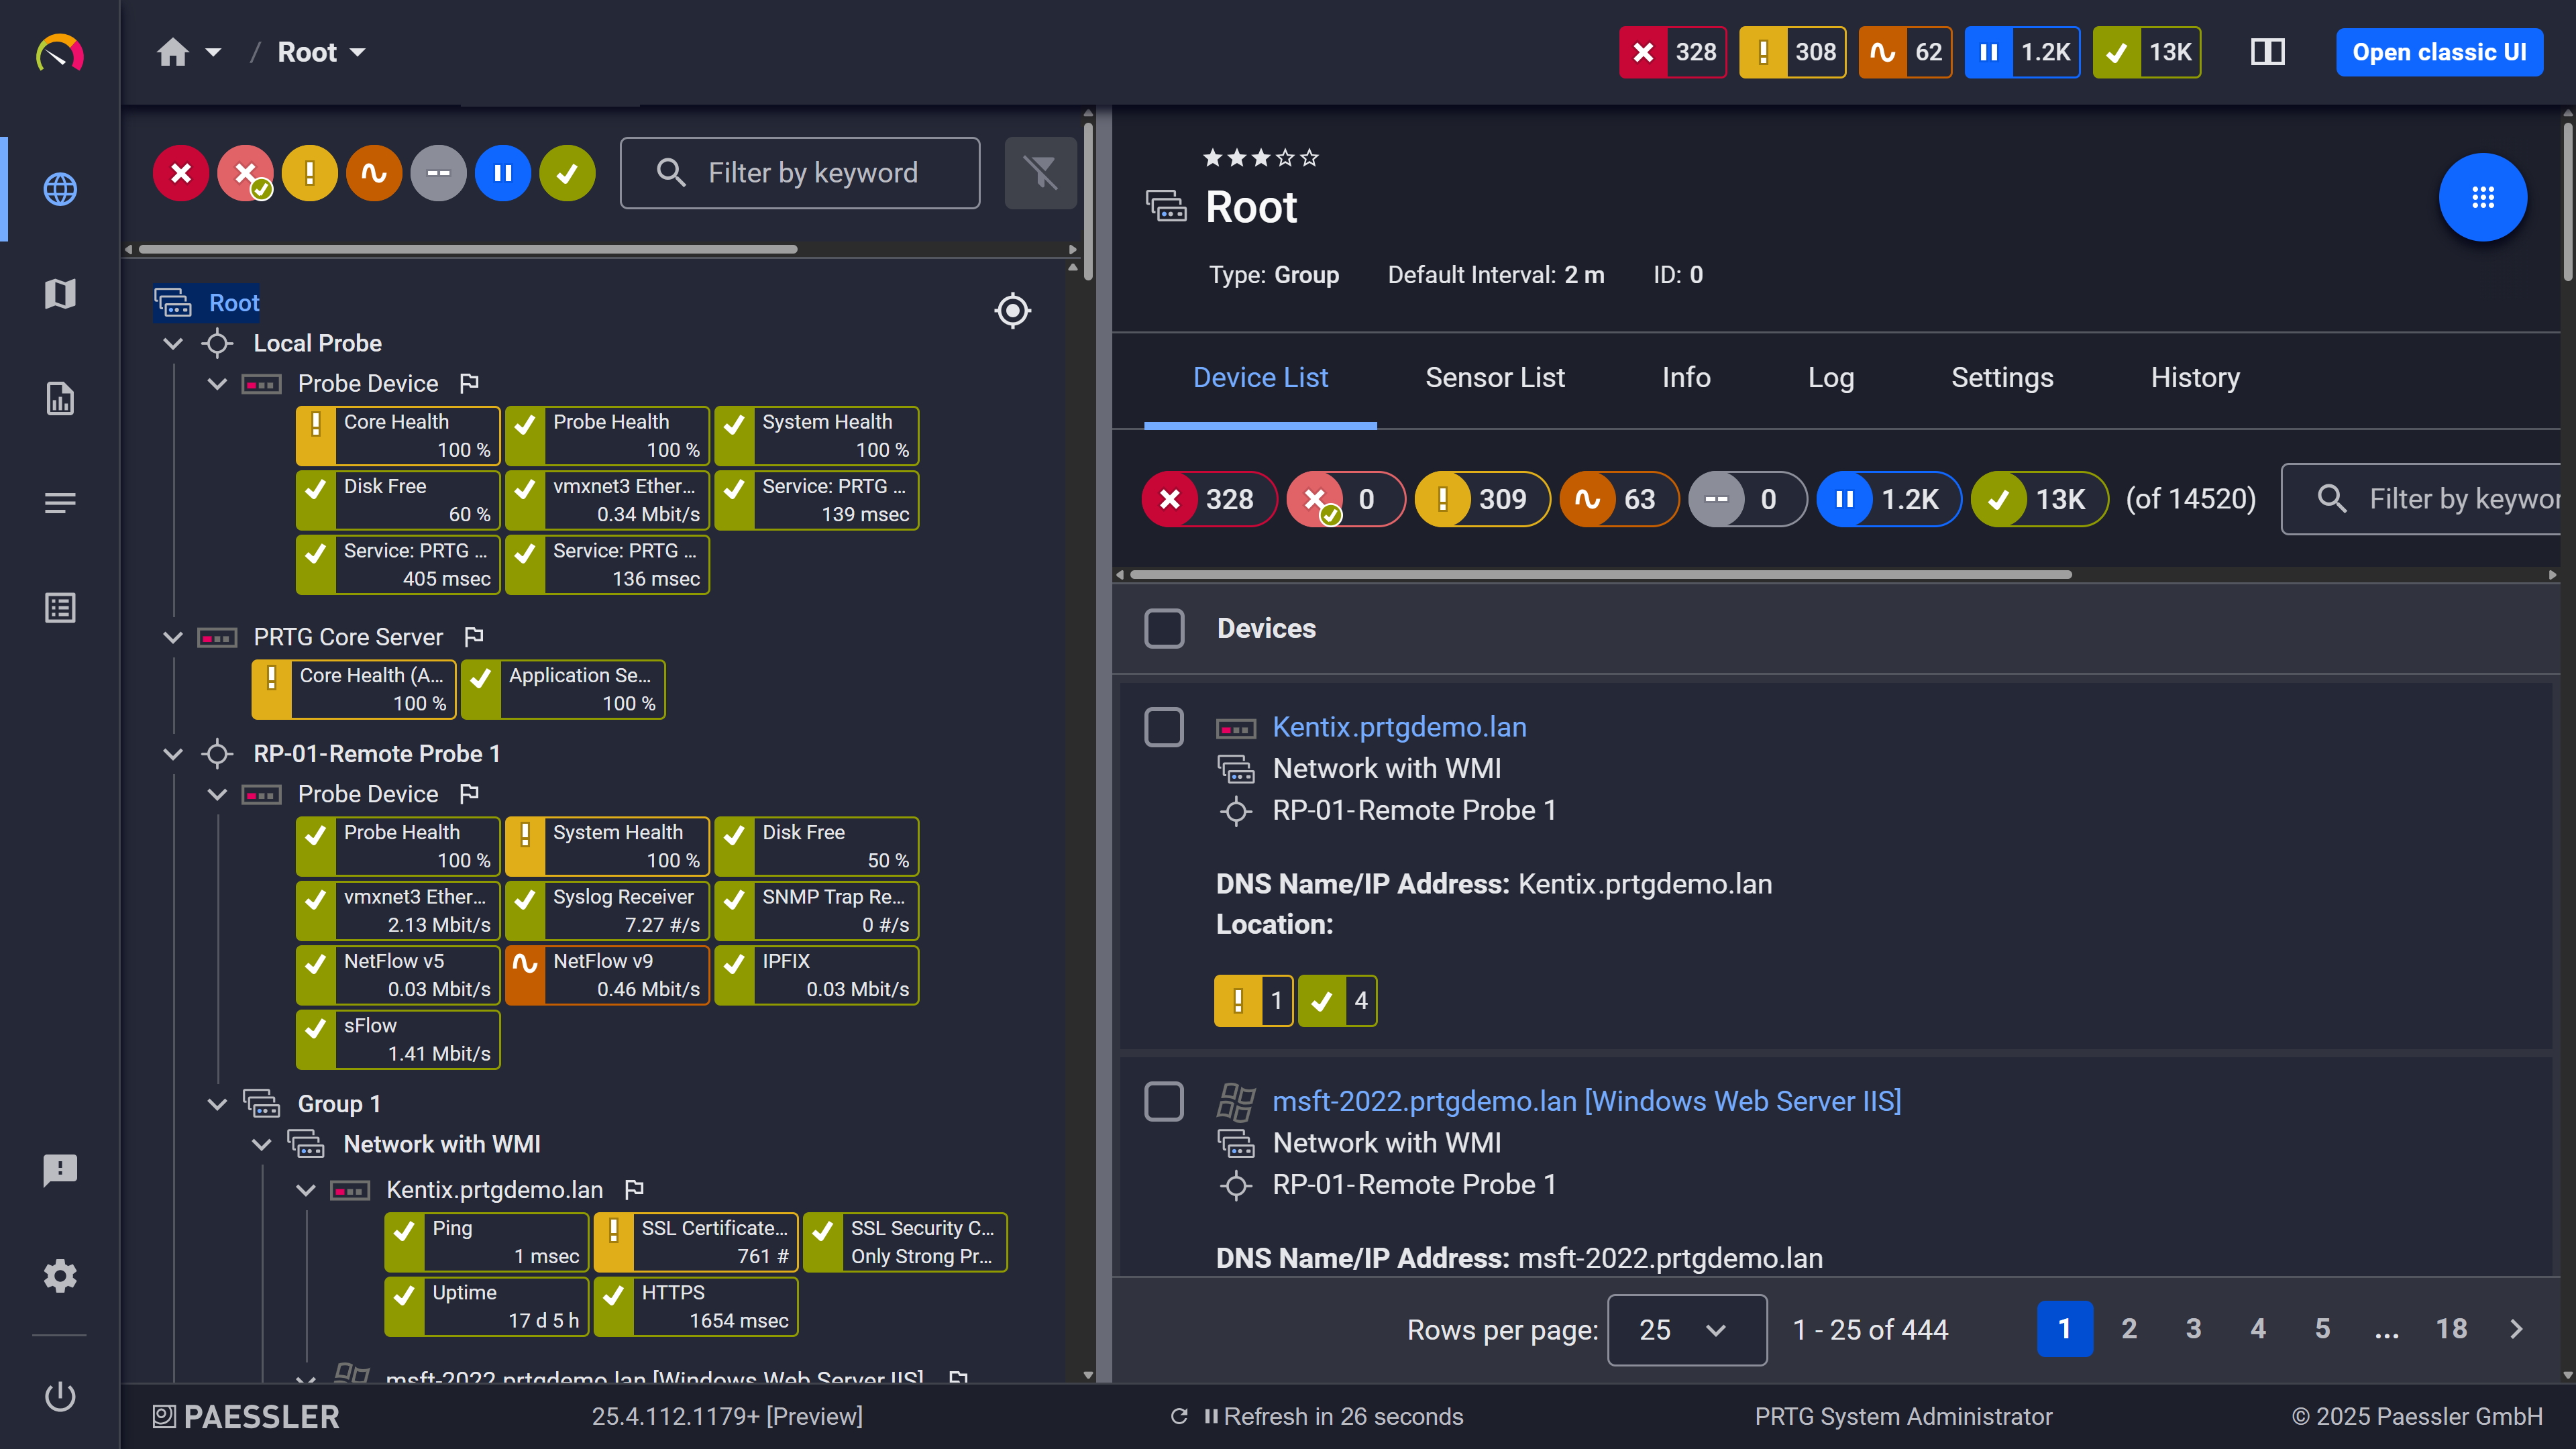
Device tree view: your full infrastructure, organized automatically after auto-discovery
Switching to PRTG follows one simple principle: your live network is the source. PRTG’s auto-discovery reads what actually exists and rebuilds your monitoring directly from it. Four steps take you from your current setup to a running PRTG installation.
Have a list of hostnames or IP addresses of your current devices. This can be from your own documentation, or get it from your current monitoring tool. In Opsview, pull your host list through the REST API endpoint /rest/config/host. This list is your completeness checklist for the entire switch. Then install PRTG alongside your current tool: both can run in parallel during the transition.
Enter your IP ranges and device credentials (e.g. for protocols like SNMP or WMI). PRTG’s auto-discovery scans the network segments, identifies device types, and creates suitable sensors from built-in device templates. The rebuild comes from your live network, so it reflects what is really there. Compare the result against your device list from step 1 and add any sensors auto-discovery could not infer.
What you know maps cleanly to PRTG. Collectors become remote probes, hosts become devices, host groups become groups, service checks become sensors, host templates become device templates, and dashboards become maps. Then recreate your alerting workflows with PRTG’s notification templates and triggers.
Compare alerts side by side for a few weeks. Adjust thresholds and schedules, and build the maps and reports your team and leadership rely on. Decommission the old tool once PRTG has proven itself in daily operation.
A tool switch is the ideal moment to find out what your old setup wasn’t watching. Paessler PRTG UVexplorer, a separate product whose data is surfaced inside PRTG, runs scheduled discoveries that build a multi-vendor topology map and asset inventory of what actually exists on your network. Compare that inventory against what ITRS Opsview was monitoring, and close any blind spots before they carry over. After cutover, the same point-in-time snapshot confirms that your PRTG rebuild caught everything.
The current name is ITRS Opsview, sold by ITRS Group, which acquired Opsview Limited in 2021. ITRS documentation describes two packages, Essentials and Enterprise, while the current pricing page labels the top tier Observability. According to that documentation, the Enterprise package adds Network Analyzer (network topology, NetAudit and NetFlow), Dynamic Thresholds and Forecasting. In PRTG Network Monitor, every license includes all monitoring features, and the license sizes differ only by sensor count.
That depends on your environment, your team and your budget. Among Opsview alternatives, PRTG suits teams that want to be monitoring quickly with little setup: auto-discovery builds your first sensors after installation, every license includes all monitoring features, and PRTG stores monitoring data in its own database, so there’s no database server to run. Unlimited remote probes cover additional sites, and the 30-day trial has no sensor limit, so you can test PRTG on your own network.
Instead of importing an Opsview configuration, you let PRTG’s auto-discovery rebuild your monitoring from your live network. Run auto-discovery on your networks so PRTG creates devices and sensors from device templates, then set up your notifications and rebuild any custom checks as PRTG custom sensors, which takes some scripting. You can run both tools side by side until you’re happy with the result.
Opsview’s pricing page defines a host as any monitored device, and each virtual machine with its own IP address counts as one. PRTG counts sensors instead, meaning the individual values you monitor, such as ports, disks or services. Which model fits depends on how many values you watch per device, and PRTG’s 30-day trial has no sensor limit, so you can count your real number before you buy.
Yes. PRTG uses remote probes, which you install in each network to collect data locally and send it to your PRTG core server. Every license includes unlimited remote probes, either as a classic probe for Windows or as a multi-platform probe for Linux/Unix and Docker. In our 2026 survey, 55.3% of respondents from decentralized enterprises (1,000 or more employees running PRTG across sites or business units) said they monitor distributed sites or remote offices.
In PRTG you define the limits yourself for each sensor, so every alert reflects a threshold you chose and can adjust at any time. Notifications go out by email, SMS, push, Microsoft Teams or Slack message, with escalation levels for unresolved issues. Historical data and graphs show how values develop over time, so you can base your limits on your own baselines.
PRTG covers custom checks with its own custom sensors, so you rebuild your plugin logic there. The EXE/Script sensors run your own executables, batch files, VBS and PowerShell scripts, and the REST Custom sensor reads values from APIs. Your logic needs some adaptation so that it returns results in a format PRTG reads, and the PRTG Sensor Hub offers scripts and sensors shared by Paessler and the community.
The PRTG core server runs on Windows, and Paessler recommends Windows Server 2022, 2019 or 2016. Remote probes run on Windows as classic probes or on Linux/Unix and Docker as multi-platform probes. If you prefer not to run the core server yourself, PRTG Hosted Monitor is available, and both versions include unlimited remote probes.
We also compared PRTG with other monitoring tools:
Cacti is a free network monitoring tool offers bandwidth and traffic monitoring via SNMP and displays data in charts. It may not be enough if you are hoping to analyze network bandwidth in more detail.
Dynatrace offers AI-driven monitoring but with complex consumption-based pricing. PRTG delivers comprehensive monitoring with straightforward sensor-based pricing and flexible deployment options.
New Relic offers strong asset performance management and observability, but full IT infrastructure monitoring can be costly and requires a fair amount of manual configuration.
NetCrunch's node-based, policy-driven model can quickly become expensive. PRTG can flex beyond Windows-only environments, and its sensor-based pricing keeps costs transparent, predictable, and affordable.
Start a 30-day trial with unlimited sensors, no commitment required.
Tell us your device count and we'll send you a quote.
See PRTG in a live demo with one of our monitoring experts.
