
Last reviewed: 10/2026


As of October 2026, OpenNMS lists Meridian subscriptions in tiers defined by cores and Minions, with a device cap on the Standard tier. PRTG licenses are sized by sensors instead, where a sensor is one thing you watch on a device, such as a ping check or the traffic on a single port. Every license supports every sensor type, so you decide what to monitor and the license only sets how much. That breadth is why, according to our 2026 survey of 1,088 IT teams, one tool that covers everything was the top reason midmarket teams (250 to 999 employees) chose PRTG, named by 60.2% of them. Your sensor count follows how deeply you monitor each device, so you can size the license around what matters most.
Your SNMP and flow know-how carries over directly, because PRTG monitors with the same protocols: SNMP, NetFlow, sFlow and IPFIX. What changes is how you extend the tool: EXE/Script, Python Script, SSH Script and REST sensors, together with the HTTP API, turn the scripts you already write into sensors that sit in the same device tree, with graphs and alerts. That puts custom checks within reach of your existing scripting skills. Developing plugins for the platform itself is a different model, and OpenNMS describes that kind of deep customization as one of its strengths.
PRTG fits lean teams that run many sites: a remote probe at each location reports to one PRTG core server, and configurable Modbus TCP, OPC UA and MQTT sensors bring your OT devices into the same device tree as your IT. As of October 2026, OpenNMS positions Meridian for complex, distributed infrastructure that scales through a tiered set of components such as Minions and Sentinel, while PRTG covers many sites with one core server and remote probes. The PRTG core server runs on Windows, and remote probes run on Windows or, through the multi-platform probe, on Linux. If you run IT in healthcare, government or finance, our industry pages cover what monitoring looks like in those environments.
FEATURE | PRTG PRTG | OpenNMS Meridian OpenNMS Meridian |
|---|---|---|
Analyze bandwidth and traffic flows without an add-on | PRTG Flow sensors for NetFlow, sFlow, IPFIX and jFlow are part of every license, with Toplists for traffic drill-down. | OpenNMS Meridian Limited. Flow data is stored in an Elasticsearch cluster with the Drift plugin, and flow graphs use the OpenNMS plugin for Grafana. |
Add monitoring locations without extra license costs | PRTG Every license includes remote probes in any number, so each site can have its own. | OpenNMS Meridian Limited. Minion repository access starts at the Essential tier (up to 10 Minions), and Premier includes up to 25. |
Run monitoring without installing and maintaining a database | PRTG PRTG ships with its own file-based database, included in the installation. | OpenNMS Meridian Limited. Requires a PostgreSQL database (version 14 or higher in Meridian 2026), installed alongside the core. |
Alert the on-call engineer before users notice | PRTG State and threshold triggers set once on a probe, group or device are inherited by the sensors beneath it. | OpenNMS Meridian Alarms, email notifications, on-call roles and a webhook strategy for Slack, Teams, Discord and other HTTP endpoints are documented parts of Meridian. |
Extend the platform itself with custom plugins and event processing | PRTG Limited. Extends through custom sensors, custom notifications and the HTTP API. | OpenNMS Meridian The OpenNMS Plugin API, event translator and Scriptd are documented parts of Meridian. |
See topology, device configurations and inventory in one place | PRTG Limited. Available with PRTG UVexplorer, a separate product whose topology, configuration backup and inventory data is surfaced inside PRTG through scheduled discoveries. | OpenNMS Meridian Layer 2 and 3 topology, Device Configuration Backup and hardware inventory adapters are documented parts of Meridian. |
The tiers below are listed by sensor count, so you choose the size that matches what you plan to monitor and see the price before you talk to anyone. Every subscription includes updates to the latest PRTG version, security improvements and email support. If your environment grows, you can upgrade to a larger tier later.
| License Name | License description | Price | License Details | Get started | Pricing Details | |
|---|---|---|---|---|---|---|
| PRTG 500 | $200 | per month paid annually | Buy nowBuy now | Enough to monitor multiple aspects of 50 devices | ||
| PRTG 1000 | $358 | per month paid annually | Buy nowBuy now | Enough to monitor multiple aspects of 100 devices | ||
| PRTG 2500 | $742 | per month paid annually | Buy nowBuy now | Enough to monitor multiple aspects of 250 devices | ||
| PRTG 5000 | $1,300 | per month paid annually | Buy nowBuy now | Enough to monitor multiple aspects of 500 devices | ||
| PRTG 10000 | $1,642 | per month paid annually | Buy nowBuy now | Enough to monitor multiple aspects of 1000 devices |
”Adopting PRTG has been like going from being in the dark to being in the light. Before, we had limited visibility into what was happening in the infrastructure and in the network. Now, however, thanks to the comprehensive dashboard and real-time notifications, we receive constant updates on the status of facilities and services, and our way of working has gone from passive to proactive.”
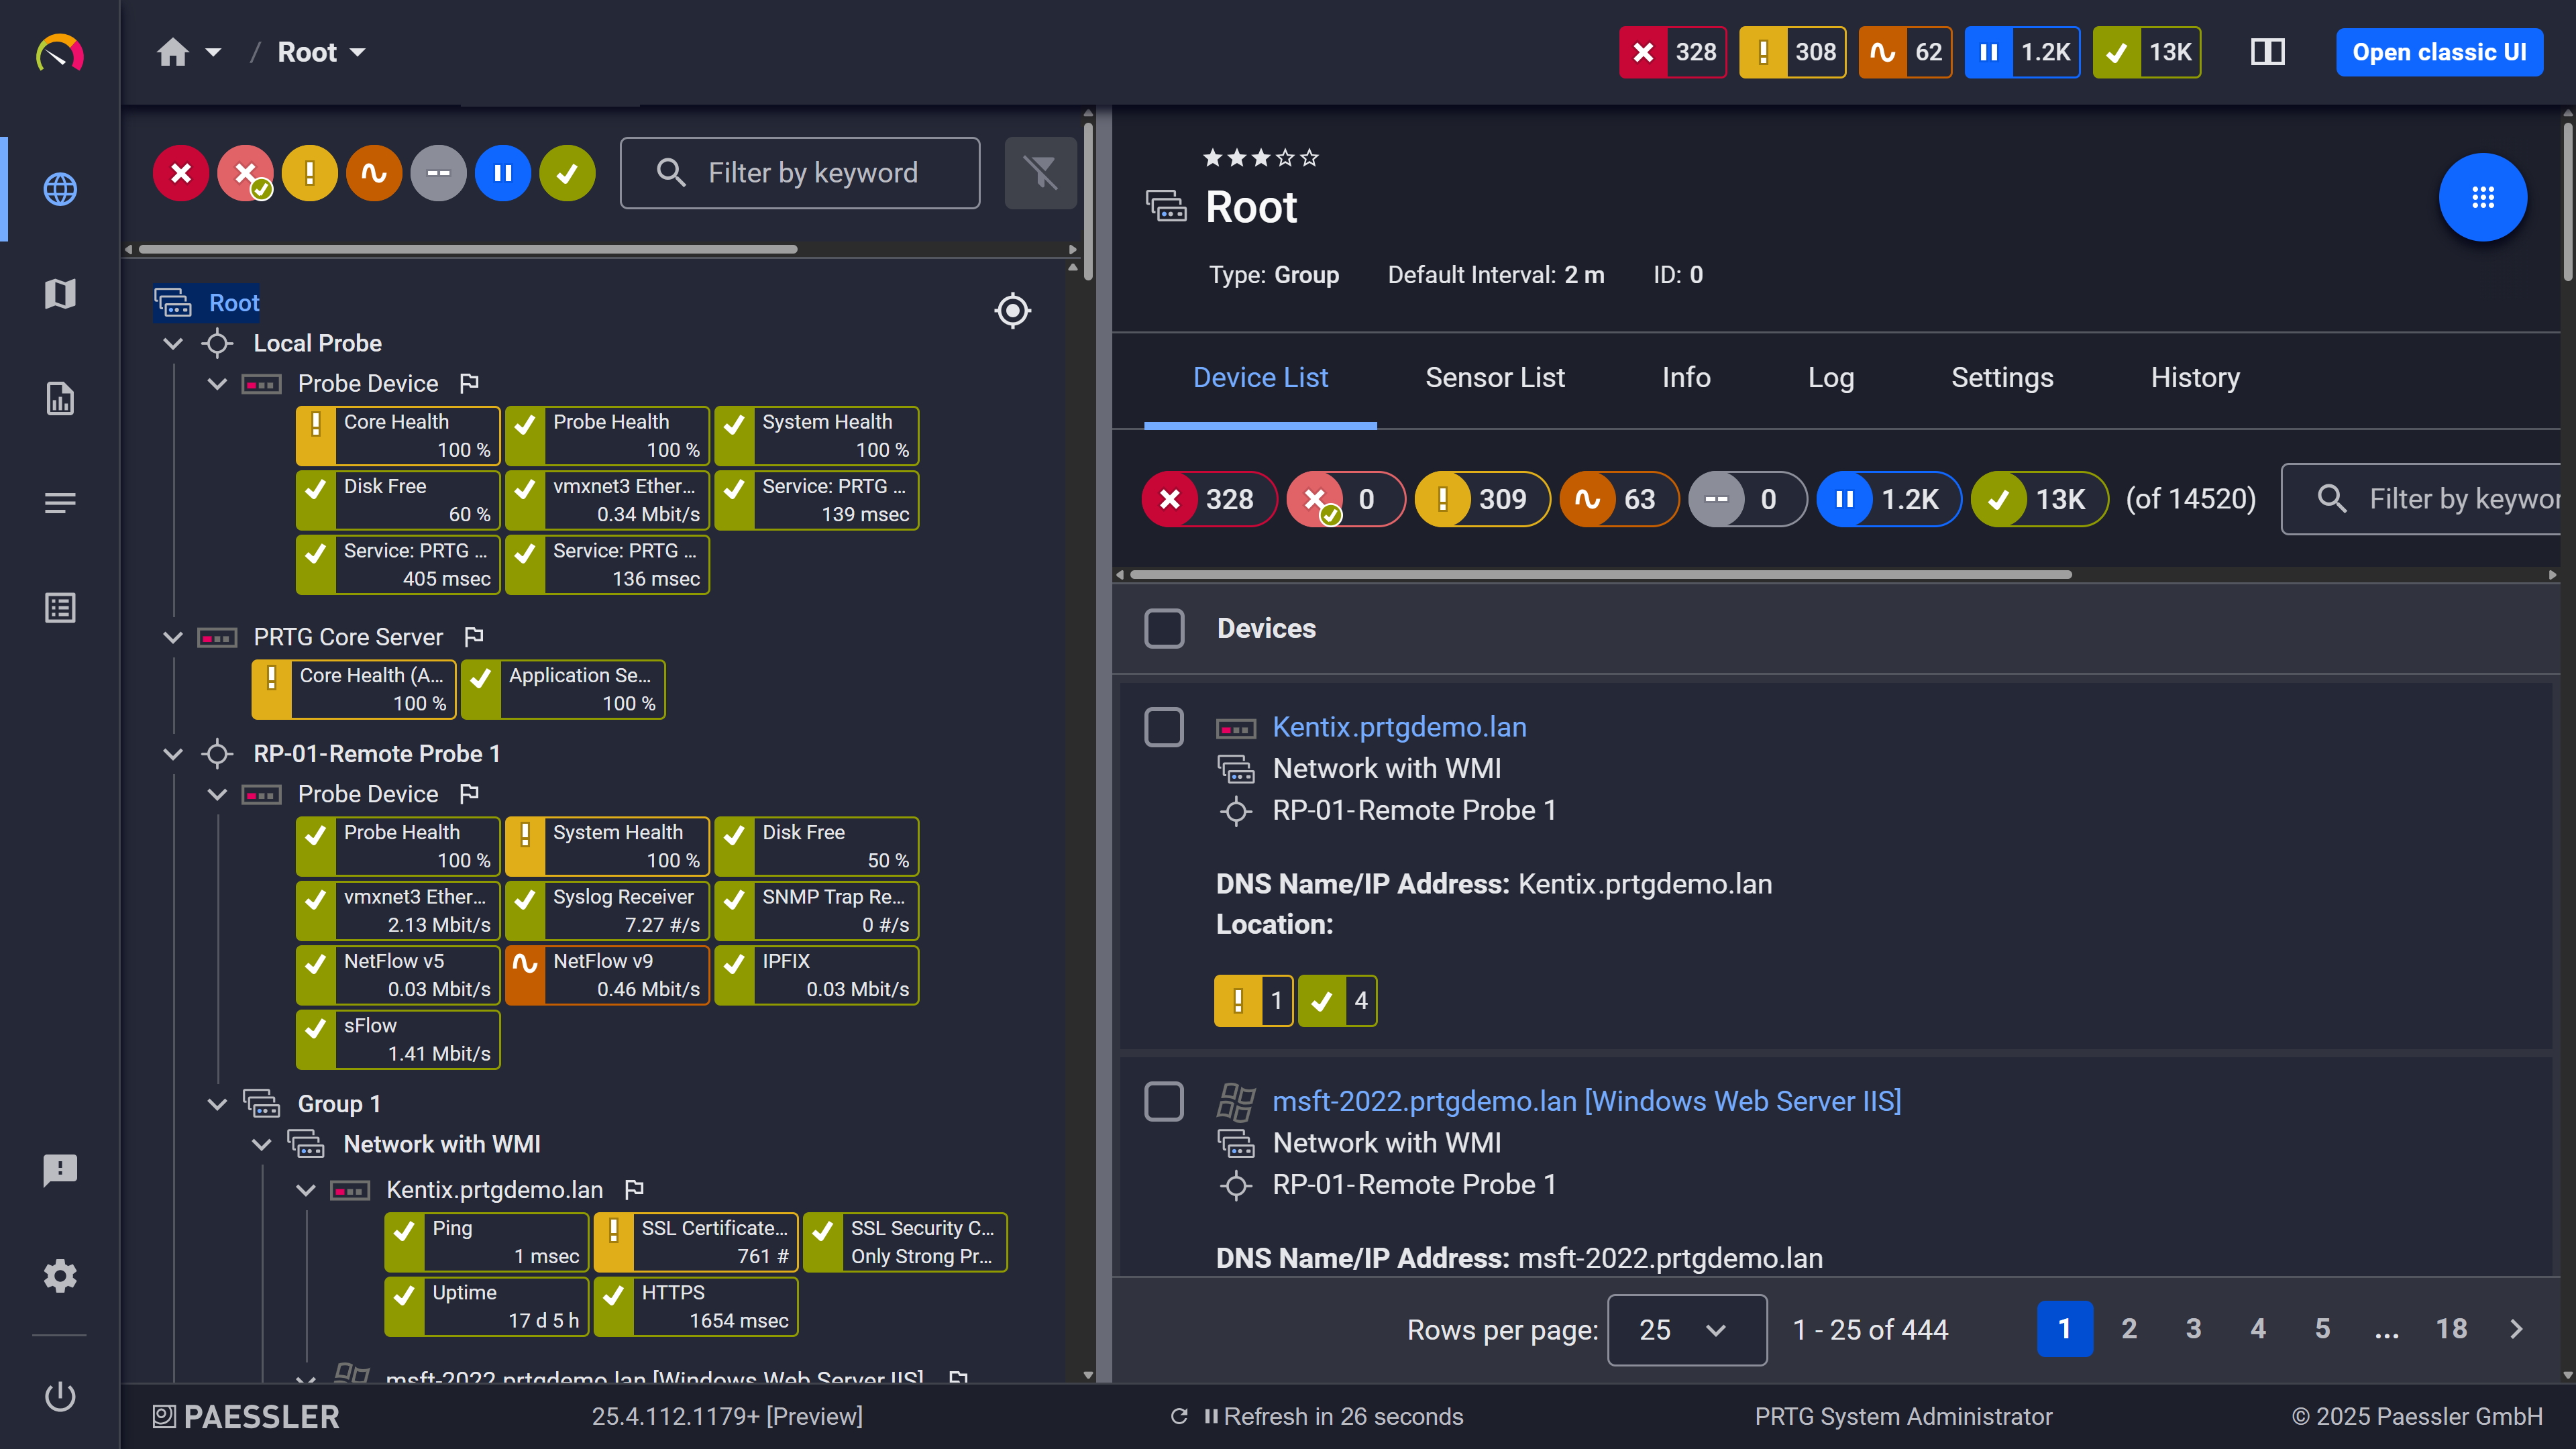
Auto-discovery builds your device tree from what it finds on the network, adding each device with sensors created from built-in device templates. From there, each sensor shows its own status and graphs, and the same tree extends to flow data and remote locations.
A tool switch is the ideal moment to find out what your old setup wasn’t watching. PRTG UVexplorer, a separate product whose data is surfaced inside PRTG, runs scheduled discoveries that build a multi-vendor topology map and asset inventory of what actually exists on your network. Compare that inventory against what OpenNMS Meridian was monitoring, and close any blind spots before they carry over. After cutover, the same point-in-time snapshot confirms that your PRTG rebuild caught everything.
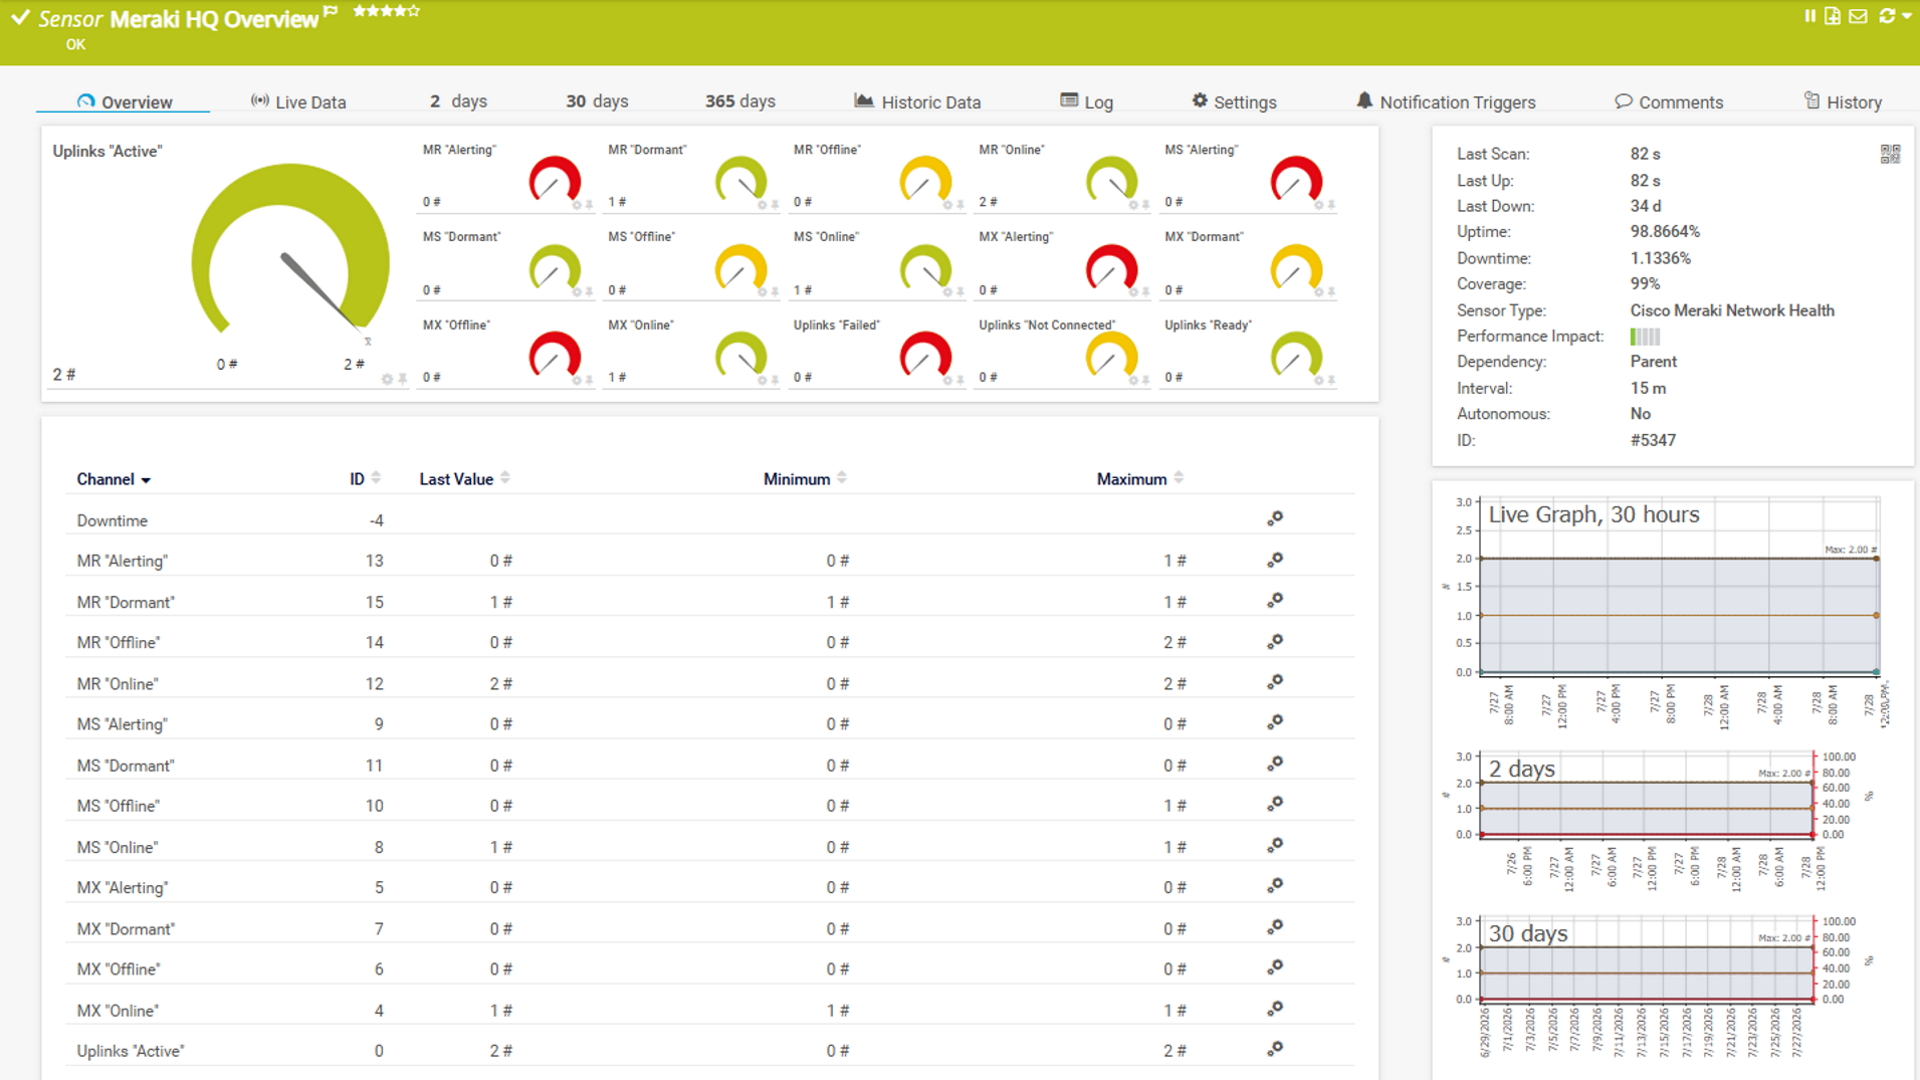
Sensor traffic: live sensor data, updated on your configured scan interval
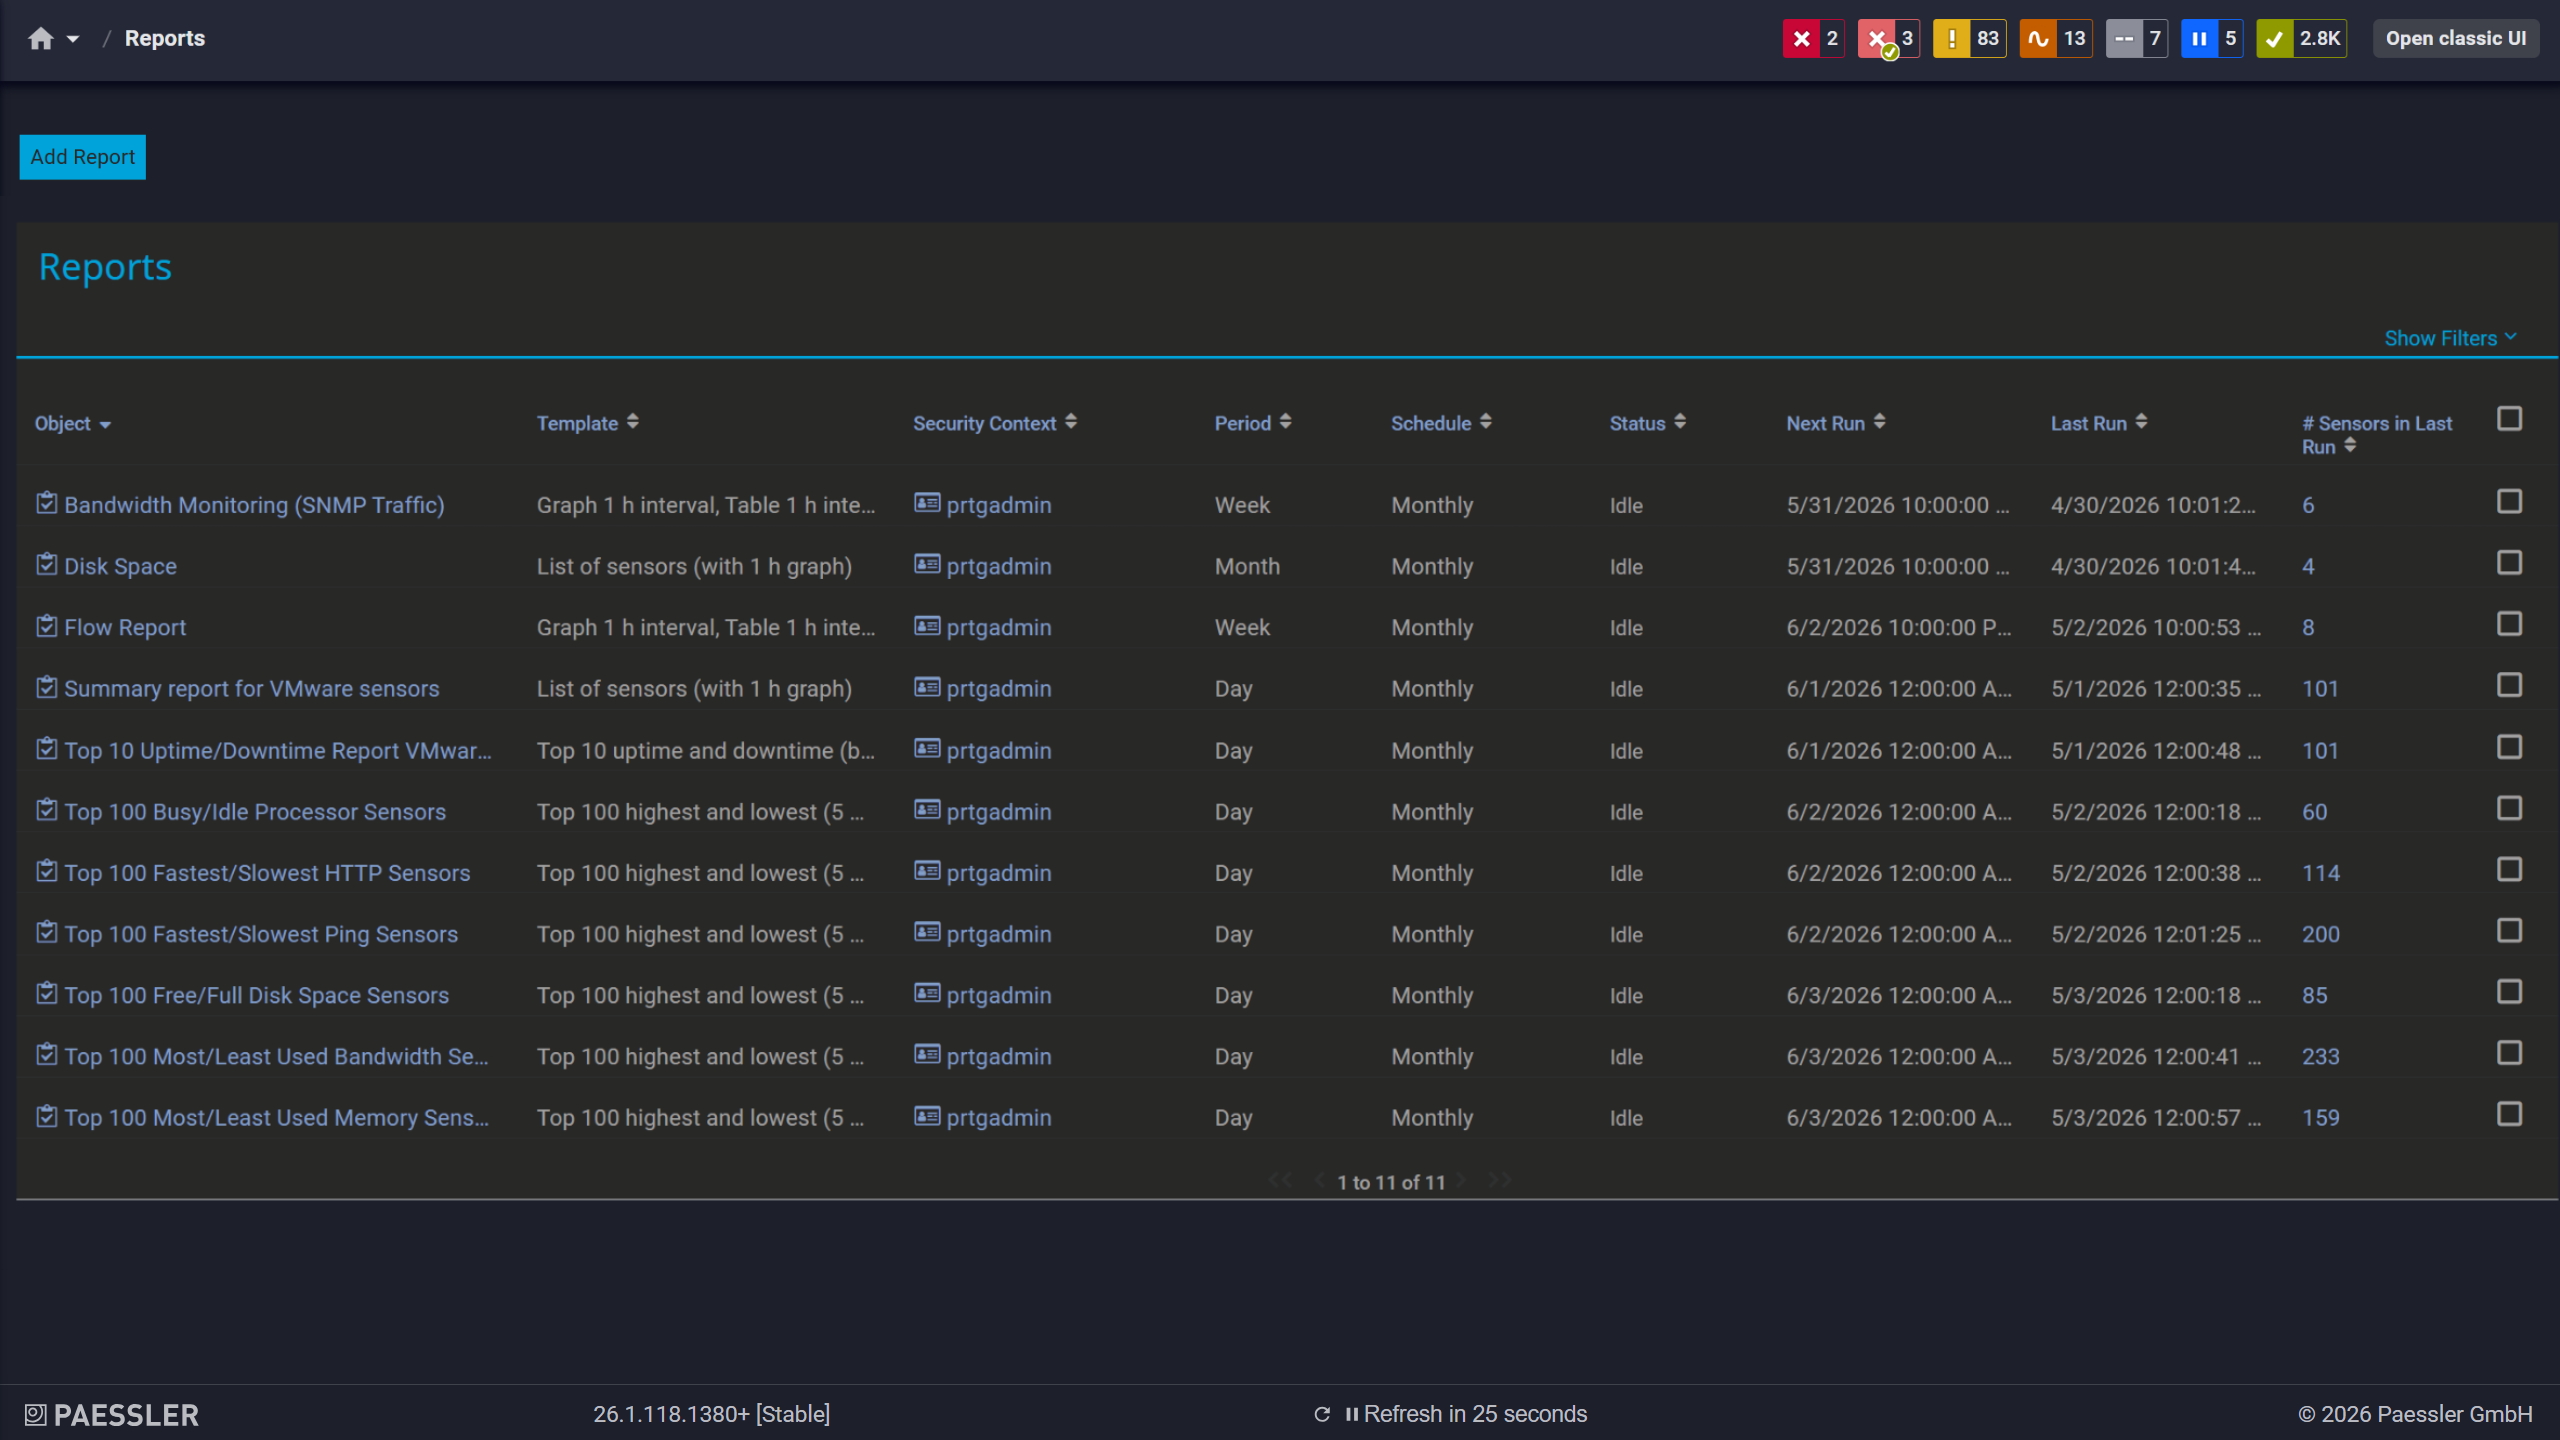
PRTG report screen: See all the reports generated and available to you in one easy to grasp overview
Switching to PRTG follows one simple principle: your live network is the source. PRTG’s auto-discovery reads what actually exists and rebuilds your monitoring directly from it. Four steps take you from your current setup to a running PRTG installation.
Have a list of hostnames or IP addresses of your current device. This can be from your own documentation, or get it from your current monitoring tool. In OpenNMS, export your node list from the node list page, which offers one-click export in Meridian 2026, or pull it from the Nodes REST API. This list is your completeness checklist for the entire switch. Then install PRTG alongside your current tool: both can run in parallel during the transition.
Enter your IP ranges and device credentials (e.g. for protocols like SNMP or WMI). PRTG’s auto-discovery scans the network segments, identifies device types, and creates suitable sensors from built-in device templates. The rebuild comes from your live network, so it reflects what is really there. Compare the result against your device list from step 1 and add any sensors auto-discovery could not infer.
What you know maps cleanly to PRTG. Minions become remote probes, nodes become devices, monitored services and collected metrics become sensors, discovery ranges become auto-discovery groups, and dashboards become maps. Then recreate your alerting workflows with PRTG’s notification templates and triggers.
Compare alerts side by side for a few weeks. Adjust thresholds and schedules, and build the maps and reports your team and leadership rely on. Decommission the old tool once PRTG has proven itself in daily operation.
A tool switch is the ideal moment to find out what your old setup wasn’t watching. Paessler PRTG UVexplorer, a separate product whose data is surfaced inside PRTG, runs scheduled discoveries that build a multi-vendor topology map and asset inventory of what actually exists on your network. Compare that inventory against what OpenNMS Meridian was monitoring, and close any blind spots before they carry over. After cutover, the same point-in-time snapshot confirms that your PRTG rebuild caught everything.
Horizon is free, and PRTG has a free route too. The 30-day trial has no sensor limit, and afterward PRTG turns into a freeware edition with up to 100 sensors and support for every sensor type. Freeware is free for personal and commercial use, so you can run a real pilot before any budget conversation.
As of October 2026, OpenNMS lists Meridian prices for every tier except Premier+, and the tiers are defined by cores and Minions. PRTG tiers are defined by sensor count instead, with prices published up to PRTG 10000 and PRTG Enterprise Monitor for environments beyond that. Every PRTG license supports every sensor type, so the tier is the only variable.
PRTG has sensors for SNMP (including trap receiving), syslog, NetFlow, sFlow, IPFIX, VMware and Hyper-V. List what you monitor in OpenNMS today and match it against the sensor library. Custom EXE/Script, Python Script, SSH Script and REST sensors extend coverage to anything beyond the standard library.
PRTG rebuilds your monitoring from the live network instead of importing OpenNMS configuration. Auto-discovery finds your devices and proposes the sensors, so the setup reflects what exists today. Your OpenNMS history stays available in OpenNMS, which can keep running alongside PRTG for as long as you need it.
The counterpart to a Minion is the remote probe: you install it at a site, and it sends its results to your central PRTG core server. Probes run on Windows or, through the multi-platform probe, on Linux. According to our 2026 survey, 55.3% of decentralized enterprises (1,000 or more employees) monitor distributed sites or remote offices, compared with 40.5% of all respondents. Each probe also adds a few health sensors that count toward your sensor total, so you can watch the probe itself.
The PRTG core server runs on Windows, and the multi-platform probe brings Linux and Docker into your setup for remote locations, connected to the core server through a NATS server. It offers a growing selection of sensors, so check that the ones you need are available on it before you plan a Linux-only site.
Maps and dashboards are built from your own sensors, so they match how your team works. For advanced reporting, PRTG’s Data Exporter and external BI tools extend what the built-in reports cover.
We also compared PRTG with other monitoring tools:
ControlUp offers strong digital experience monitoring but complex pricing and limited network insights. PRTG provides full visibility, clear sensor-based pricing, and flexible deployment.
Spiceworks is free and ideal for small-to-medium businesses with basic monitoring needs and limited budgets, but it lacks enterprise-grade functionality for growing organizations.
Atera offers an all-in-one IT platform requiring agent installation, while PRTG provides flexible, agentless monitoring with budget-friendly sensor-based pricing.
N-able excels at RMM and endpoint management for MSPs but requires hands-on management with complex, expensive pricing. PRTG provides unified network monitoring with transparent, predictable, and cost-effective pricing.
Start a 30-day trial with unlimited sensors, no commitment required.
Tell us your device count and we'll send you a quote.
See PRTG in a live demo with one of our monitoring experts.
