
Last reviewed: 10/2026


PRTG licenses by sensors, and a sensor is one monitored value, like the traffic on a switch port or the CPU load on a server. You set that number by choosing what to monitor, so your invoice stays tied to your infrastructure, not to how much data your applications happen to send in a busy month. Every remote probe you add across sites or subnets is included in the same license, so expanding to a new location adds coverage, not a new fee. Very large or fast-changing environments should still plan their sensor count as they grow: it's a number you can see coming and budget for, well before the month it changes.
PRTG's job is the layer beneath your applications: infrastructure, network, servers, and cloud, all visible from one dashboard instead of several. According to our 2026 survey of 1,088 IT teams, having one tool that covers everything is the top reason midmarket IT teams choose PRTG, cited by 60.2% of respondents, well above the 53.9% average across all segments. That kind of consolidated view closes the infrastructure and network blind spots that live outside the application layer. Code-level application performance monitoring and distributed tracing aren't part of PRTG's native toolset, so if you rely on that today, plan to keep a dedicated APM tool running alongside it, or extend PRTG with custom sensors for the metrics that matter most to you.
PRTG runs wherever you choose to put it: install PRTG Network Monitor on your own servers for full on-premises control, or run PRTG Hosted Monitor in the cloud if you'd rather not manage the infrastructure yourself. Either way, coverage extends beyond applications and servers to the network layer and, where you need it, operational technology: PRTG supports Modbus TCP, OPC UA, and MQTT natively, so control systems and IoT devices show up in the same dashboard as the rest of your infrastructure. That reach matters most for teams managing multiple sites or a mix of IT and OT, since it means one deployment choice and one licensing model cover all of it. OT protocols do need configuration to match your specific devices and network segments, so budget that setup time even though the protocol support itself comes standard.
FEATURE | PRTG PRTG | New Relic New Relic |
|---|---|---|
Cover network, servers, applications, and cloud with one license | PRTG Included in every PRTG license, no add-on required | New Relic Limited: full access to APM, infrastructure, and network data requires a paid full platform user seat |
Analyze bandwidth and traffic flows without a separate integration | PRTG Native NetFlow, sFlow, jFlow, and IPFIX sensors included | New Relic Limited: requires the Kentik-based Network Performance Monitoring integration, billed under the same per-GB data ingest meter |
Add monitoring locations without extra license costs | PRTG Unlimited remote probes included in every license | New Relic Limited: new instrumented hosts and services at each location add to your metered data ingest total |
Keep your monitoring data wherever you choose to run it | PRTG On-premises, cloud-hosted, or hybrid deployment, your choice | New Relic ✗ SaaS-only, no on-premises deployment option |
Track server and cloud performance without instrumenting every application | PRTG Agentless collection via SNMP, WMI, and REST APIs | New Relic Limited: requires the Infrastructure agent per host, plus a separate APM agent per application for code-level metrics |
Keep virtualization hosts and virtual machines visible alongside your network | PRTG Native VMware and Hyper-V sensors connect directly to the host, no agent installed on the monitored system | New Relic Limited: requires the Infrastructure agent on a separate host plus the vSphere on-host integration; reporting may be incomplete above 800 VMs |
Get alerted before users notice a slowdown | PRTG Multi-channel alerts (email, SMS, push, Slack, Teams, PagerDuty) triggered on threshold breach | New Relic Alert conditions configurable by full platform users through NRQL-based policies |
See problems down to the line of code | PRTG Limited: possible via custom sensors and scripting; native distributed tracing isn't part of PRTG's toolset | New Relic Native distributed tracing, code-level diagnostics, and service maps |
Get pre-built dashboards for your application data | PRTG Limited: dashboards and maps are customizable; pre-built cross-server dashboards require PRTG Enterprise Monitor's Multi-Core Dashboards feature | New Relic Pre-built APM and infrastructure dashboards included |
PRTG's pricing is based on sensors: pay for what you monitor, not for how much data you send or how many people need access. Every PRTG license includes every feature and device type, so there's no separate module to add later as your needs grow. That's different from a usage-based model like New Relic's, where the bill moves with data volume and user seats: with PRTG, your cost stays tied to what you've chosen to monitor.
| License Name | License description | Price | License Details | Get started | Pricing Details | |
|---|---|---|---|---|---|---|
| PRTG 500 | $200 | per month paid annually | Buy nowBuy now | Enough to monitor multiple aspects of 50 devices | ||
| PRTG 1000 | $358 | per month paid annually | Buy nowBuy now | Enough to monitor multiple aspects of 100 devices | ||
| PRTG 2500 | $742 | per month paid annually | Buy nowBuy now | Enough to monitor multiple aspects of 250 devices | ||
| PRTG 5000 | $1,300 | per month paid annually | Buy nowBuy now | Enough to monitor multiple aspects of 500 devices | ||
| PRTG 10000 | $1,642 | per month paid annually | Buy nowBuy now | Enough to monitor multiple aspects of 1000 devices |
“PRTG helps us to keep control of our IT by making issues visible immediately – and everywhere. We always have an eye on the performance and availability of our IT and can react in time if any failures occur. On a long-term perspective, the monitoring data helps us with capacity planning so that we can deliver the required resources for our own systems as well as for our customers, without wasting money on unwarranted redundancies.”
PRTG brings your network, servers, and cloud infrastructure into one set of dashboards, maps, and reports. Every view updates from live sensor data, so what you see reflects what's actually happening on your network right now. The screens below show a few of the ways teams use PRTG day to day.
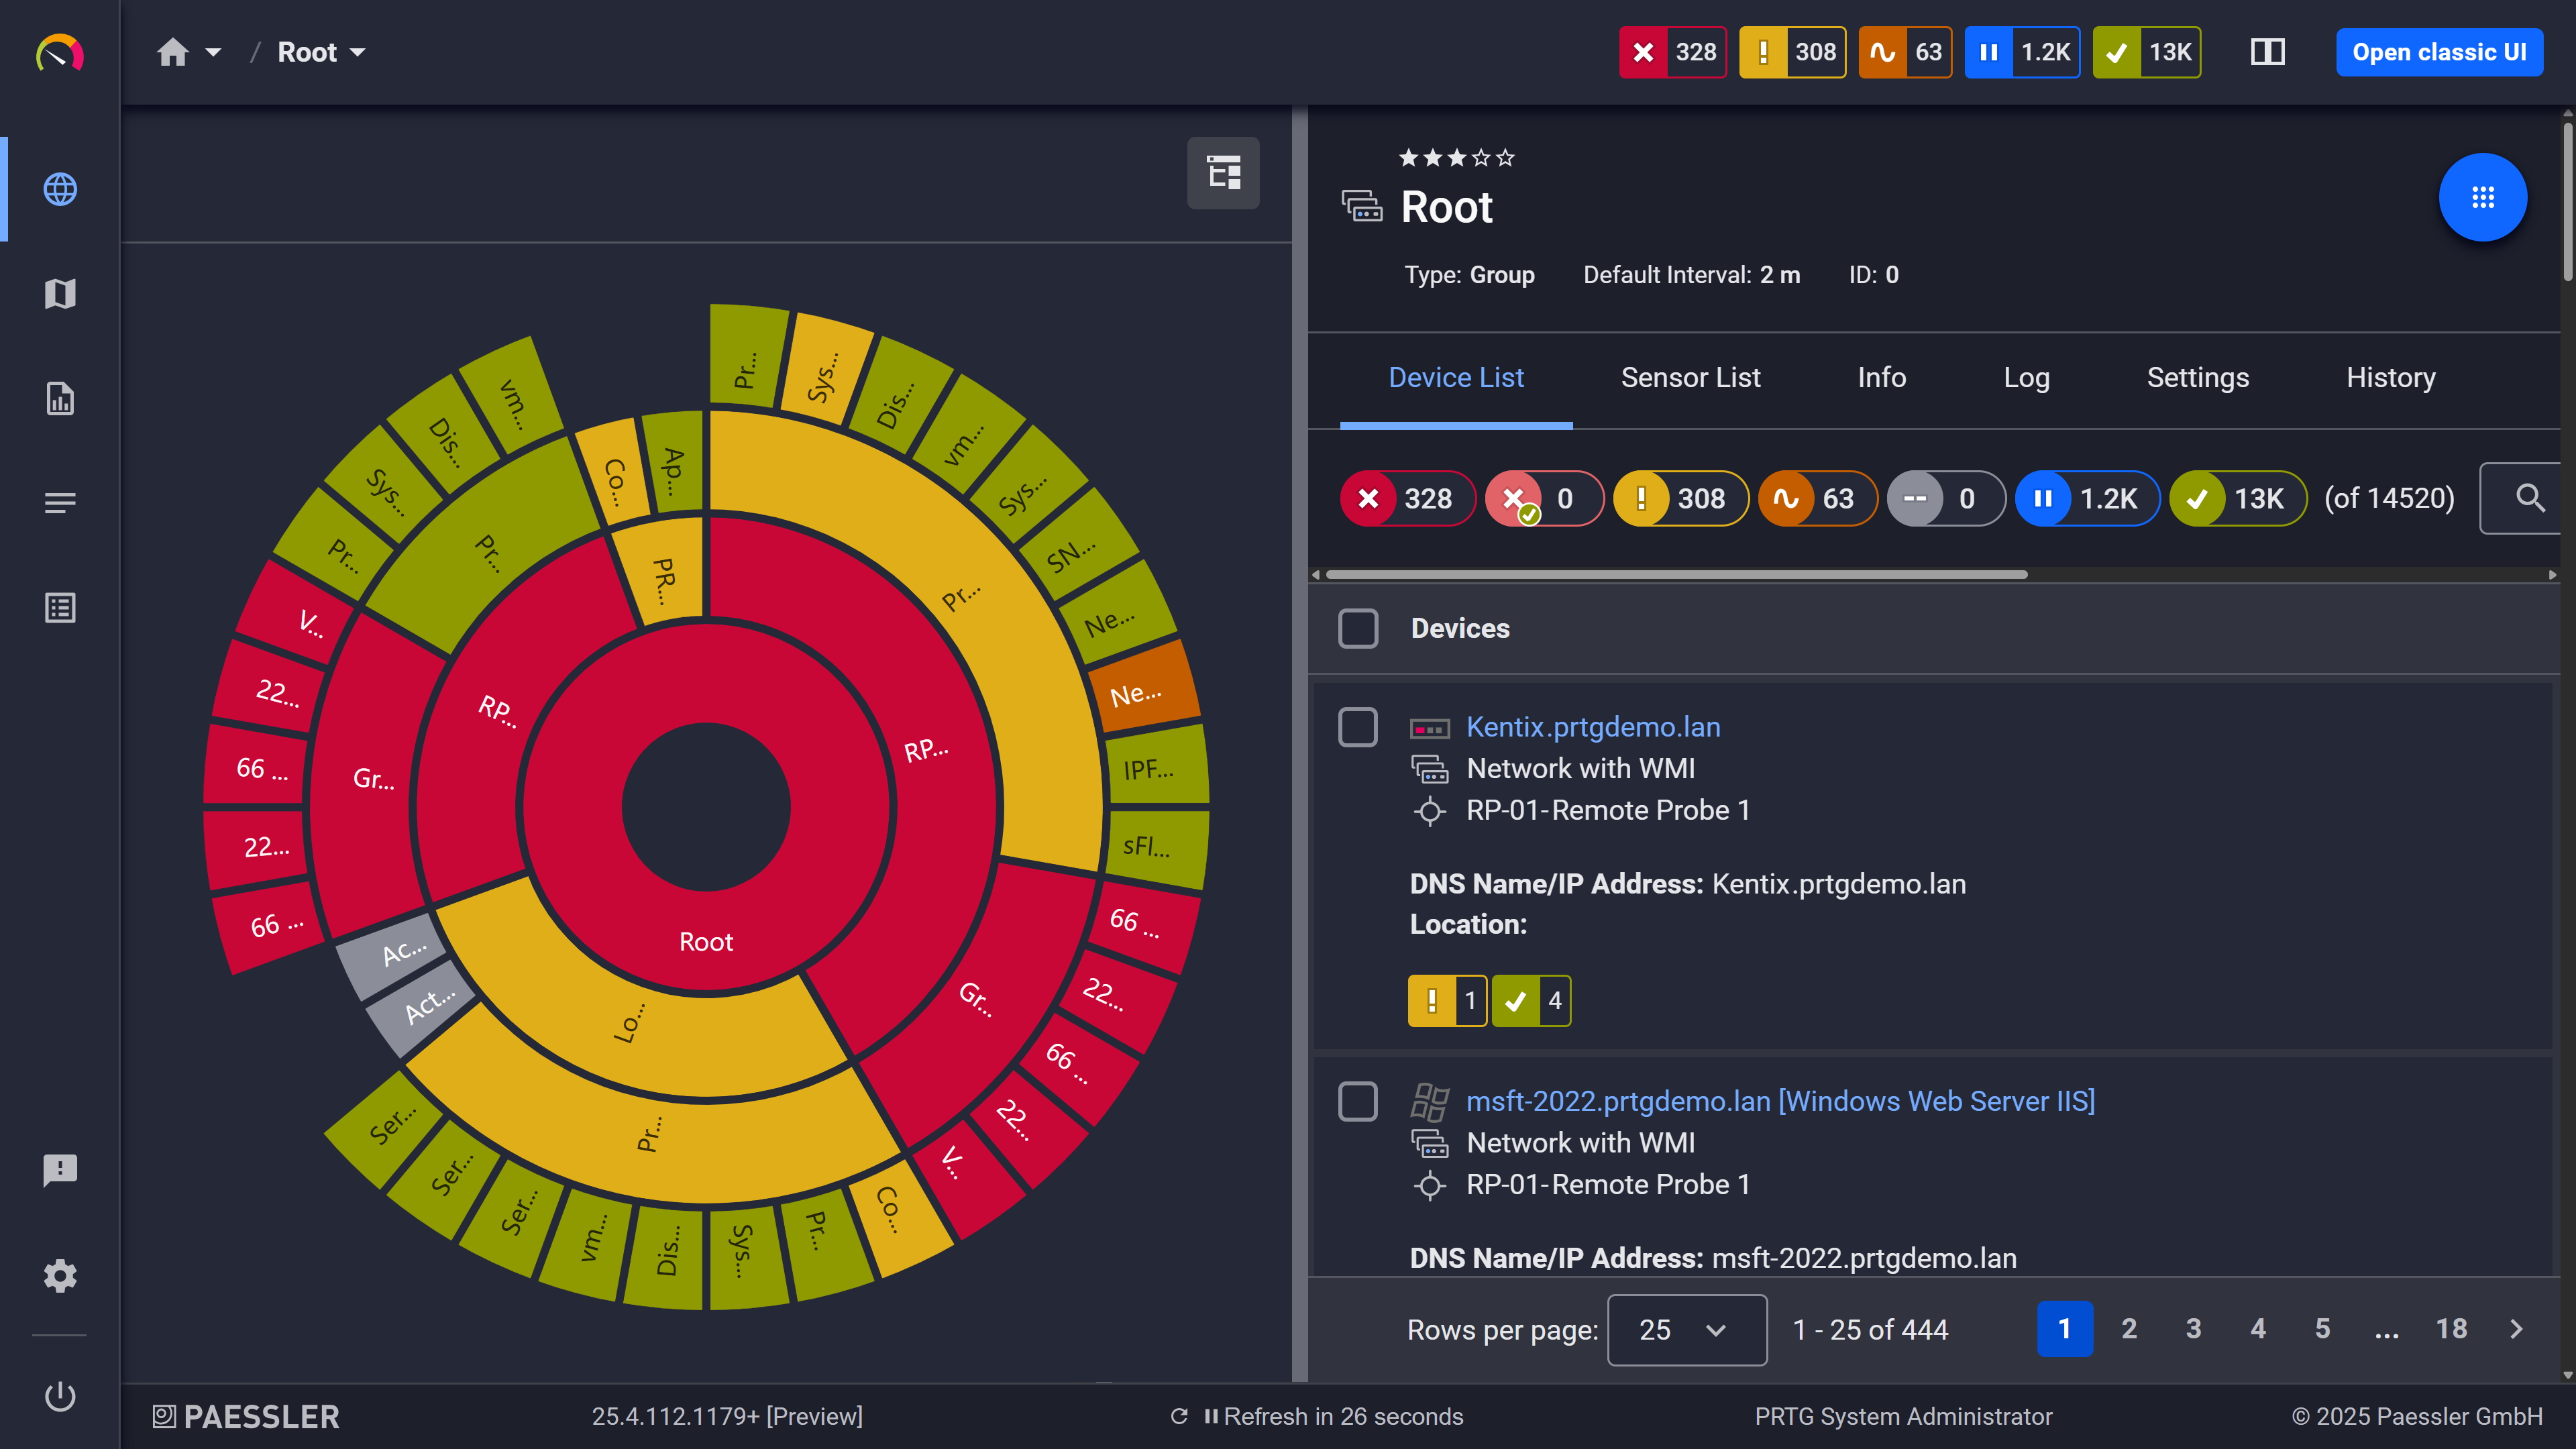
Custom dashboard: your easy-to-grasp overview built from your own sensors
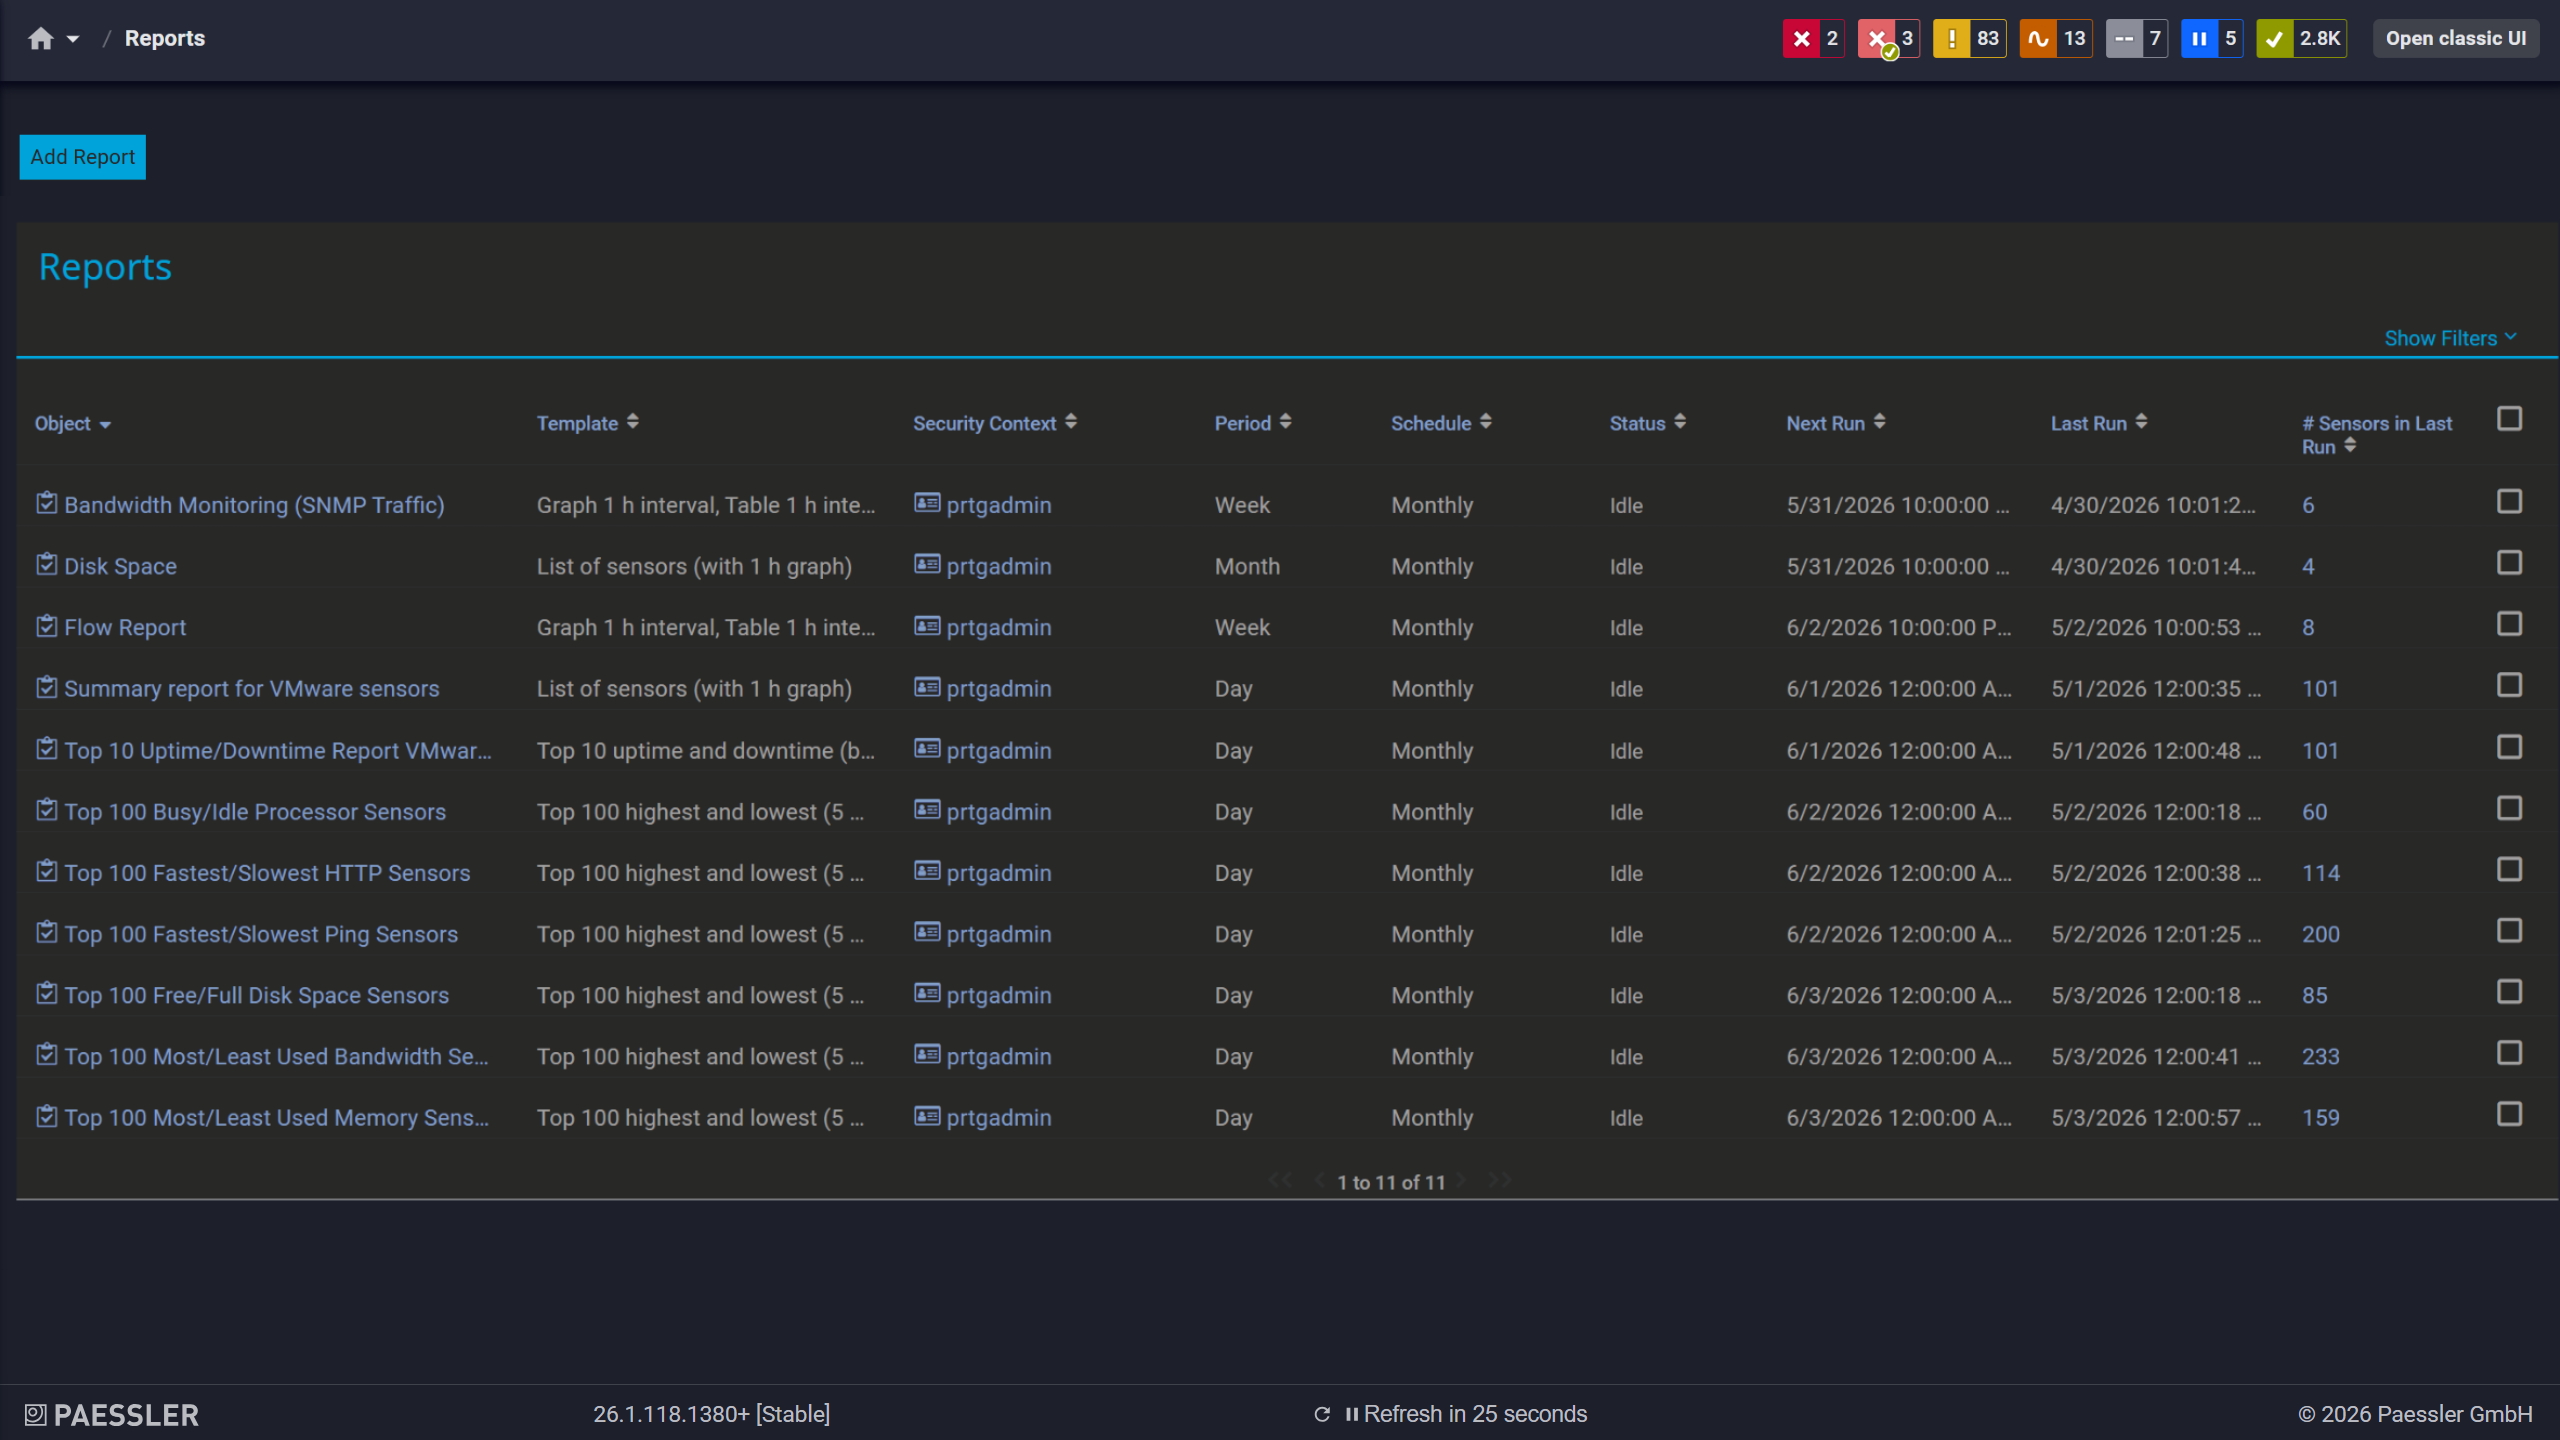
PRTG report screen: See all the reports generated and available to you in one easy to grasp overview
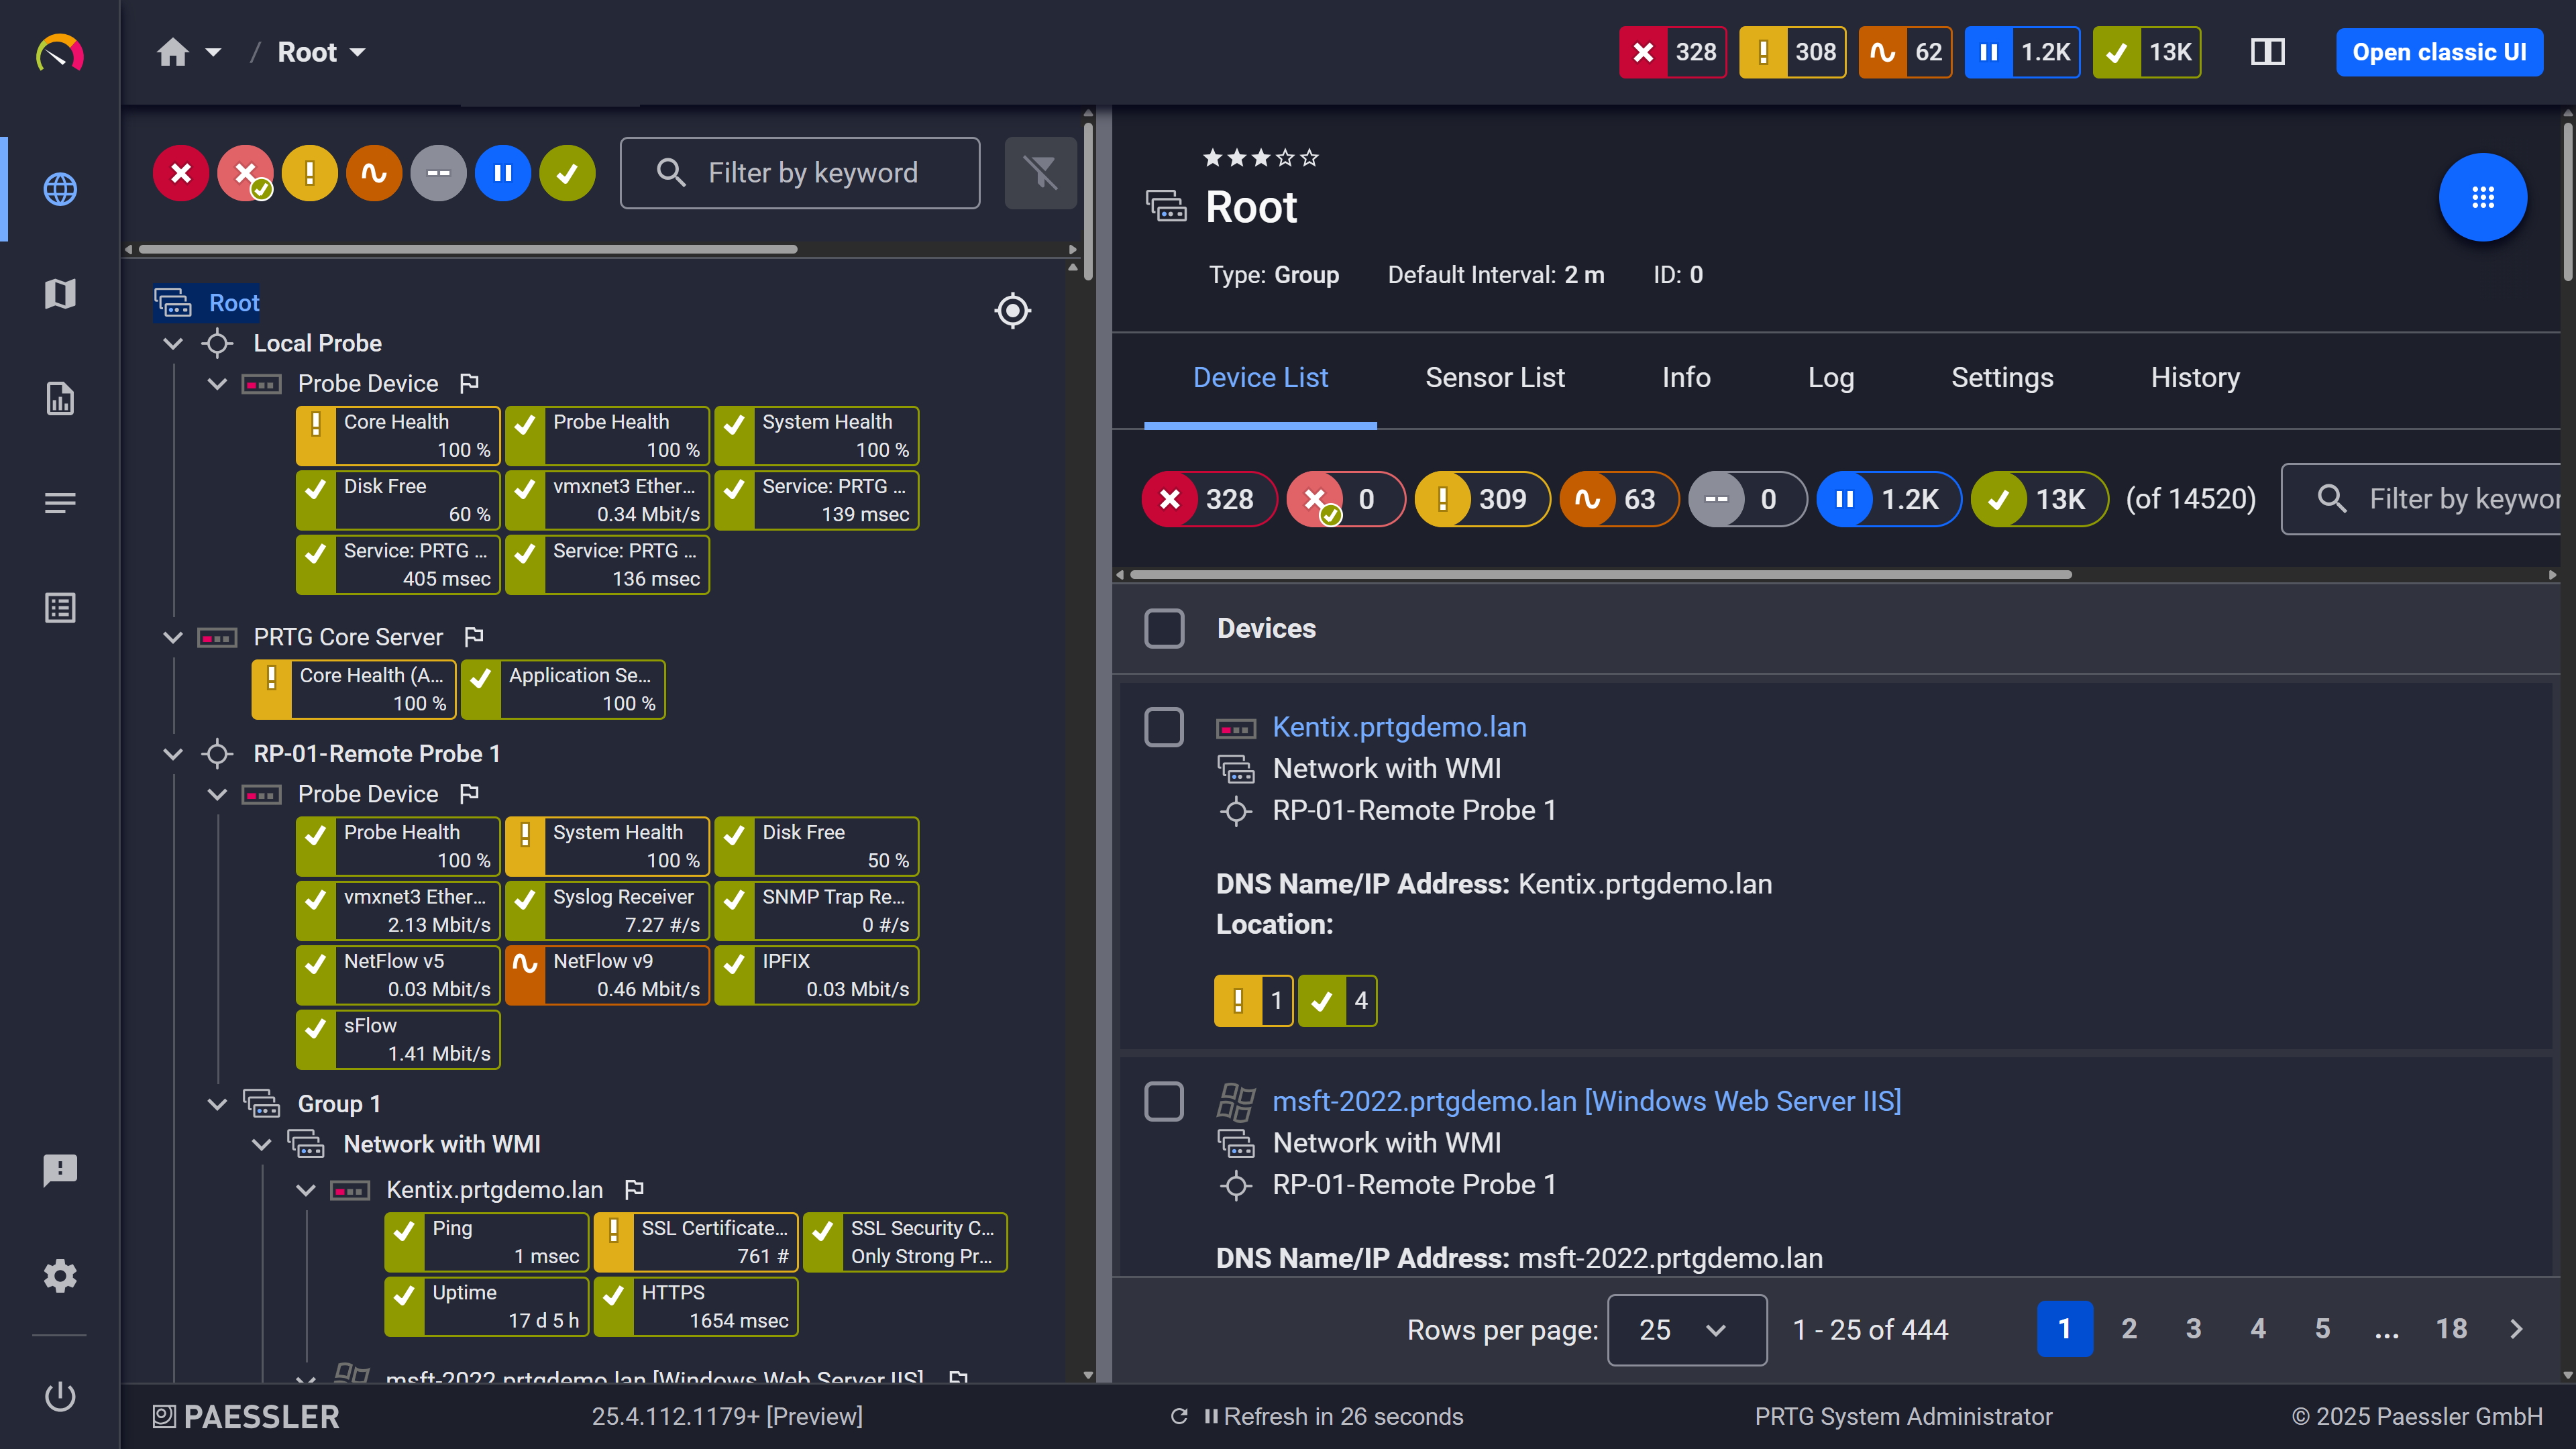
Device tree view: your full infrastructure, organized automatically after auto-discovery
Switching to PRTG follows one simple principle: your live network is the source. PRTG's auto-discovery reads what actually exists and rebuilds your monitoring directly from it. Four steps take you from your current setup to a running PRTG installation.
Have a list of hostnames or IP addresses of your current device. This can be from your own documentation, or get it from your current monitoring tool. In New Relic, list every monitored host and service from the All entities view, also known as the entity explorer, or export a precise list with an NRQL query. This list is your completeness checklist for the entire switch. Then install PRTG alongside your current tool: both can run in parallel during the transition.
Enter your IP ranges and device credentials (e.g. for protocols like SNMP or WMI). PRTG's auto-discovery scans the network segments, identifies device types, and creates suitable sensors from built-in device templates. The rebuild comes from your live network, so it reflects what is really there. Compare the result against your device list from step 1 and add any sensors auto-discovery could not infer.
What you know maps cleanly to PRTG. Entities become devices, agent-collected application and host metrics become sensors gathered agentlessly via SNMP and WMI, alert conditions become notification triggers, and NRQL dashboards become maps. Then recreate your alerting workflows with PRTG's notification templates and triggers.
Compare alerts side by side for a few weeks. Adjust thresholds and schedules, and build the maps and reports your team and leadership rely on. Decommission the old tool once PRTG has proven itself in daily operation.
New Relic One was the name of New Relic's unified observability platform before the company simplified its branding to just New Relic. The product and the comparison on this page are the same either way. PRTG takes a different approach: instead of a code-first observability platform, it's built for infrastructure and network visibility across your entire environment, on one sensor-based license.
Not natively. PRTG focuses on infrastructure, network, server, and cloud monitoring, the layer beneath your applications, using pre-configured sensors and auto-discovery. For code-level diagnostics like distributed tracing, you can extend PRTG with custom sensors and scripting, or keep it running alongside a dedicated APM tool. Many teams use PRTG for everything outside the application layer, since that's usually the bigger blind spot.
PRTG’s interface is built for information density: dashboards, maps, and tables that show a lot of infrastructure at a glance. Dashboards and maps are customizable, so most teams narrow the view to what their role needs.
PRTG licenses count sensors, and one sensor typically represents one monitored value, like a server's CPU load or a switch port's traffic. That number is fixed by what you choose to monitor, not by how much data flows through your systems or how many people need access. New Relic's usage-based model instead meters data ingest by the gigabyte and licenses full platform access by seat, while PRTG's sensor count stays fixed to what you've chosen to monitor.
Yes. PRTG supports unlimited remote probes at no extra license cost, so you can monitor separate locations, subnets, or business units from one central instance without a per-site fee. Our 2026 survey of 1,088 IT teams found that decentralized enterprises are the segment most likely to monitor distributed sites or remote offices, at 55.3% versus 40.5% overall, so this is a common setup, not an edge case. Each site can run independently within the same PRTG installation.
Not necessarily, and that's fine either way. PRTG replaces the infrastructure, network, and server monitoring layer, not code-level application performance monitoring. Many teams run PRTG alongside a dedicated APM tool: PRTG for everything outside the application, and an APM tool for what happens inside it. If your primary need was always infrastructure and network visibility rather than code-level tracing, PRTG alone may cover what you actually use New Relic for today.
Yes. If you're looking for New Relic alternatives for on-premise deployment, PRTG runs on your own servers or in the cloud, your choice, while New Relic is cloud-only. Many teams also find it one of the easier alternatives to New Relic for monitoring, since auto-discovery sets up your infrastructure automatically instead of requiring an agent on every host or application.
We also compared PRTG with other monitoring tools:
NinjaOne focuses on endpoint management with per-device pricing. PRTG delivers comprehensive infrastructure monitoring with transparent sensor-based pricing and agentless capabilities.
UptimeRobot is great for cron, port, website, response time and uptime monitoring. For complex needs or advanced features, a more comprehensive monitoring tool like PRTG is recommended.
Dynatrace offers AI-driven monitoring but with complex consumption-based pricing. PRTG delivers comprehensive monitoring with straightforward sensor-based pricing and flexible deployment options.
Comparison with Dynatrace
OpenNMS is hard to beat for flexibility and configurability, but making the most of it requires time, patience, and expertise. PRTG is just as powerful and offers a high level of customization, but it's much quicker and easier to set up.
Start a 30-day trial with unlimited sensors, no commitment required.
Tell us your device count and we'll send you a quote.
See PRTG in a live demo with one of our monitoring experts.
