
Last reviewed: 10/2026


PRTG's auto-discovery scans your network, works out what each device is, and applies matching sensors from a library of more than 250 pre-configured types, covering servers, network hardware, virtualization, cloud, and OT in one pass. All of it lives inside a single license, so closing a blind spot means adding a sensor, not adding a platform. That gives your team broad visibility and alerting, without tracing a request through application code or determining root cause automatically. It's built to show you what changed and where to look, so your team can act on an alert instead of digging through logs first.
A PRTG license is sized by the number of sensors you run, fixed at purchase and unaffected by how much data those sensors collect. A sensor is one monitored value, a switch port's traffic or a server's CPU load, so the same license covers your network, server, application, and cloud monitoring however busy that infrastructure gets. There's no separate meter running underneath it for memory, storage, or session volume. When you outgrow a tier, you upgrade to the next one and know the new number before you commit.
PRTG's auto-discovery does the initial setup itself: it scans your network, works out what each device is, and attaches the matching sensors from its own library, all before anyone writes a line of configuration. According to our 2026 survey of 1,088 IT teams, 75.7% of midmarket respondents run monitoring with a team of just two to five people, and PRTG is built for exactly that reality. There's no platform-engineering role to hire and no query language to learn before you see your first dashboard. Tuning comes later, once you know what you actually want to watch closely, not before you can see anything at all.
FEATURE | PRTG PRTG | Dynatrace Dynatrace |
|---|---|---|
Cover network, servers, and applications with one license | PRTG Included in every PRTG license, no add-on modules | Dynatrace Limited. Network device monitoring runs through a separate ActiveGate component with per-vendor SNMP extensions, deployed apart from OneAgent |
Know your monitoring bill before the month starts | PRTG Sensor count is fixed at purchase, unaffected by data volume | Dynatrace Limited. Metered across host-hours, memory tier, log GiB, and session volume together, with memory-tier changes alone shifting the rate |
Run monitoring without hiring a dedicated platform team | PRTG Auto-discovery and pre-configured sensors, no specialized role required | Dynatrace Limited. Independent reviews describe a steep learning curve, with advanced configuration taking meaningfully more time to master |
Monitor bandwidth across branch offices | PRTG NetFlow, jFlow, sFlow, and IPFIX sensors show per-link, per-protocol traffic from every site in one dashboard | Dynatrace Network extensions report device- and interface-level traffic through Infrastructure & Operations |
Keep virtualization hosts in view | PRTG Native VMware, Hyper-V, and Nutanix sensors, no agent installed on the guest | Dynatrace OneAgent auto-instruments hosts and containers as part of Full-Stack Monitoring |
Alert the on-call engineer before users notice a problem | PRTG Multi-channel alerting (email, SMS, push, Slack, Microsoft Teams, or webhook to tools like PagerDuty) fires the moment a sensor crosses its threshold | Dynatrace Davis AI correlates anomalies across the stack into a single automated problem notification |
Get root-cause context when something breaks | PRTG Limited. PRTG surfaces historical trend data and diagnostic sensors for manual investigation, not automated causal analysis | Dynatrace Davis AI identifies the underlying cause of a detected problem automatically |
Trace a problem back through application code | PRTG Limited. PRTG monitors application and service availability from the outside, through HTTP, API, and database sensors, with no code-level distributed tracing | Dynatrace OneAgent captures code-level traces across services automatically |
Monitor OT and industrial protocols alongside IT | PRTG Native OPC UA, Modbus, and MQTT sensors sit in the same license as standard IT protocols | Dynatrace No OPC UA, Modbus, or MQTT support found in Dynatrace's own documentation |
Give each site or business unit its own independent setup | PRTG Each site runs its own separate PRTG installation by default, PRTG Enterprise Monitor’s MultiBoard for optional central oversight | Dynatrace Limited. Default model is one tenant segmented by role-based Management Zones, and splitting into separate tenants later means reconfiguring every agent |
A PRTG license is sized by the number of sensors you run, chosen when you buy and shown clearly before you commit. Once set, that number doesn't change based on how much data those sensors collect, so a busier network or a bigger log volume doesn't move your bill the way it does with usage-metered pricing. Choose the tier that fits your environment today, and upgrade only when you need more sensors, not more gigabytes.
| License Name | License description | Price | License Details | Get started | Pricing Details | |
|---|---|---|---|---|---|---|
| PRTG 500 | $200 | per month paid annually | Buy nowBuy now | Enough to monitor multiple aspects of 50 devices | ||
| PRTG 1000 | $358 | per month paid annually | Buy nowBuy now | Enough to monitor multiple aspects of 100 devices | ||
| PRTG 2500 | $742 | per month paid annually | Buy nowBuy now | Enough to monitor multiple aspects of 250 devices | ||
| PRTG 5000 | $1,300 | per month paid annually | Buy nowBuy now | Enough to monitor multiple aspects of 500 devices | ||
| PRTG 10000 | $1,642 | per month paid annually | Buy nowBuy now | Enough to monitor multiple aspects of 1000 devices |
“Part of our infrastructure runs with Azure. This information is then sent to PRTG via Powershell. Paessler is a great solution for us. We get alerts sent directly to our phones and if something goes wrong somewhere, we can immediately deal with it. It’s our lifeline. This is why Paessler gives us a sense of security no matter what the time of day.”
Once auto-discovery finishes, PRTG puts your infrastructure in one dashboard. Devices, sensors, and their current status sit together, organized the way your team actually works. From there, alerts, trends, and custom views are a few clicks away, not a separate tool or export.
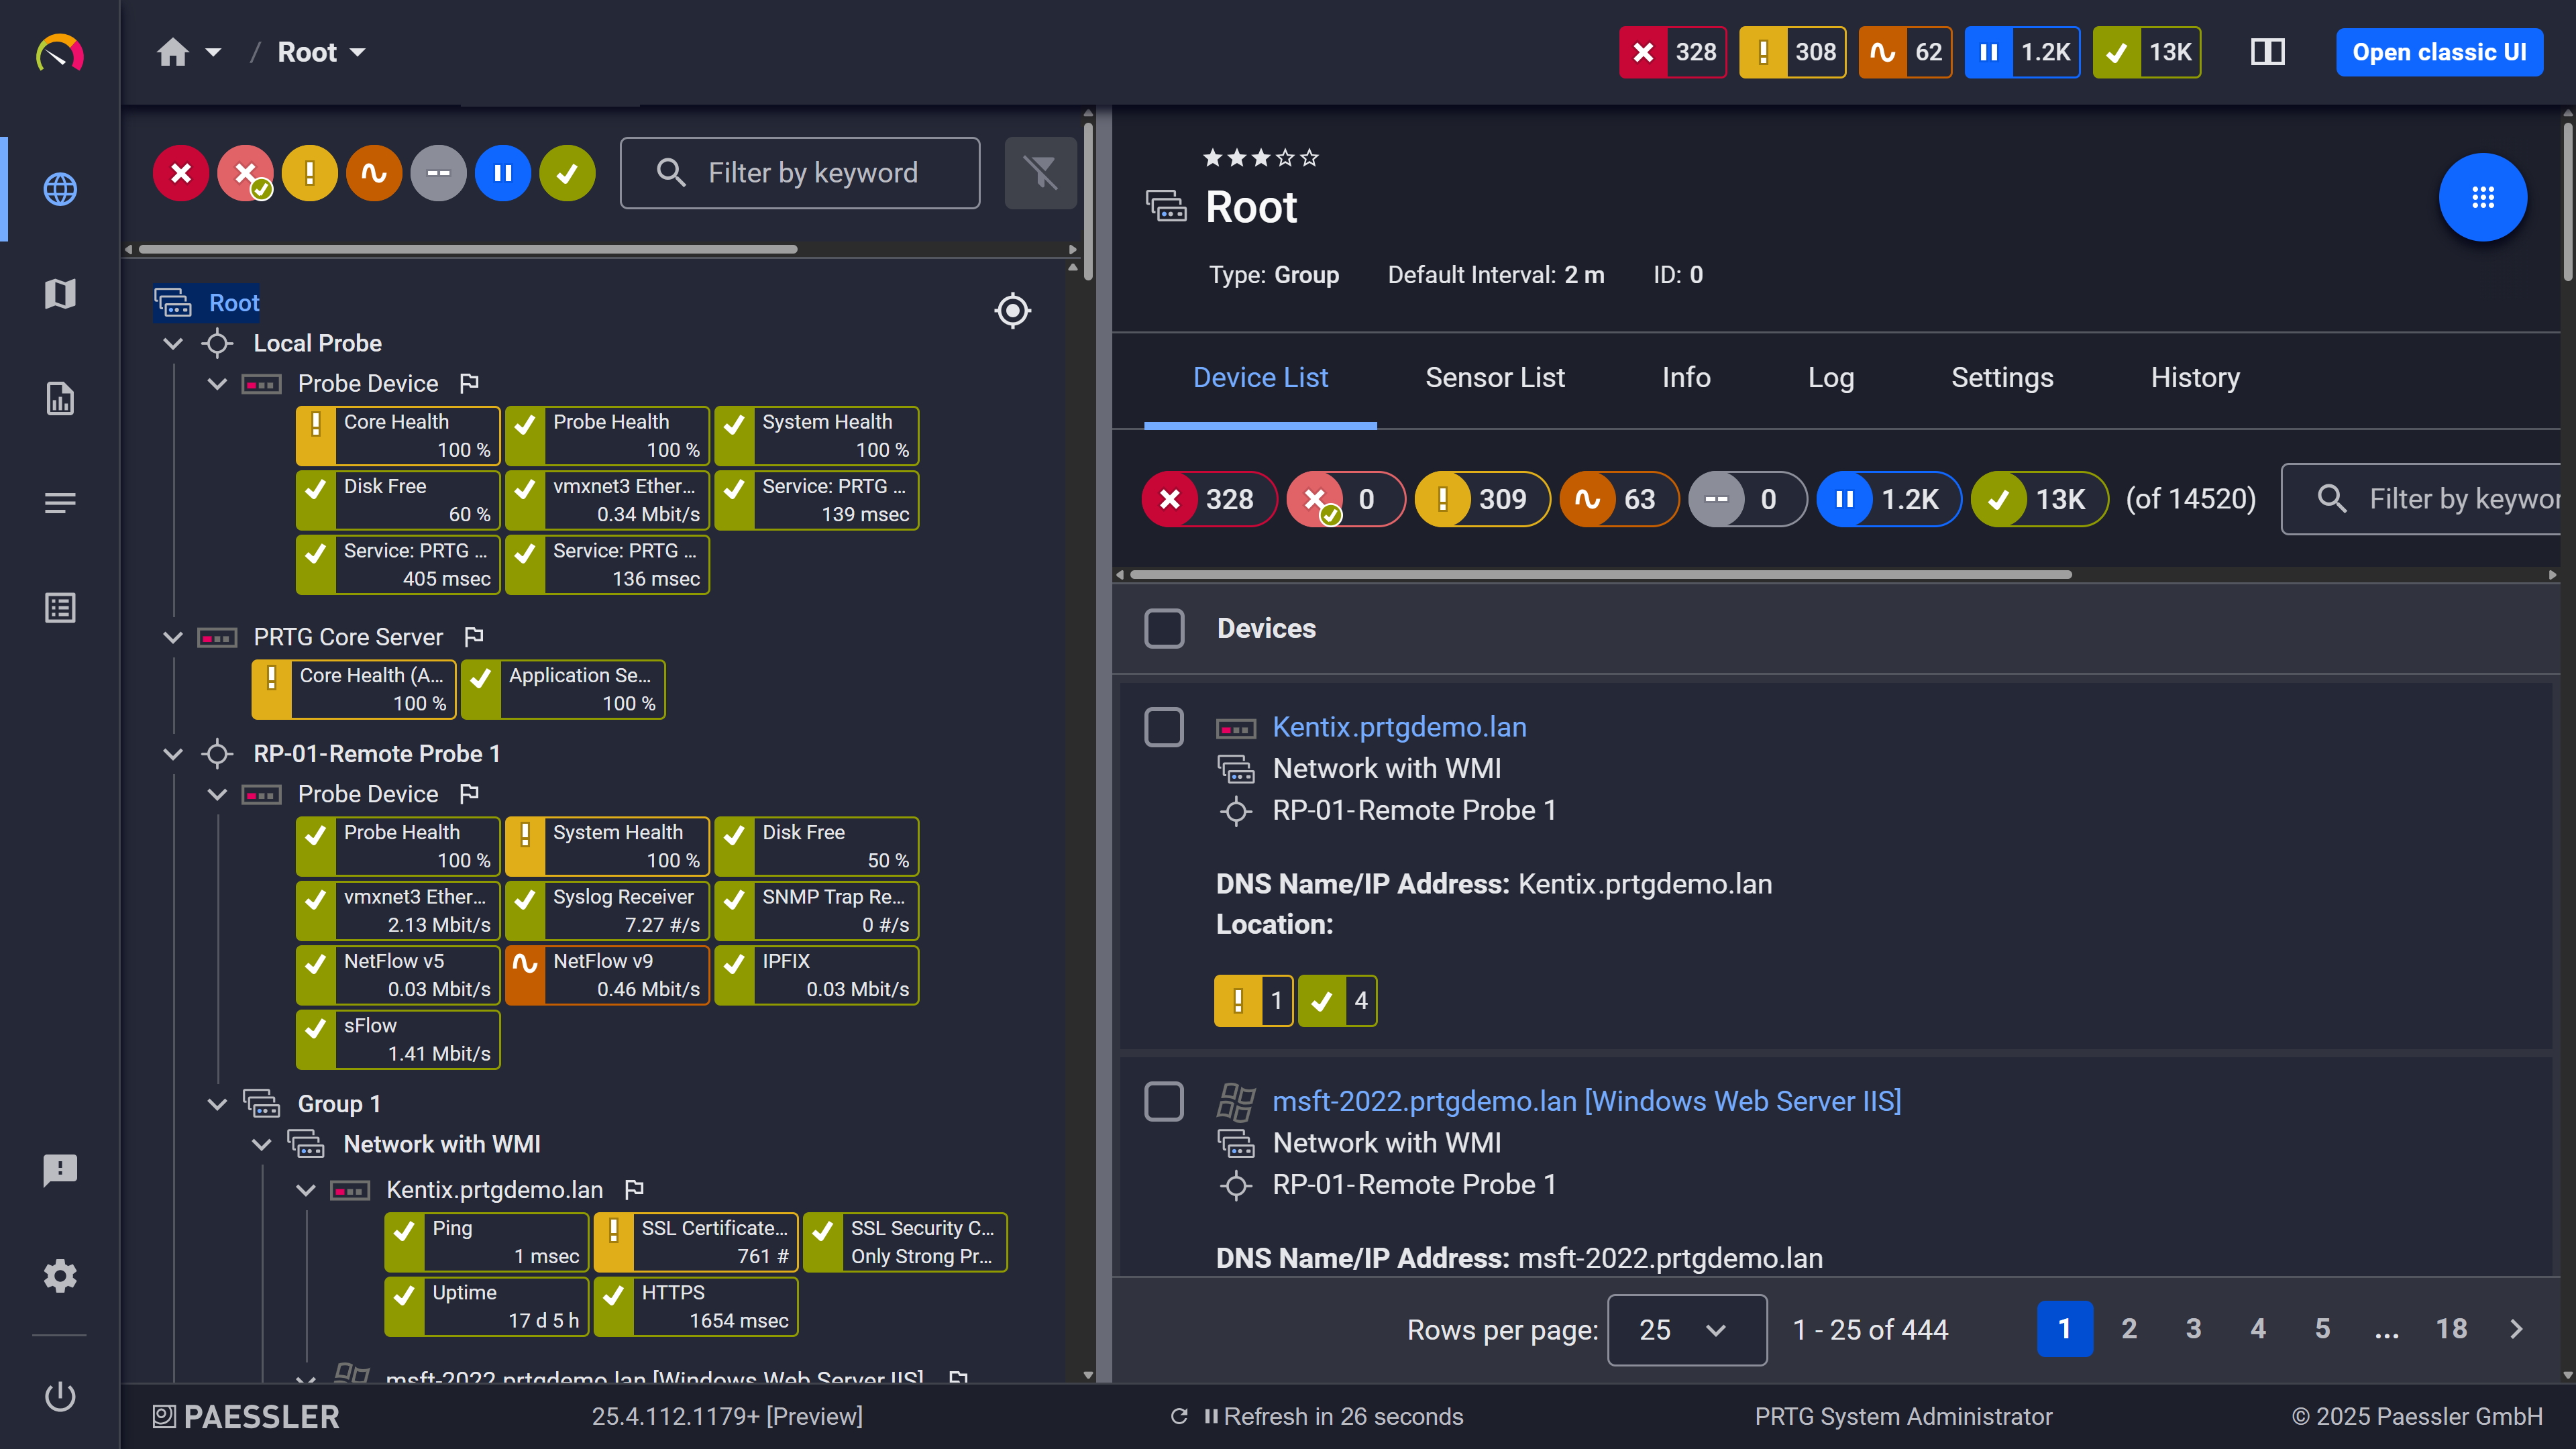
Device tree view: your full infrastructure, organized automatically after auto-discovery
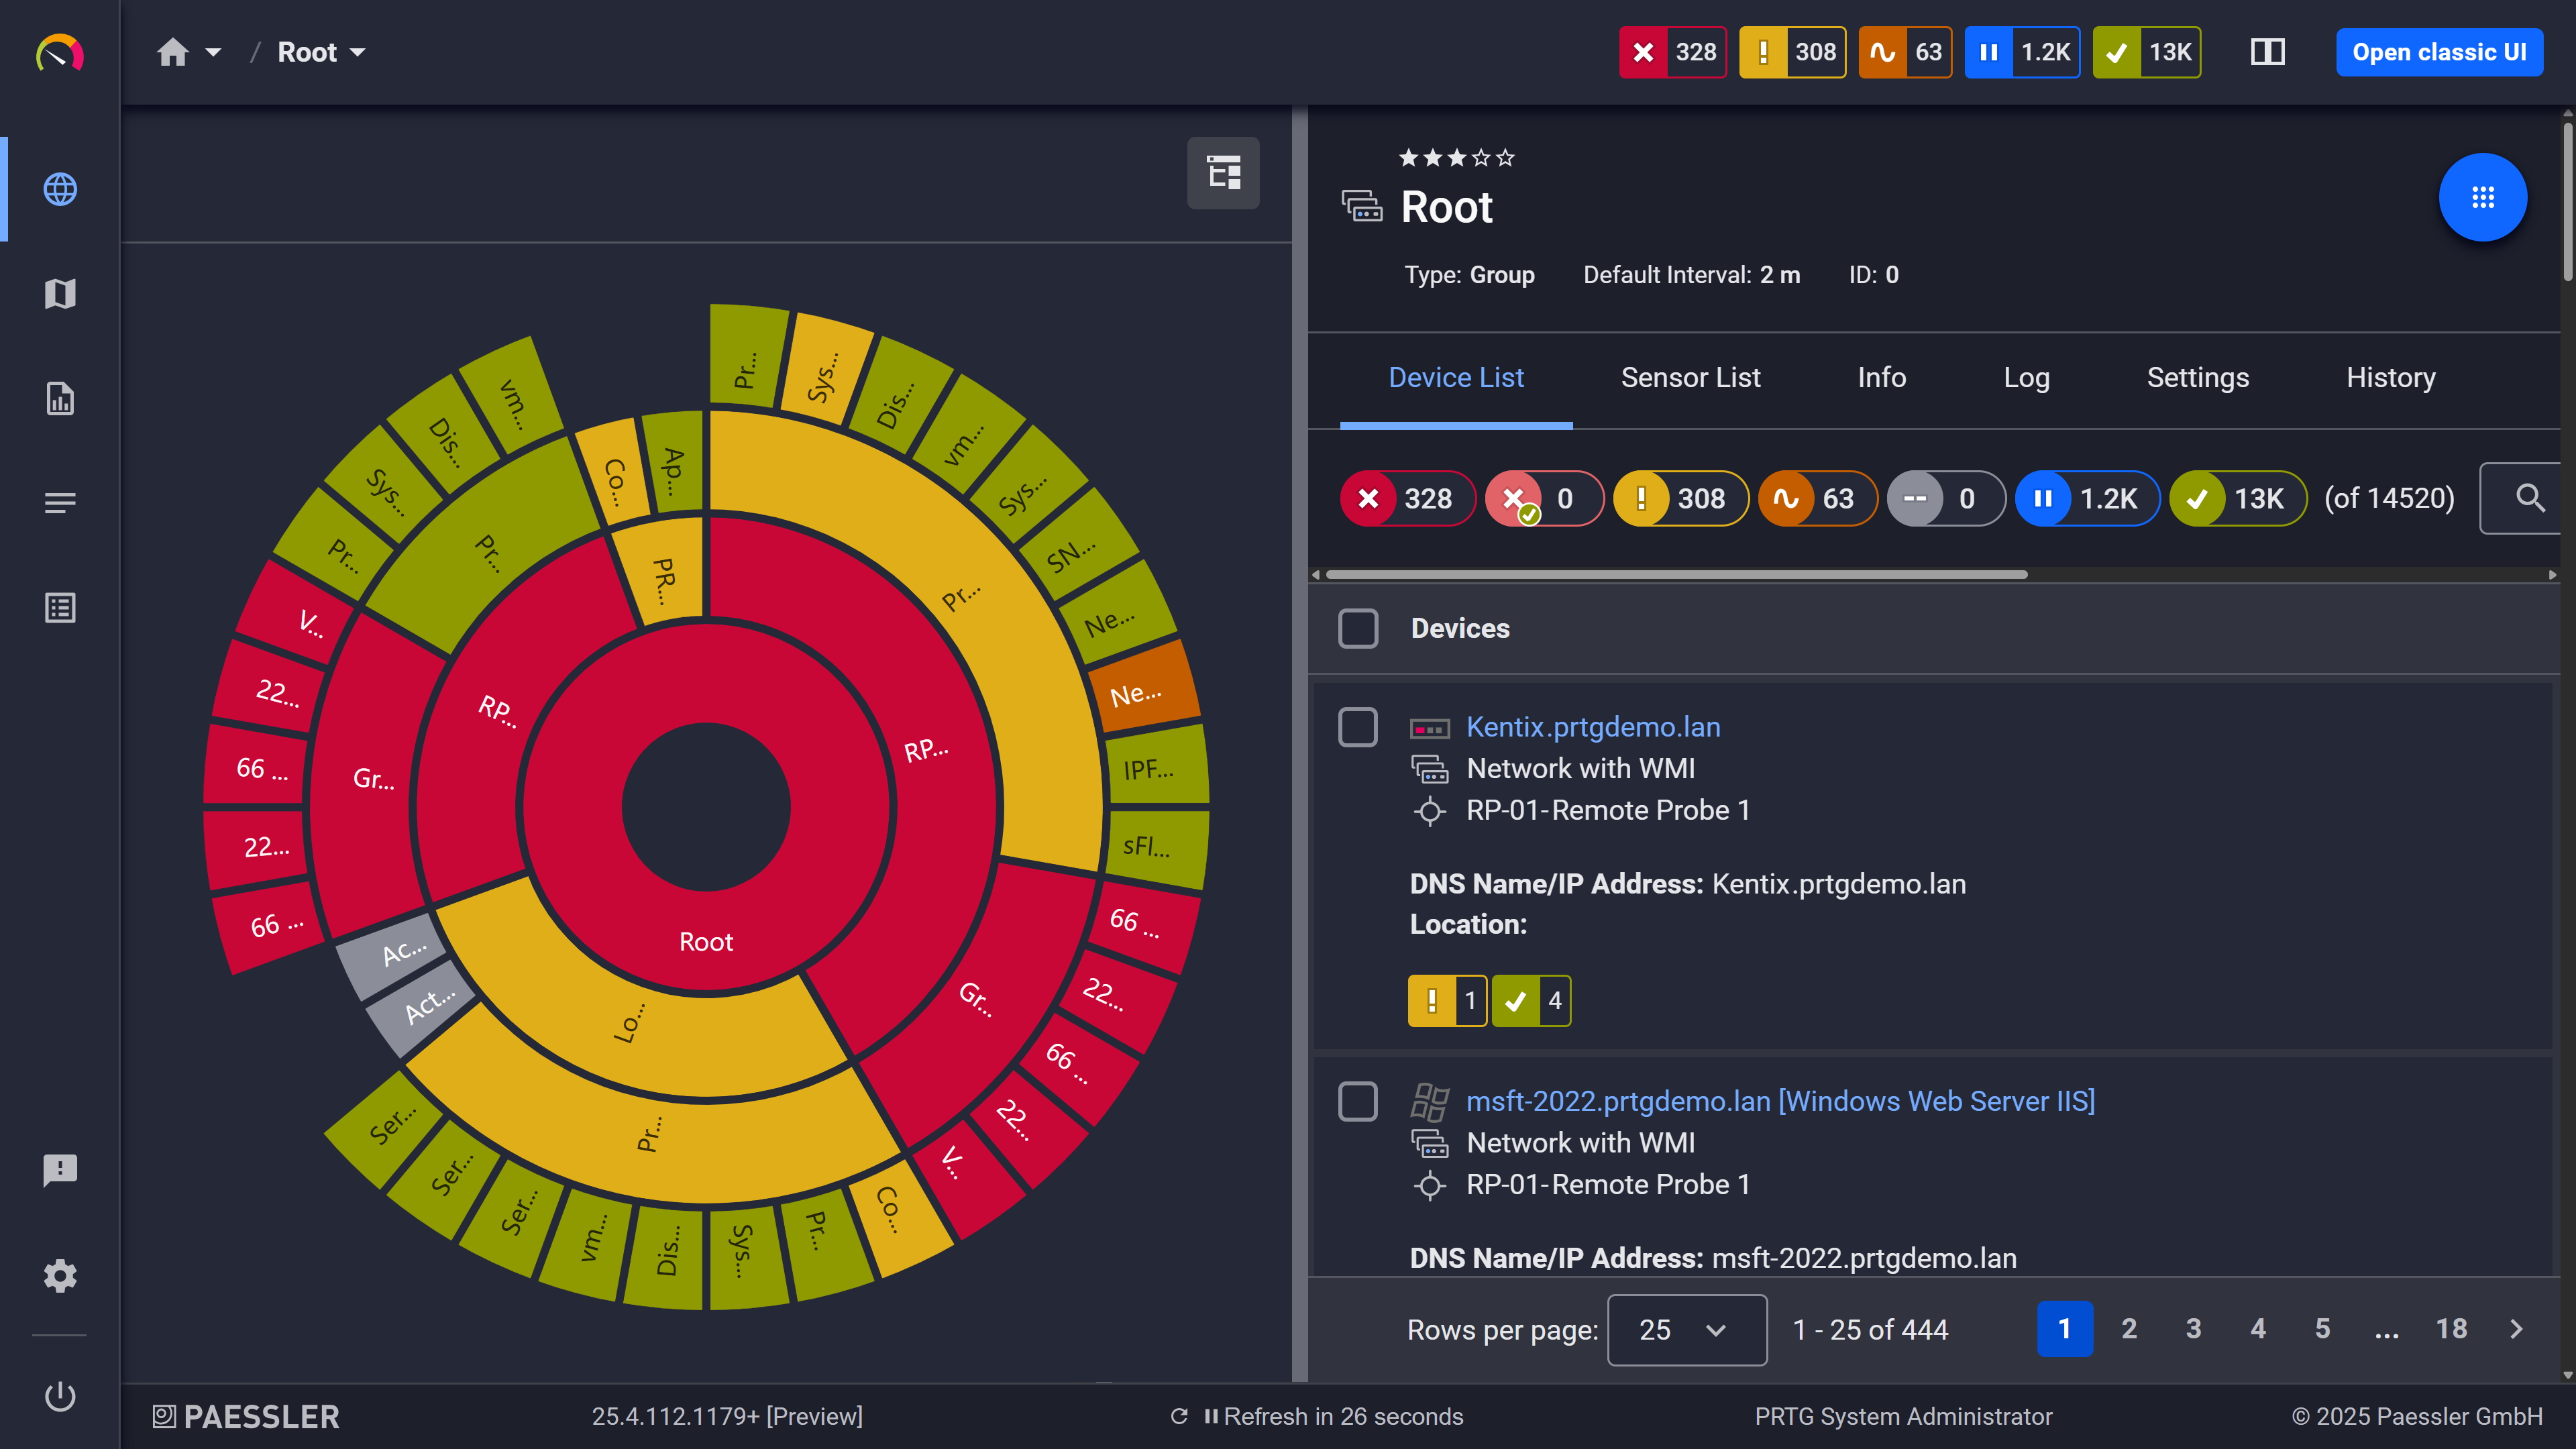
Custom dashboard: your easy-to-grasp overview built from your own sensors
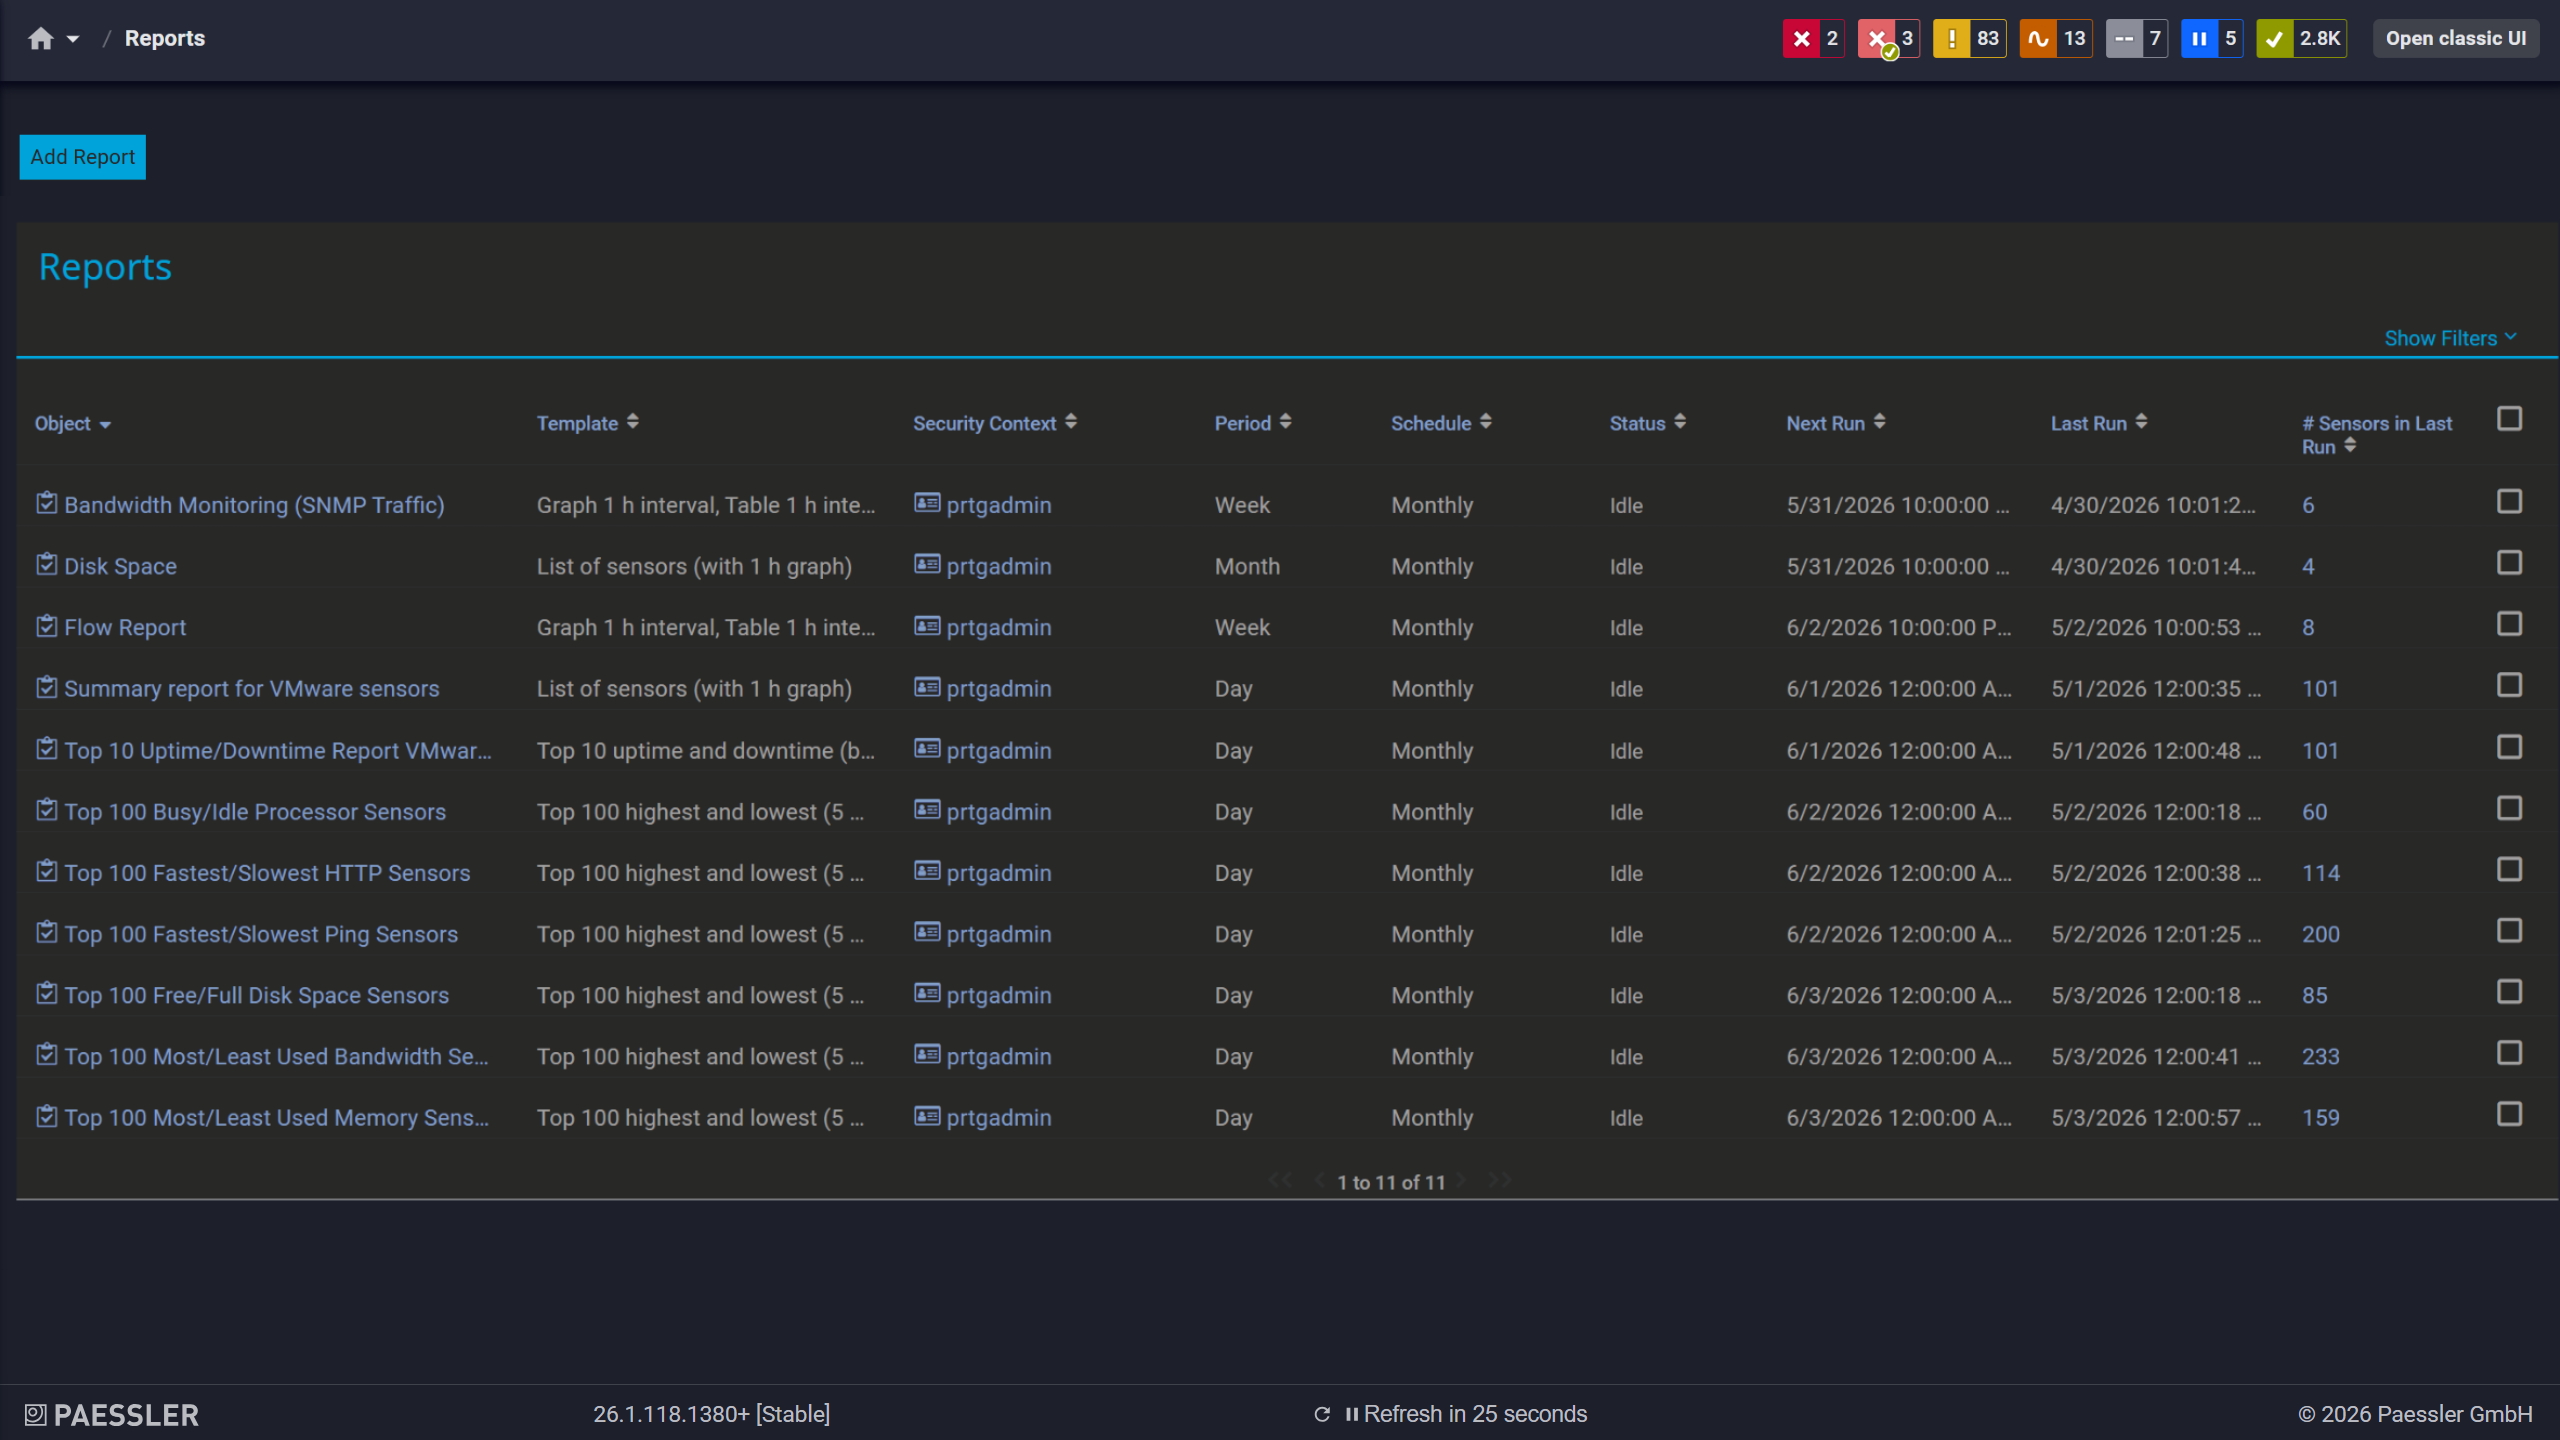
PRTG report screen: See all the reports generated and available to you in one easy to grasp overview
Switching to PRTG follows one simple principle: your live network is the source. PRTG's auto-discovery reads what actually exists and rebuilds your monitoring directly from it. Four steps take you from your current setup to a running PRTG installation.
Have a list of hostnames or IP adresses of your current device. This can be from your own documentation, or get it from your current monitoring tool. In Dynatrace, pull your monitored hosts from the Hosts view under Infrastructure & Operations, or query the Entities API for a complete list. This list is your completeness checklist for the entire switch. Then install PRTG alongside your current tool: both can run in parallel during the transition.
Let auto-discovery rebuild your monitoring. Enter your IP ranges and device credentials (e.g. for protocols like SNMP or WMI). PRTG's auto-discovery scans the network segments, identifies device types, and creates suitable sensors from built-in device templates. The rebuild comes from your live network, so it reflects what is really there. Compare the result against your device list from step 1 and add any sensors auto-discovery could not infer.
Translate concepts, not configurations. What you know maps cleanly to PRTG. Hosts become devices, Management Zones become groups, ActiveGates become remote probes, and Problems become sensor alerts. Then recreate your alerting workflows with PRTG's notification templates and triggers.
Run both systems in parallel and tune. Compare alerts side by side for a few weeks. Adjust thresholds and schedules, and build the maps and reports your team and leadership rely on. Decommission the old tool once PRTG has proven itself in daily operation.
PRTG is licensed by the number of sensors your installation runs, a fixed count you choose at purchase and can see before you buy. Dynatrace's current model, the Dynatrace Platform Subscription, meters usage across host-hours, memory tier, log volume, and session count, each billed separately and able to shift month to month. There's no equivalent to PRTG's sensor count in Dynatrace's model, and no equivalent to Dynatrace's per-GiB-hour billing in PRTG's.
PRTG monitors application and service health from the outside, through HTTP, API, and database sensors that check availability, response time, and error rates. That's a different layer than tracing a request through application code or automatically determining root cause the way Dynatrace's Davis AI does. For most infrastructure and network monitoring needs that's enough on its own. Where code-level tracing is the primary requirement, that's where Dynatrace is built to go deeper.
Yes. PRTG can monitor industrial IT and includes native sensors for OPC UA, Modbus, and MQTT alongside its standard IT sensors, all in the same license. That means a plant floor's PLCs and a corporate network's switches can sit in the same dashboard without a separate tool for either side. This is one of the areas where PRTG's broader protocol support covers ground that application-focused observability platforms typically leave to other tools.
Yes, that's the recommended pattern for organizations spread across sites. Each location runs its own separate PRTG installation, complete with its own users, alerting, and data, with no access to any other site's setup by default. For central visibility across all of them, PRTG's Enterprise Console lets an admin oversee every installation from one place without merging their data or permissions.
PRTG includes a built-in map editor for building your own network topology views and dashboards, based on the devices and sensors it discovers. For network and infrastructure-level topology, that gives you full coverage natively. Dynatrace's Smartscape works differently, automatically generating application-level dependency maps from agent data, which is a different layer than PRTG's network view. Most teams switching from Dynatrace for infrastructure monitoring find PRTG's map editor covers what they actually need day to day.
PRTG already unifies network, server, virtualization, cloud, and OT monitoring under one license with 250+ pre-configured sensors, closing most of the blind spots that drive consolidation projects in the first place. Adding coverage for a new device type is usually a matter of adding a sensor, not adding a platform. Where deep application tracing is the actual gap, that's a different, narrower need than infrastructure monitoring.
According to our 2026 survey of 1,088 IT teams, 60.2% of midmarket respondents said the main reason they chose PRTG was to cover their whole infrastructure with one tool, more than any other reason we asked about. That lines up with what a broader platform often asks for in return: a bigger team, a new query language, and a bill that moves with usage. For teams that need infrastructure visibility without taking on all of that, PRTG's sensor coverage is usually enough on its own.
Yes, that's the recommended way to do it. Run PRTG's auto-discovery against your existing infrastructure while Dynatrace stays in place, so you can compare coverage side by side before switching any alerting over. Once you're confident PRTG has what you need, decommissioning Dynatrace's agents is the last step, not the first.
We also compared PRTG with other monitoring tools:
Centreon is highly customizable but complex to configure. PRTG offers powerful monitoring, an intuitive interface, easy setup, and transparent sensor-based pricing that’s budget-friendly.
Ethereal is a legacy packet sniffing tool acquired by Wireshark. It lacks more comprehensive network monitoring and traffic analysis features which let you keep a close eye on your entire infrastructure.
Opsview is feature-packed and scalable but complex to set up with opaque pricing. PRTG offers enterprise-grade features in a user-friendly environment with transparent pricing.
WhatsUp Gold might be your choice if you need good network mapping capabilities for networks which aren’t that complex. But to get the full set of monitoring features, you need to invest in costly add-ons.
Start a 30-day trial with unlimited sensors, no commitment required.
Tell us your device count and we'll send you a quote.
See PRTG in a live demo with one of our monitoring experts.
