• Company
    • About Us
    • Case Studies
    • Press Center
    • Careers
    • Blog
    • Contact us
  • Contact us
  • Login
 
  • English
    • Deutsch
    • Español
    • Français
    • Italiano
    • Português
Paessler
                    - The Monitoring Experts
  • Products
    • Paessler PRTG
      Paessler PRTGMonitor your whole IT infrastructure
      • PRTG Network Monitor
      • PRTG Enterprise Monitor
      • PRTG Hosted Monitor
      • PRTG UVexplorer
      • PRTG extensionsExtensions for Paessler PRTGExtend your monitoring to a new level
    • Icon Features
      FeaturesExplore all monitoring features
      • Maps & dashboards
      • Alerts & notifications
      • Multiple user interfaces
      • Distributed monitoring
      • Customizable reporting
  • Solutions
    • Industries
      IndustriesMonitor various industry sectors
      • Industrial
      • Healthcare
      • Data Center
      • Education
      • Finance
      • Government
    • IT Topics
      IT TopicsMonitor all areas of IT
      • Network Monitoring
      • Bandwidth Monitoring
      • SNMP Monitor
      • Network Mapping
      • WiFi Monitoring
      • Server Monitoring
  • Pricing
  • Resources
    • Getting Started
      Getting StartedModules for self-paced learning
    • How-to Guides
      How-to GuidesGet the most out of PRTG
    • Videos & Webinars
      Videos & WebinarsLearn from Paessler experts
    • IT  Knowledge
      IT KnowledgeExpand your IT knowledge
    • PRTG Manual
      PRTG ManualFull documentation
    • Knowledge Base
      Knowledge BaseShare community knowledge
    • PRTG Sensor Hub
      PRTG Sensor HubGet sensors, scripts & templates
    • Trainings
      PRTG TrainingLearn how to work with PRTG
  • Partners
    • Icon Handshake
      Become a PartnerFor resellers and channel partners
    • Icon MSP
      Become an MSPDeliver monitoring as a managed service
    • icon partner
      Partner PortalLog in to your partner account
    • Deal Registration
      Deal RegistrationRegister your sales opportunities
    • icon search
      Find a PartnerFind partners selling Paessler products
    • icon technology
      Technology AlliancesSee Paessler technology partnerships
    • Partner HubTools for Your Success
  • Company
    • About Us
    • Case Studies
    • Press Center
    • Careers
    • Blog
    • Contact us
  • Contact us
  • Login
  • English
    • Deutsch
    • Español
    • Français
    • Italiano
    • Português
  • Get a quote
  • Free trial
  1. Home>
  2. IT Topics>
  3. Technology>
  4. Ethernet Monitoring

Boost Network Performance with Ethernet Monitoring Solutions from PRTG

Eliminate ethernet problems to increase your network performance

  • Use end-to-end visibility to make sure your network performs at top level
  • Gain detailed insights with advanced ethernet traffic analysis
  • Start monitoring in minutes with out-of-the-box, specialized dashboards
Free download
PRODUCT OVERVIEW

Our Users Give Top Ratings for Monitoring With Paessler PRTG

Gartner peer insights
spiceworks
G2
Capterra

PRTG ethernet monitoring: What you will find on this page

Table of content

    PRTG makes ethernet monitoring as easy as it gets

    Custom alerts and data visualization let you quickly identify and prevent bandwidth bottlenecks, latency, and other network performance issues.

    Free download
    PRODUCT OVERVIEW

    5 problems you can solve with the PRTG ethernet monitoring tool

    When working in an IT team – especially as a system admin – there’s nothing more nerve-wrecking and time-consuming than recurring problems (which could easily be solved if you could pinpoint the root cause of the problem). Raise the curtain for Paessler PRTG, your powerful ethernet monitoring software and the solution to a lot of these issues.

    Resolve IP address conflicts

    Double allocation of IP addresses due to a DHCP server configuration error or a server failure are extremely annoying. With PRTG, you can monitor the availability and configuration of your DHCP server – simply use the WMI Service sensor or the DHCP sensor to easily solve your problems.

    Prevent packet loss

    Disconnects and loss of quality in VoIP or video calls are often related to packet loss or duplicate packets. PRTG offers various sensors like QoS (Quality of Service) One Way or QoS (Quality of Service) Round Trip so you can check jitter, packet delays, and more to get to the bottom of the problem.

    Find defective ethernet ports

    Have you experienced unexpected downtime or other issues around network management lately? And your ethernet configuration seems to be correct? With the Port v2 sensor you can check the TCP/IP ports of your router to get one step closer to the solution.

    Discover bandwidth bottlenecks

    Performance bottlenecks during peak-usage times due to high-demand applications can be a real bother. To monitor ethernet and find the bandwidth hog or adapt your network performance management, use PRTG for a deep-dive analysis of your bandwidth usage patterns in your entire network.

    Ensure fast ethernet response times

    Connecting to the internal DNS servers again takes forever and using simple online services is a test of patience? Real-time network monitoring with your PRTG ethernet testing software helps you to identify possible causes, for example if the CPU usage of a network component is too high or if there’s a problem with your database you should look into.

    What ethernet monitoring looks like in PRTG

    Diagnose network issues by continuously tracking ethernet traffic on your endpoints and in your on-premises network infrastructure. Show ethernet availability and other key metrics in real time. Visualize ethernet monitoring data in clear graphs and dashboards to identify problems more easily. Gain the overview you need to troubleshoot duplicate packets, unexpected downtimes or outages, and unwanted network loops.

    PRTG Screenshot device tree view

    Device tree view of the complete monitoring setup

    PRTG screenshot map entire it infrastructure

    Custom PRTG dashboard for keeping an eye on the entire IT infrastructure

    PRTG screenshot graph live data traffic

    Live traffic data graph in PRTG

    Start monitoring ethernet with PRTG and see how it can make your network more reliable and your job easier.

    Free download
    PRODUCT OVERVIEW

    IT experts agree: Paessler PRTG is a great solution for IT infrastructure monitoring

    PCMag

    “All-around winning
     network monitor”

    IT Brief

    “The real beauty of PRTG is the endless possibilities it offers”

    ITPro

    “PRTG Network Monitor 
    is very hard to beat”

    More than ethernet monitoring software: Improve your network performance management with PRTG

    While ethernet bandwidth monitoring is an important part of any viable network management strategy, a powerful and easy-to-use, real-time monitoring software such as PRTG can give you so much more.

    Improved network bandwidth reliability

    With PRTG, you are prepared for all eventualities. Whether you want to get to the bottom of a network congestion, check your ethernet traffic or perform general ethernet troubleshooting – PRTG is the ethernet monitoring software of your choice. Also for checking WiFi bandwidth, PRTG is the perfect solution.

    Automated and customizable alerts

    Whether it's a problem with your network devices, routers, or anything else, PRTG will alert you immediately with customizable notifications. Set individual error thresholds to trigger alerts when you need them, configure detailed alerting rules, and choose your preferred notification method such as email, SMS, or push notification.

    Detailed monitoring dashboards

    For ethernet monitoring tools to provide real value, they must not only be quick to install, but also work out of the box. To get you up and running immediately, PRTG installs quickly and offers an Auto-Discovery feature, as well as preconfigured dashboards (or maps in PRTG) and the ability to customize or create completely new ones.

    Reliable data for improved IT security

    Whether DDoS, ransomware, or the classic trojan horse –  network attacks on IT infrastructure have unfortunately become part of everyday life. PRTG is here to help you get the information you need to protect your IT by monitoring your critical security points and devices across your entire distributed network in real time.

    Streamline your entire IT/OT operations

    While you are using the SNMP Disk Free v2 sensor to check the space on your hard disks, and the free PRTG apps for iOS and Android to have a look at the latest data on the way to the server room, why not also check the OT network of your company’s production floor? Because with PRTG, you can streamline your entire IT/OT operations with one comprehensive monitoring software.

    Explore our preconfigured PRTG sensors for ethernet monitoring

    PRTG comes with more than 250 native sensor types for monitoring your entire on-premises, cloud, and hybrid cloud environment out of the box. Check out some examples below!

    WMI Service

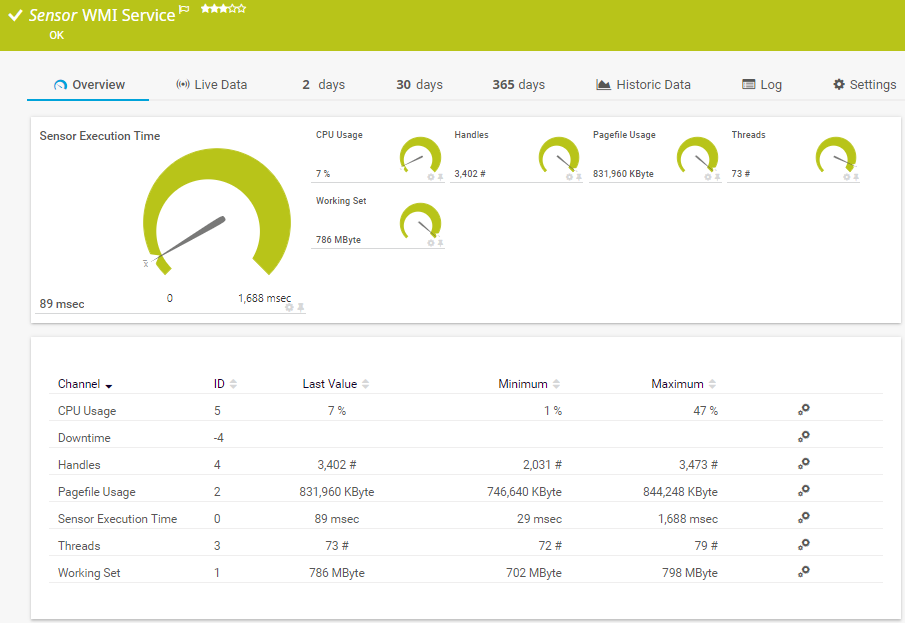
    The WMI Service sensor monitors a Windows service. It can show the following:

    • CPU usage
    • Number of handles and threads
    • Pagefile usage
    • Execution time of the monitoring request
    • Working set
    WMI Service
    WMI Service

    DHCP

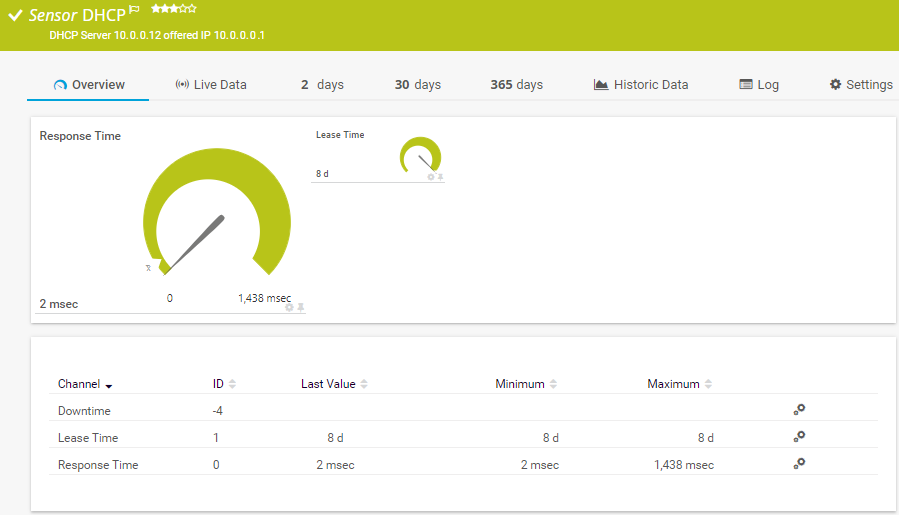
    The DHCP sensor monitors a Dynamic Host Configuration Protocol (DHCP) server. It sends a broadcast message to the network and waits for a DHCP server to respond. It can show the following:

    • Lease time reported by the server
    • Response time
    DHCP
    DHCP

    Port v2

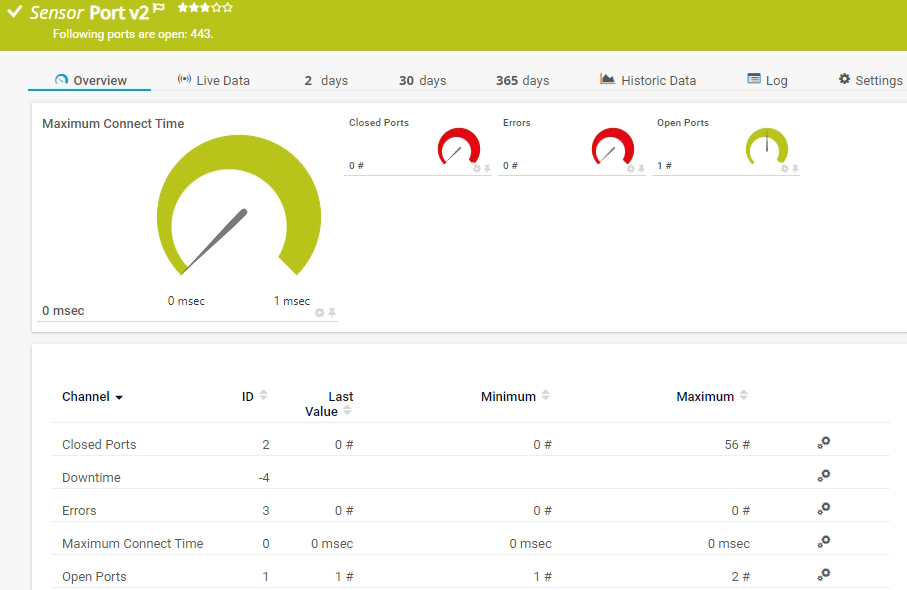
    The Port v2 sensor monitors a network service by connecting to one or more of its TCP/IP ports. It can show the following:

    • Number of open and closed ports
    • Number of errors
    • Maximum time until a request to connect to a port was accepted
    Port v2
    Port v2

    SNMP Disk Free v2

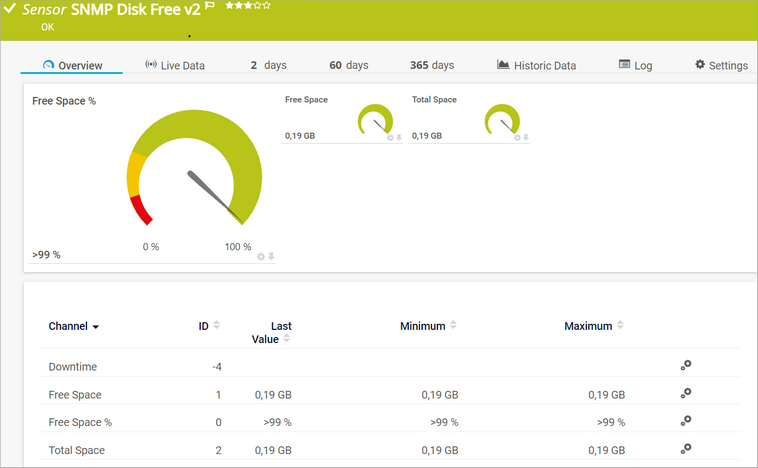
    The SNMP Disk Free v2 sensor monitors the free disk space on a logical disk. It can show the following:

    • Free space
    • Total space
    SNMP Disk Free v2
    SNMP Disk Free v2

    See the PRTG Manual for a list of all available sensor types.

    PRTG Is Compatible With All Major Vendors, Products, and Systems

    compatible with all major vendors, products, and systems

    PRTG makes ethernet monitoring as easy as it gets

    Custom alerts and data visualization let you quickly identify and prevent bandwidth bottlenecks, latency, and other network performance issues.

    Free download
    PRODUCT OVERVIEW

    “We strive to equip our systems with state-of-the-art technology to safeguard our educational practices for the future. Part of this includes ensuring that all our systems run smoothly at all times. On any given day, we rarely have time to keep an eye on all our systems. We therefore decided to monitor our school’s IT environment with a centralized network monitoring tool.”

    Stefan Roschewitz, IT administrator
    BBS Holzminden

    “We want to include the tool in our set of solutions in order to solve problems more proactively in our technology infrastructure. PRTG has exceeded all our expectations because it is a reliable, extremely easy-to-use solution. There is no doubt that it lives up to the renowned quality of German technology.”

    Esbin Saúl Lázaro García, IT Infrastructure and Security Engineer
    Hospital El Pilar

    “The reactivity, know-how, and technical solutions of Paessler are outstanding in every situation. For me, no monitoring tool compares to PRTG.”

    Andreas Reimann, Senior Networking Communication Architect
    Zurich Airport

    Your ethernet monitor at a glance – even on the go

    PRTG is set up in a matter of minutes and can be used on a wide variety of mobile devices.

    device overview
    Dell

    We are a Dell Technologies Partner  

    As one of the leading players in the IT monitoring industry, Paessler has also become an authorized Dell partner for building integrated solutions around the Dell technology ecosystem.

    What does this mean for you?

    • Easy integration of Dell hardware and software with PRTG
    • State-of-the-art features for monitoring your Dell environment
    • Expert technical support around your Dell monitoring setup

    Create innovative solutions with Paessler’s IT partners

    Partnering with innovative IT vendors, Paessler unleashes synergies to create
    new and additional benefits for joined customers.

    baramundi

    baramundi

    baramundi and PRTG create a secure, reliable and powerful IT infrastructure where you have everything under control - from the traffic in your firewall to the configuration of your clients.

    Read more
    INSYS icom

    INSYS icom

    With the combination of PRTG and Insys, the monitoring specialist Paessler and the industrial gateway manufacturer INSYS icom offer a practical possibility to merge IT and OT.

    Read more
    Siemon

    Siemon

    Siemon and Paessler bring together intelligent building technology and advanced monitoring and make your vision of intelligent buildings and data centers become reality.

    Read more

    Find the root cause of the problem with our PRTG ethernet monitoring solution

    Real-time notifications mean faster troubleshooting so that you can act before more serious issues occur.

    Free download
    PRODUCT OVERVIEW
    Paessler PRTG

    Paessler PRTG

    Network Monitoring Software – Version 26.1.116.1532 (February 9th, 2026)

    Hosting icon

    Hosting

    Download for Windows and cloud-based version PRTG Hosted Monitor available

    Languages icon

    Languages

    English, German, Spanish, French, Portuguese, Dutch, Russian, Japanese, and Simplified Chinese

    test

    Monitor everything

    Network devices, bandwidth, servers, applications, virtual environments, remote systems, IoT, and more

    test

    Pricing

    Choose the PRTG Network Monitor subscription that's best for you

    Discover more monitoring insights and stories

    Content illustration

    Powerful stories from the monitoring world

    • Video: PRTG Network Monitor – Smart Setup
    • Monitoring FortiGate Firewalls with Paessler PRTG
    • How to enable SNMP on your operating system
    Support illustration

    Resources to master your monitoring challenges

    • PRTG Manual: Windows Network Card Sensor - Paessler
    • General Layout
    • PRTG Manual: PRTG Apps for Mobile Network Monitoring - Paessler
    Solution illustration

    Solutions for all your monitoring needs

    • LAN Monitoring
    • Network Mapping
    • Network Monitoring Tool

    Ethernet Monitoring: FAQ


    What is ethernet?

    Ethernet is a common network technology. It facilitates the transmission of data over local area networks (LAN) and metropolitan area networks (MAN). It provides a standardized way for devices to communicate over a network, using a protocol that controls how the data is transmitted and ensures that the information arrives its destination safely and efficiently. It’s adaptable to both personal and professional environments and forms the backbone of most modern business networks.

    What is ethernet monitoring?

    Ethernet monitoring is the process of monitoring the health and performance of ethernet networks to ensure that they are operating efficiently and securely. By tracking real-time data such as bandwidth usage, network traffic, and device status, monitoring your ethernet helps to identify and resolve issues that can affect network connectivity and performance.

    How do I identify ethernet performance problems?

    Identifying ethernet performance issues within a network involves monitoring various metrics such as network traffic, bandwidth utilization, the health of network devices including routers, switches and repeaters, and security-related parts like the firewall.

    Ethernet performance monitoring software such as PRTG provides real-time visibility into these metrics, allowing IT professionals to detect anomalies that may indicate problems such as network congestion, bandwidth bottlenecks, or failing hardware.

    How will ethernet problems affect my network?

    Ethernet problems can result in network downtime, reduced data transfer speeds, and overall network instability. These problems can disrupt business operations, resulting in lost productivity, negative financial impact, and potential security risks. Persistent problems can also drain IT resources, as teams spend more time troubleshooting and less time on future projects and strategic initiatives. With stable and up-to-date ethernet monitoring you can start countering these problems.

    How does PRTG solve ethernet bandwidth monitoring challenges?

    PRTG streamlines ethernet bandwidth monitoring by providing a comprehensive set of tools to continuously track network performance. This includes features like:

    • Monitoring ethernet traffic in real-time to quickly pinpoint the source of problems
    • Packet sniffing – the detailed examination of data packets to identify anomalies or bottlenecks
    • LAN health monitoring, which continuously checks the health of the local area network to prevent and resolve problems in a timely manner
    Can PRTG be used as an ethernet performance test tool?

    Yes, PRTG can be used as an ethernet performance test tool or a ethernet testing software. Thanks to the large number of specialized ethernet monitoring sensors, data such as uptime monitoring or bandwidth consumption can be collected and visualized.

    Since PRTG is also an advanced bandwidth calculator and network reporting tool, you can quickly find out where bottlenecks are and how they affect your ethernet performance. You always have the right software to improve your network performance strategy and to monitor your entire IT infrastructure.

    What is a sensor in PRTG?

    In PRTG, “sensors” are the basic monitoring elements. One sensor usually monitors one measured value in your network, for example the traffic of a switch port, the CPU load of a server, or the free space on a disk drive. On average, you need about 5-10 sensors per device or one sensor per switch port.

    We asked: would you recommend PRTG? Over 95% of our customers say yes!

    Paessler conducted trials in over 600 IT departments worldwide to tune its network monitoring software closer to the needs of sysadmins. The result of the survey: over 95% of the participants would recommend PRTG – or already have.

    recommendation

    Still not convinced?

    Love

    More than 500,000 sysadmins love PRTG

    Paessler PRTG is used by companies of all sizes. Sysadmins love PRTG because it makes their job a whole lot easier.

    PRTG

    Monitor your entire IT infrastructure

    Bandwidth, servers, virtual environments, websites, VoIP services – PRTG keeps an eye on your entire network.

    test

    Try Paessler PRTG for free

    Everyone has different monitoring needs. That’s why we let you try PRTG for free.

    PRTG Logo

    Start monitoring ethernet with PRTG and see how it can make your network more reliable and your job easier.

    Free download
    PRODUCT OVERVIEW

    Products

    • Paessler PRTG
      Paessler PRTGMonitor your whole IT infrastructure
      • PRTG Network Monitor
      • PRTG Enterprise Monitor
      • PRTG Hosted Monitor
      • PRTG UVexplorer
      • PRTG extensions
        Extensions for Paessler PRTGExtend your monitoring to a new level
    • Icon Features
      FeaturesExplore all monitoring features

    Monitoring with PRTG

    • Network monitoring
    • Bandwidth monitoring
    • SNMP monitoring
    • Network mapping
    • Wi-Fi monitoring
    • Server monitoring
    • Network traffic analyzer
    • NetFlow monitoring
    • Syslog server

    Useful Links

    • PRTG Manual
    • Knowledge Base
    • Customer Success Stories
    • About Paessler
    • Subscribe to newsletter
    • PRTG Support
    • PRTG Consulting
    • PRTG Feedback & Roadmap

    Contact

    Paessler GmbH
    Thurn-und-Taxis-Str. 14, 
    90411 Nuremberg 
    Germany

    [email protected]

    +49 911 93775-0

    • Contact us
    ©2026 Paessler GmbHTerms & ConditionsPrivacy PolicyImprintReport VulnerabilityDownload & InstallSitemap
    Graylog Alternative Graylog Alternative Graylog Alternative